方案详情文
智能文字提取功能测试中
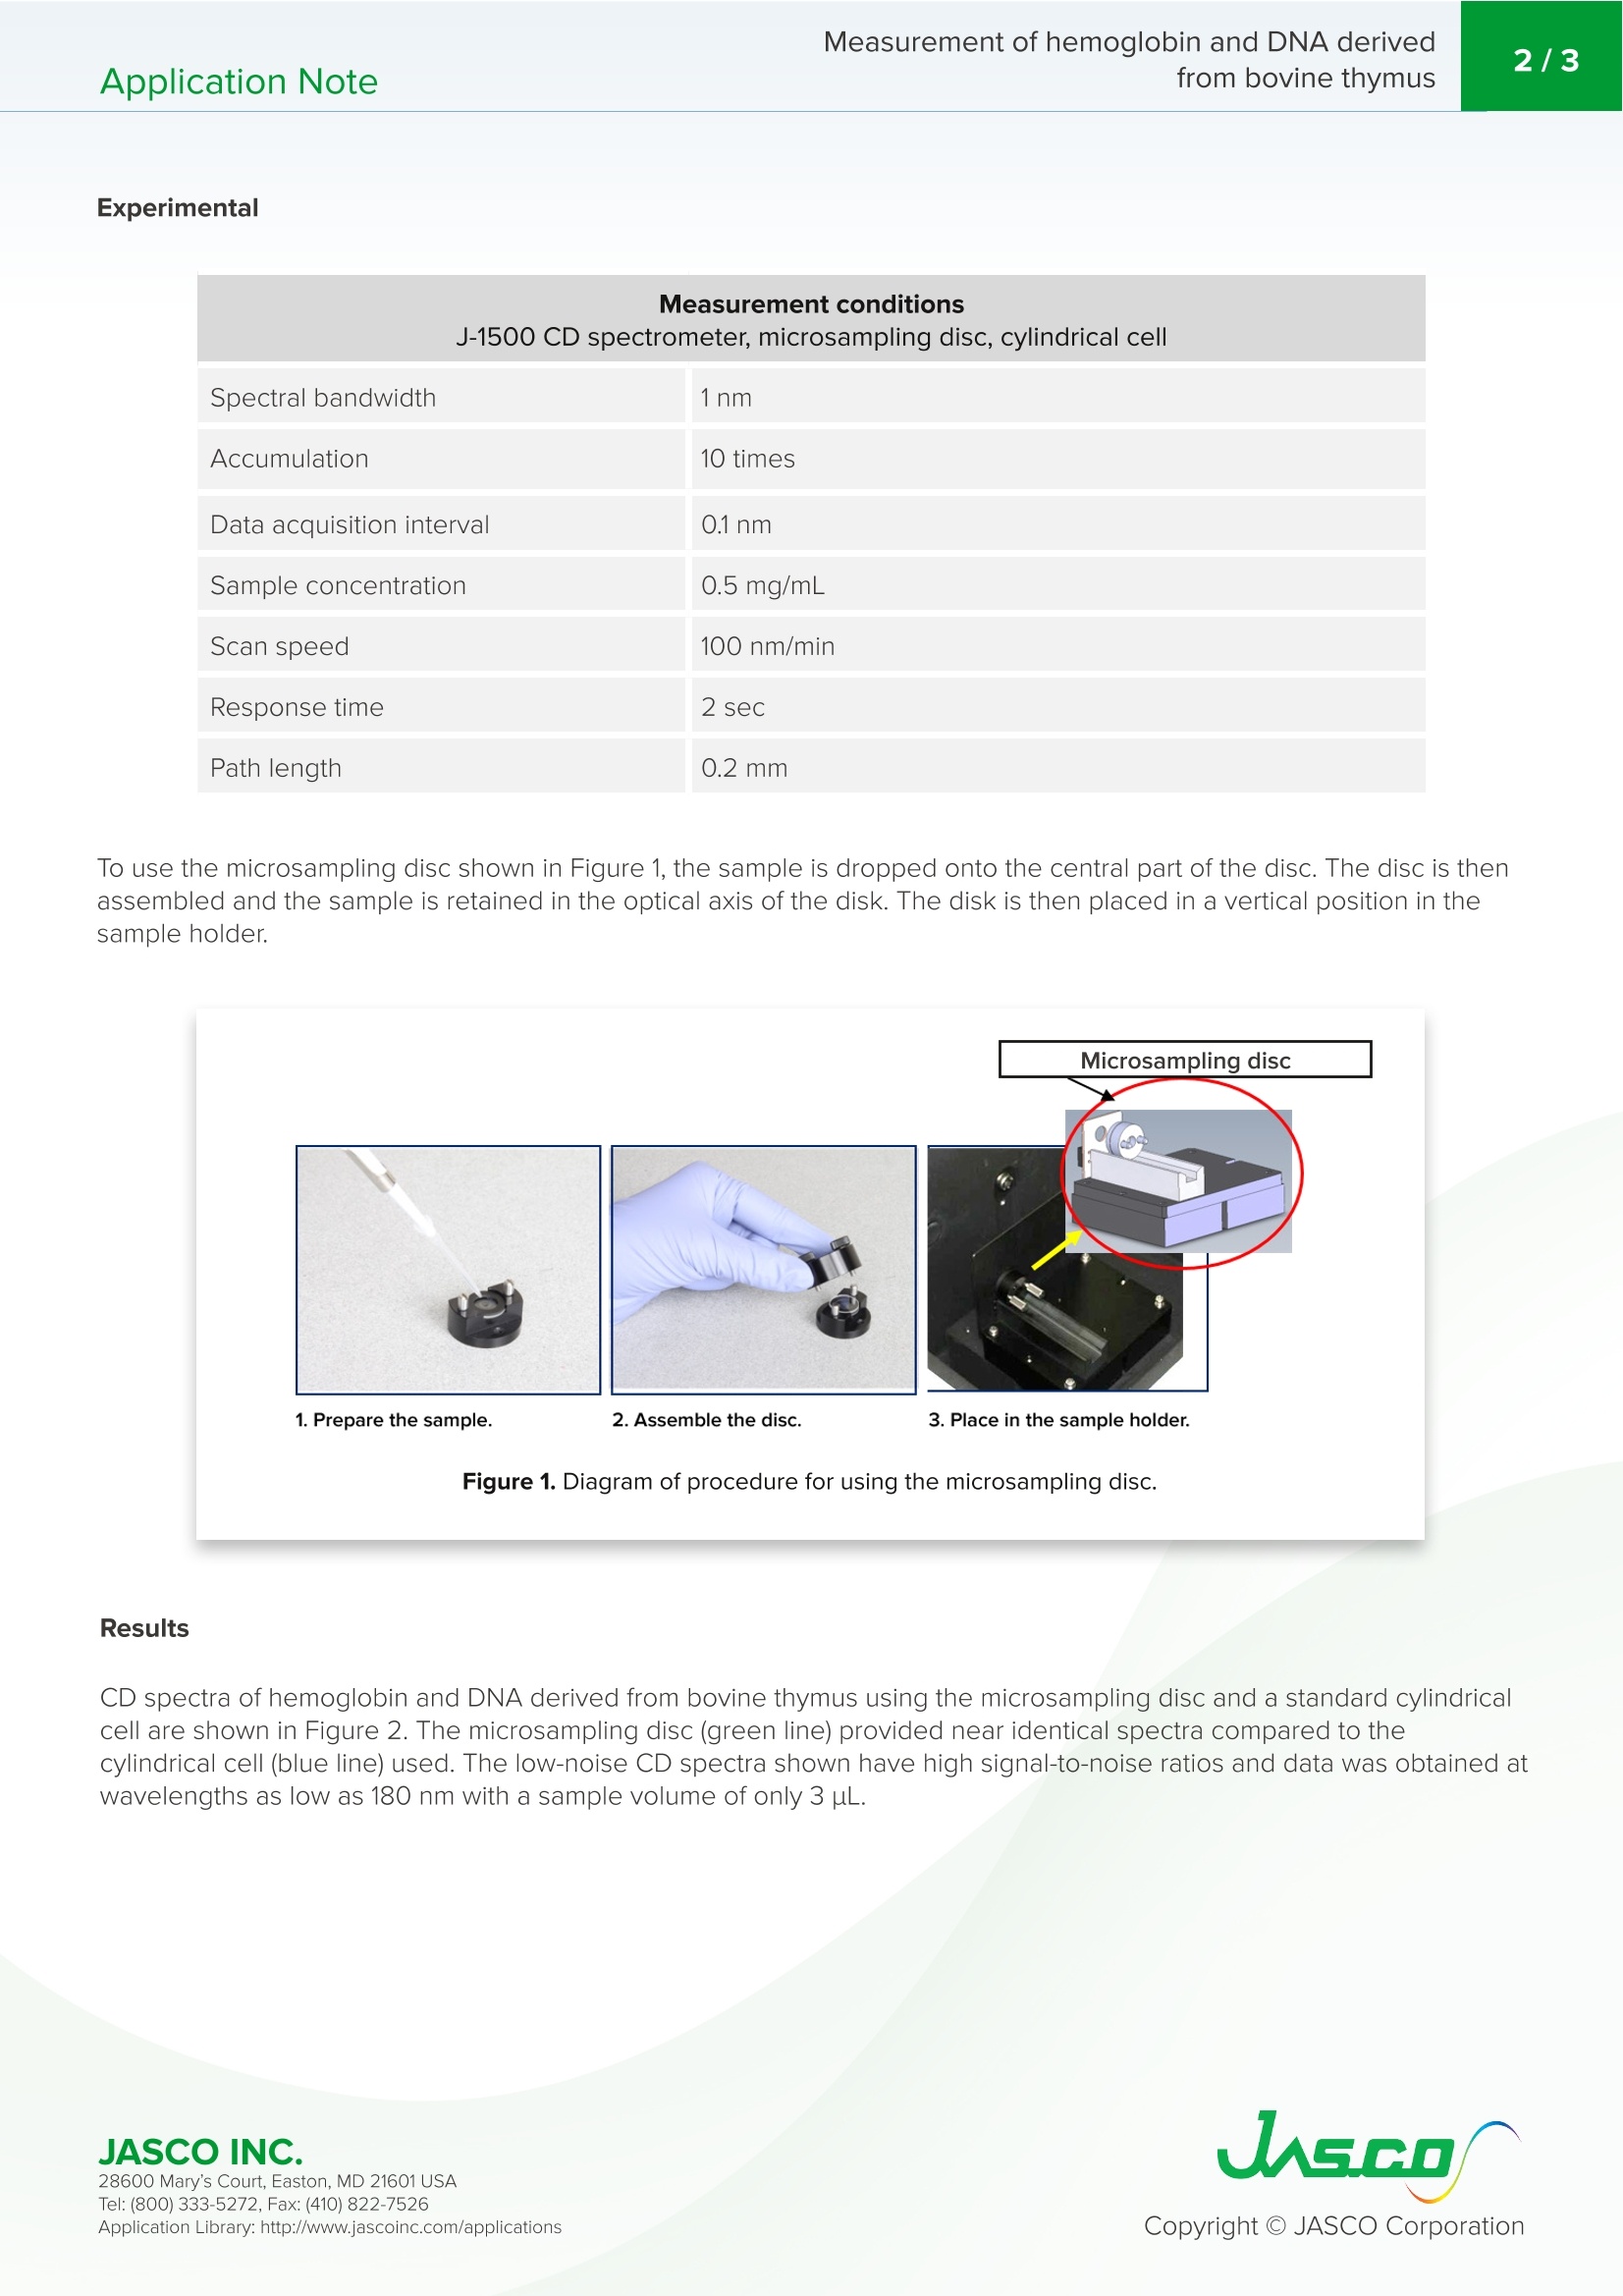
圆二色性是蛋白质和核酸等生物分子结构分析的重要工具。用于CD测量的样品池的典型路径长度为1 mm,这使得可以测量约400µL的样品体积和低至0.1 mg/mL的浓度。然而,在许多情况下,样本量甚至更加有限。J-1500 CD光谱仪灵敏度的提高使CD光谱能够以高精度和高信噪比获得,即使在微尺度尺寸下,也可以使用新开发的具有小表面积的微样品池。该申请说明证明了将微取样盘用于CD测量提供了与使用传统样品池获得的数据非常一致的数据。此外,二次结构估计分析程序计算了微取样盘和圆柱形样品池的类似结果,这些结果与X射线晶体学数据一致。Application NoteCDSSpectroscopy Measurement of hemoglobin and DNA derived2/3Application Notefrom bovine thymus Microscale samples: measurement of hemoglobin and DNA derived from bovine thymus Introduction Circu l ar d i c h rois m is a n essentia l t oo l fo r the s tr uctural anal y s i s o f biol og i ca l m o l ec u l e s s u c h a s pr o t e in s a nd n u clei c a cids. Th e typ i c a l p ath len gth of cel l s u s ed fo r CD m easuremen t s is 1 mm, w h ich makes it possib l e to meas u re sa mpl e vol u m e s a r o u n d 400 pL a n d c o ncent ra ti o n s a s lo w as 0.1 mg/mL. Ho we v er, the r e a r e m a n y i n s t a nces in whi c h the sample size i s eve n more l i m ited. Th e e n hanced se n si t iv i ty of th e J -1500 CD spectrometer en a bl es CD s pectra t o b e o b t ain e d w i th h i gh a c c u ra c y a n d hi g h s ig n a l-t o-n o i s e (S /N ) ratio , e ven a t mi c r o sc a le si z es ,u sing a newly develope d microcel l w i th a smal l surface a r ea . In th i s a pp l i ca ti o n n ote, CD spec tr a of h e m og l o b in a n d D N A d er ived f ro m b ov i ne thym us a r e mea s u re d u sin g a mi c r osampling d isc w i th th e J -1500 C D spectromet e r. T h e m easuremen t s w e r e perfo r med with a 3 uL sa m ple volu m e t o d emonstra t e th e sen s i t i v it y o f the J-1500 w ith s m a ll sampl e vo lume s in a m icroce l l. Keywords M i c r oassay, microsampl i ng d i sc, microcel l, circular d ich r o i sm,h e m ogl obin ,DN A , b o v i ne thym u s, s ec o n d a ry st r u c t u re ,J-1500 JASCO INC. 28600 Mary's Court , Ea s t on, MD 21601 U S A Experimental Measurement conditions J-1500 CD spectrometer, microsampling disc, cylindrical cell Spectral bandwidth 1nm Accumulation 10 times Data acquisition interval 0.1nm Sample concentration 0.5 mg/mL Scan speed 100 nm/min Response time 2 sec Path length 0.2 mm T o u se th e mi c r osampling disc show n i n Figu r e 1, th e sample i s dropped o n to th e ce n tra l par t of th e disc. The d isc i s then asse m b l ed a nd t he sa m pl e i s re t a i n e d i n th e optical a xi s o f the d is k . Th e d i sk i s then pl a c e d i n a v e r t i c a l p os i ti o n in the s ampl e ho l d er . Results C D s p ectra o f hemoglob i n an d DNA d e ri ved f rom b ov in e th ymus u sing th e m i c ro sam p ling d isc a n d a stan da rd c y l in d r ical cell a re s h o w n in F i g u re 2. The micros a mpli ng d i sc (green line) prov i d e d near i den ti cal spectra com p a r ed t o the cy li n dri c al cell (b l ue l i ne) u s ed . Th e l ow-n o i se CD sp ectra sho w n h a v e h igh si gn al-t o-noi se ra ti os a n d data was o bt a in ed a t wavelen g th s as l ow as 180 n m wit h a sa m pl e volu me of on l y 3 u L . JASCO INC. 28600 Mary's Cour t , E asto n , MD 21601US A Figure 2. CD spectra of hemoglobin (A) and DNA derived from bovine t hymus (B) using a microsampling disc (green) and cylindrical cell (blue). Secondary structure analysis Th e J W M V S -529 C D mu lti v a r i at e SS E a n a lysis pr o g r a m w as u s ed t o pe rfo rm a seco n da ry s tructur e a n al y si s o n t he C D s p ectra o f hemo g lob i n measu r ed b y b o t h the microsampl in g disc an d c y l i nd r ica l cel l. Ta bl e 1 s h o w s the calc u la t ed r esu l ts c om p are d with d at a ob t a i n e d b y X -ray c r y st a l s t r u c ture a n a ly sis. T he s e c on dary s tr u ct ur e an a l y s i s results o b t ained fo r the CD s p ec t r a m easu r ed u sin g t h e mi c ro sa m p l in g dis k ar e in g o o d a gr ee ment w i th b o t h t he r esu lt s fr om the CD s p ectra obta i ned u si ng t h e stand a rd cyl i nd r ical ce l l and d at a fr om the X-r ay c r ys t a l structure an a l ys i s . Table 1. Comparison of secondary structure analysis data for hemoglobin. The secondary structure estimation using the JWMVS-529 CD mult i variate SSE analysis program was made with the PCR algorithm. a-Helix (%) B-Sheet (%) Turn (%) Random (%) X-ray* 78.0 0.0 6.3 15.7 Microsampling disc 73.8 0.0 10.9 15.3 Cylindrical cell 72.2 0.0 12.0 The r e s ult s of X-ra y cr y s t al str u c t ur a l a n al y s i s r ef e r t o DS S P da ta i nc l u ded i n th e PDB Conclusion Th i s appli c at i on n ot e d emo n s tr at es th at u se of th e micr o sa m pl i ng d i s c for C D me a su re m en t s prov i d e s da t a i n gooc agreement w ith data obtained u s ing th e co n ve n tiona l cell . Add i tio n al l y, t h e seconda r y structu r e estimation analysis pro g r a m c a lcu l ate d si m i lar res u lt s fo r b oth t h e mi c ros a m pl in g d i s c a n d c ylin dri c al c e l l w h ich we r e c o n s is t e n t w i th X -r a y c r ystall og raphy d ata .
关闭-
1/3
-
2/3
还剩1页未读,是否继续阅读?
继续免费阅读全文产品配置单
佳士科商贸有限公司为您提供《微量样品_牛胸腺中血红蛋白和DNA的测定》,该方案主要用于其他肉制品中微量测量、血红蛋白、DNA、二级结构检测,参考标准《暂无》,《微量样品_牛胸腺中血红蛋白和DNA的测定》用到的仪器有JASCO圆二色光谱仪CD J-1500。
我要纠错

相关方案
 咨询
咨询