方案详情文
智能文字提取功能测试中
TCH-703八位转塔微型样品池配件可对多达八个体积小至4微升的样品进行简单可靠的紫外可见光测量,适用于数量有限的样品。为了获得测量结果,将样品移到可拆卸的样品转台上,然后将其放入样品池支架中。Application Note Measurement Accuracy of the TCH-7032/4Application Note8-position Turret Micro Cell Holder Measurement Accuracy of the TCH-703 8-position Turret Micro Cell Holde r In t ro d uc t ion The TCH-703 e i ght-posi t ion turret micro cell accessory provides easy and r eliable UV Visible meas u rements of up to eight samples wi t h vol u mes as small as 4 m i c r ol i ters,useful for samples of limited quan ti t i es. To obtain measureme n ts, t h e samples are pipetted onto t h e removable sample turre t whic h is then set i nto the cell holder . A knob moves the desi r ed sample in to the pat h o f the incoming light beam, shown below: V-630 UV-Visible Spectro p hotometer This application note demo n strates the measuremen t accuracy a n d r eproduci b ility of the turret m i c r o cell holder by measuring a DNA sample. K ey words V-630,U V -V i s ibl e /NIR, DNA, m i c r o v olume, T CH-703 8-p osition Microce ll Holder , uWas h M W-2000 micro-cell washing a c ces s o ry, Bi oc h e mi s t r y R esul t s To ve r ify the measureme n t accuracy of the turret cells, ana l ysis of the DNA samples of raw bovine thymus was performed in the 8 cel l s at specific concentrat i ons. The DNA concentrations were measured using the Warburg-Chr i stian method.The cross validation errors (C.V.) f or t h ese measu r ements were 2% with a DNA concentration of 50 pig/mL, 11% for 10 pg/mL , and 10% for 5 ug/mL. 28600 Ma r y 's C ou r t, Easton, M D 21601 US A To a n aly z e the reproducibility of the t ur ret rotat i on, the variat i on in t h e quan tit at i ve measur e men t s of the same sam p les in t h e c e l l were measur e d while the t u rr et was rota te d . T he CV for the se measu rem e n ts was 0.3% for 50 pg/mL DNA, 1.7%for 10 p ag/mL , and 3.5% for 5 pg/mL (T ables 1-3). Table 1. C el l m e as u re men t a cc u r a cy an d t u rret ro ta tion r e pro duc i b il i t y u sing 50 pi g /m L o f DNA . 1st 2nd 3rd Average S.D. C.V. Cell 1 42.00 41.90 42.00 41.97 0.058 0.14 Cell 2 39.70 39.80 39.80 39.77 0.058 0.15 Cell 3 41.30 41.50 41.70 41.50 0.200 0.48 Cell 4 41.00 41.00 40.90 40.97 0.058 0.14 Cell 5 40.90 41.00 41.00 40.97 0.058 0.14 Cell 6 41.80 41.80 42.50 42.03 0.404 0.96 Cell 7 41.90 42.00 41.90 41.93 0.058 0.14 Cell 8 41.90 41.90 42.00 41.93 0.058 0.14 Average 41.31 41.36 41.48 41.38 S.D. 0.781 0.746 0.861 0.765 C.V. 1.89 1.80 2.80 1.85 Table 2. C el l mea s u rem en t a cc u r ac y a n d t ur re t ro ta t i o n rep r o d uc i b i l i t y usin g 10 p g/m L o f DNA . 1st 2nd 3rd Average S.D. C.V. Cell 1 8.3 8.3 8.6 8.40 0.173 2.06 Cell 2 8.2 8.2 9.3 8.57 0.635 7.41 Cell 3 11.0 11.1 10.9 11.00 0.100 0.91 Cell 4 8.4 8.3 8.5 8.40 0.100 1.19 Cell 5 9.4 9.5 9.4 9.43 0.058 0.61 Cell 6 8.2 8.3 8.2 8.23 0.058 0.70 Cell 7 10.3 10.3 10.3 10.30 0.000 0.00 Cell 8 9.6 9.5 9.5 9.53 0.058 0.61 Average 9.18 9.19 9.34 9.23 S.D. 1.078 1.097 0.921 0.991 C.V. 11.72 11.94 9.86 10.73 28600 Mary's Cour t , E a s to n , M D 21601US A Table 3. Cel l me as ure m en t accu r a c y an d t ur ret ro t at i o n r ep r oduc i b i l i ty u s i n g 5 u g/m L o f DN A . 1st 2nd 3rd Average S.D. C.V. Cell 1 4.2 4.4 4.5 4.37 0.153 3.50 Cell 2 3.4 3.5 3.5 3.47 0.058 1.67 Cell 3 3.8 3.9 4.6 4.10 0.436 10.63 Cell 4 3.7 3.9 3.8 3.80 0.100 2.63 Cell 5 3.3 3.6 3.6 3.50 0.173 4.95 Cell 6 3.2 3.3 3.3 3.27 0.058 1.77 Cell 7 3.5 3.6 3.6 3.57 0.058 1.62 Cell 8 3.7 3.8 3.8 3.77 0.058 1.53 Average 3.60 3.75 3.84 3.73 S.D. 0.321 0.334 0.469 0.377 C.V. 8.91 8.90 12.22 10.11 The conce n tra t ions results determined by UV-Visible measurements in the 8-posit i on turret cell we r e used to create a calibration curve. Figure 1 s h ows t h e UV-Vis ib le determ i ned concentrations as a function of the sample concent r ation.This calibrat i on curve was used to dete r mine a detection limit of 0.38 pg/mL a n d a determination limit of 6.4 pg/mL . Here we define the detection limit as t h e concent r ation calculated f r om the calibration curve when the maximum quan t itative va l ue of the 95% confidence interval i s at a ca l culated conce n trat i on of 0 ug/mL . The dete r mination limit is d e fined as t h e concentrat i on calculated from the calibrat i on curve using some specif i c quant i tat i ve r esults that h as a coe ff icien t of va r i at i on of 10%. Figure 1. Ca l i b r atio n cu r ve of the U V -Vis i b l e q u a n tita ti v e r e sults as a fu n c t ion of DNA co n c en tr a tion . 28600 Mary's Cour t , E a s to n , M D 21601US A Appl i cat i on Note The equation for t h e fitting l ine is: y=0.824697±0.010735 xE+0.236037±0.311315 The cor r e l at i on coef f icie n t is 0.998451 and the sta n dard error is 1.12974. Loading a n d cleaning t h e 8-positio n tur r et cell holder is just as easy as acquiring t h e measurements . A round-shaped gel loading tip i s most appropriate for load i n g samples i nto t he tu r ret cells s in ce this p ipette tip p reve n ts air bubbles in the c e lls. To remove protein and biological samples from t h e cells, commerc i a l detergents for instrument cuvettes can be us e d. If the t urre t cel l s a r e h eavi l y contaminat e d, a concentrat e d nit r ic acid solu ti o n can also be us e d. JASCO offers a washing d e vice, the u Wash, which is designed to clea n the cel l easily using water, m ethanol, ethanol, an d other solvents. The needle t ip of the uWash is i nserted i nto the cell an d t he syringe bu t ton is pressed several times to clean the turret cells by fi l ling and draining them with small quan ti ties of a wash i ng solut i on. JASCO INC. 28600 Mary's Cour t , E a s to n , M D 21601US A
关闭-
1/4

-
2/4

还剩2页未读,是否继续阅读?
继续免费阅读全文产品配置单
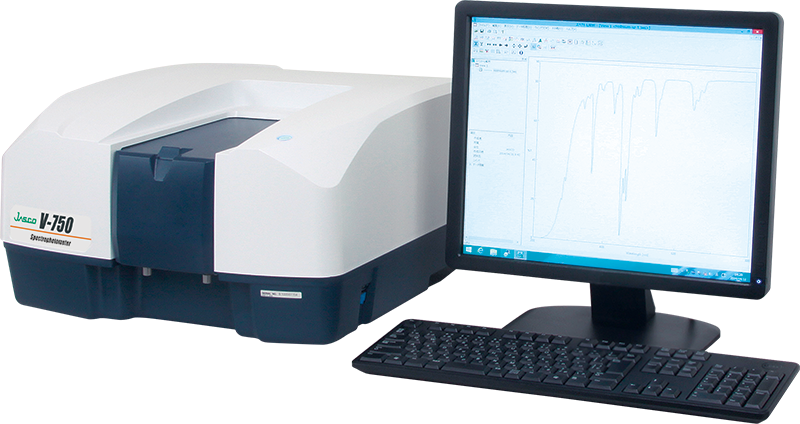
佳士科商贸有限公司为您提供《TCH-703 8位转台微样品池支架的测量精度》,该方案主要用于天然高分子材料中准确性、再现性、微量检测,参考标准《暂无》,《TCH-703 8位转台微样品池支架的测量精度》用到的仪器有jasco紫外可见分光光度计 V-700。
我要纠错
推荐专场
紫外、紫外分光光度计、紫外可见分光光度计、UV
更多相关方案


 咨询
咨询