农业区表层土壤样品(0-30cm)样品的24小时振荡
检测样品 土壤
检测项目 (类)金属及其化合物
参考标准 HJ 803-2016 土壤和沉积物 12种金属元素的测定 王水提取-电感耦合等离子体质谱法


方案详情文
智能文字提取功能测试中
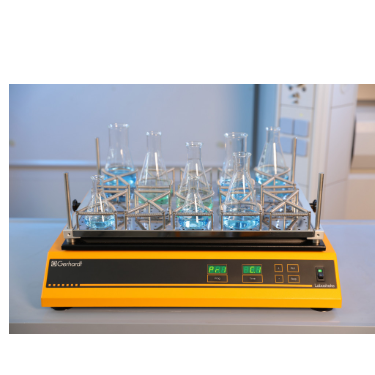
污水污泥洗涤剂去除铜、铅、锌的动力学研究Kinetics of Cu, Pb and Zn removal during soil flushing with washing agents derived from sewage sludge使用格哈特Laboshake振荡器振荡土壤24小时The soil was mixed for 24 h on a horizontal mechanical shaker (Laboshake Gerhardt).www.nature.com/scientificreportsscientific reports污水污泥洗涤剂去除铜、铅、锌的动力学研究 www.nature.com/scientificreports/ Che c k for updates OPEN Kinetics of Cu, Pb and Zn removal during soil fulshing with washing agents derived from sewage sludge Barbara Klik, Zygmunt M. Gusiatin * & Dorota Kulikowska This paper presents the frist tests of Cu (7875 mg/kg), Pb (1414 mg/kg) and Zn (566 mg/kg) removal from contaminated soil with sewage-sludge–derived washing agents (SS_WAs) (dissolved organic matter, DOM; soluble humic-like substances, HLS; soluble humic substances, SHS) and Na2EDTA (as a standard benchmark) in column experiments. Flow rates of 0.5 ml/min and 1 ml/min were used. Using a 1. order kinetic model, the kinetic constant (k ), the maximum concentrations of each metal removed (C max), and the initial rates of metal removal (r ) were established. At both flow rates, stable flow velocity was maintained for approximately eight pore volumes, for flushing times of 8 h (1.0 ml/min) and 16 h (0.5 ml/min). Although the flow rate did not influence k, it influenced C max: at 1 ml/min, C maxvalues were higher than at 0.5 ml/min. For Cu and Zn, but not Pb, k was about twofold higher with Na2EDTA than with SS_WAs. Although Na2EDTA gave the highest k Cu, C max,Cuwas highest with DOM (Na2EDTA, 66%; DOM 73%). For Pb removal, HLS was the most efefctive SS_WA (77%; Na2EDTA was 80% efefctive). k Znwas about twofold higher with Na2EDTA than with SS_WAs. C max,Znwas highest with HLS. The quick mobilization of Cu, Pb and Zn with most of the WAs corresponded to efcfieint metal removal from the exchangeable (F1) fraction. Due to their persistence, bioaccumulation and toxicity, heavy metals (HMs) should be eliminated from soil, or their negative impact on the environment should be diminished. HMs are as commonly found in the environ-ment as other contaminants like mineral oils or aromatic hydrocarbons. In many areas associated mainly with present and former industrial activities, the concentrations of HMs are several or even several dozen times over the permissible values 1–7. Among the many remediation methods, soil washing and soil flushing enable the permanent removal of HMs from soil and therefore are preferable to immobilization of contaminants. Up to now, most studies have reported results from batch soil-washing experiments, which have aimed to optimize this process with the use of various soils and HM contamination levels, and various washing agents under difefrent soil-washing opera-tional conditions 7–12. In contrast to batch soil-washing, soil-flushing methods for HM removal are still under development 13, although this is generally considered a mature technology because it has been used for decades in oil feild applications to enhance oil recovery 14. In soil fulshing, contaminants are removed from soil by passing the washing agent through the soil. Tehn, the spent washing agent is recovered, reused, and eventually treated and disposed of. Tish technology is applicable to homogenous, coarse-textured soils with high permeability, and its main advantages are the elimination of the need to excavate, handle, and transport large quantities of contaminated soil, and its relatively small surface footprint, which allows it to be used in space-limited areas 15. So far, the same types of solutions have been tested for soil flushing as for batch soil-washing: acidic, basic, chelating, reducing and surface-active. Among these, Na2EDTA, mineral acids and organic acids have been most intensely studied and have proven to be the most efefctive 16–21. However, the literature clearly indicates that, in soil-flushing research, authors have focused mainly on process efefctiveness. For example, Yang et al.19 used bench-scale column washing to examine the efcfieincy of removal of DTPA-extractable HMs (Cd, 12.82amg/kg; Pb, 105.38 mg/kg) using difefrent doses of HCl and Na2EDTA in a contaminated calcareous soil. In sequential use of the optimal doses of HCl and Na2EDTA, DTPA-extractable Cd and Pb were removed with efcfieincies of 87.3% and 73.2%, respectively. Compared to the use of a single washing agent, the efcfieincies of removal of DTPA-extractable Cd and Pb were increased by more than 8.3% and 27.92%, respectively, by sequential washing with HCl followed by Na2EDTA. 奥尔什丁瓦尔米亚玛祖里大学 地球工程学院环境生物技术系 Parameter Type of WA DOM HLS SHS Solution used for extraction Distilled water 0.1MM NaOH 0.1 M NaOH* m/V ratio** (g/ml) 1/10 1/10 1/8 Extraction time (h) 1 6 6 Shaking speed (rpm) 150 150 150 Centrifuging (speed/time) 10,000 rpm/10 min Filtration vacuum flitration, 0.45 um fliter Table 1. Conditions for extraction of SS_WAs. *Before the proper extraction of SHS, dissolved substances, waxes, bitumens were removed; **m/V is the ratio between sludge mass (g) and volume of extractant (ml). with next-generation WAs, especially those recovered from wastes, has rarely been reported. Moreover, there is gap in the knowledge about the relationship between next generation WAs flow rate and the efcfieincy of HM removal during soil flushing, although it is known that flow intensity afefcts the efcfieincy of organic pollutant removal 22. Teh efefctiveness of soil flushing can be associated with the kinetics of desorption or dissolution of HMs from soil constituents 23. Tuhs, it is crucial to better understand the performance of flushing agents in removal of HMs from soil, especially with regard to next-generation agents, i.e. those extracted from wastes. In view of the above considerations, this study compared for the frist time the efcfieincy of next-generation, sewage-sludge–derived WAs (SS_WAs) (dissolved organic matter, DOM; soluble humic-like substances, HLS; soluble humic substances, SHS) and Na2EDTA (as a standard benchmark) for Cu, Pb and Zn removal in a column experiment that simulated soil flushing. Teh primary objectives were as follows: (1) to estimate the efcfieincy of HM removal with the tested WAs, (2) to examine the impact of WA flow rate on total HM removal and chemical fractions of HMs, and (3) to estimate the kinetic constants of the process. Materials and methods Soil. Surfacesoilsamples(0–30 cm)werecollectedfromagricultureareainTroszkowo(54°3′18″N,20°53′28″ E, Warmia and Mazury Province, Poland). In total, 10dkg of soil (through mixing of 5 sub-samples) was collected from area of 5 m2. In laboratory, the soil was air-dried for two weeks and ground to pass through a 2omm sieve. Te hhomogenous soil was then spiked with a mixture of Cu, Pb and Zn. For spiking, nitrate salts of HMs i.e. Cu(NO3)2, Pb(NO3)2 and Zn(NO3)2 (Sigma-Aldrich) were used. Te hsalts were dissolved in dis-tilled water to achieve concentrations, 8000Nmg/L of Cu, 1500rmg/L of Pb and 500hmg/L of Zn. Te hsolutions were added directly to 1ckg of soil. Teh soil was mixed for 240h on a horizontal mechanical shaker (Laboshake Gerhardt). Next, the soil was incubated at room temperature (23 ± 2 °C) for three months with gentle, frequent mixing. Te hsoil characterized with the following characteristics: 56 ± 1.6% sand, 39 ± 0.16% silt, 5 ± 0.21% clay, pH 6.4 ± 0.1, 3.4 ± 0.1% organic matter, 17.2 ± 1.6 cmol/kg cation exchange capacity, 7874.5 ± 23.1 mg/kg total Cu, 1414.3 ± 11.6omg/kg total Pb, 566.1 ± 4.2cmg/kg total Zn. Te hconcentrations of HMs in the spiked soil cor-responded to the concentrations in soils in close proximity to Legnica smelter (Poland)7. Detailed soil charac-teristics are given in Klik et al.24. Washing agents. Trhee washing agents (WAs) derived from municipal sewage sludge (SS_WAs) were used for HM removal in column soil flushing: (a) Dissolved organic matter (DOM) washed from sewage sludge with distilled water, (b) Humic like substances (HLS) extracted from sewage sludge with 0.1 M NaOH, (c) Soluble humic substances (SHS) extracted from sewage sludge with 0.1 M NaOH afetr sludge washing with distilled water to eliminate soluble non-humic substances (e.g. sugars and proteins) and sludge defatted with a chloroform:methanol mixture 25. Teh conditions for extraction of SS_WAs from municipal sewage sludge are summarized in Table 1. As a benchmark for comparison, commercially available Na2EDTA (Sigma-Aldrich) was used. Selected characteristics of SS_WAs and Na2EDTA were given in Table 224. Based on previous research, for column fulshing experiments, the SS_WAs were used at concentration of 5eg C/L and at pH 4.0, and Na2EDTA at concentration of 0.64mg C/L and at pH 4.024,26. Soil flushing. Te hexperiments were performed in a column reactor equipped with additional devices pre-sented in Fig.g 1. Teh column reactor was made of plexi with a 30-mm internal diameter and a 300 mm length. Teh column had two sieves (a supporting sieve at the top of column and a closing sieve at the bottom with a nylon mesh) enabling proper maintenance of soil and gravel layers and to ensure the leachate were free of turbidity during flushing. Te hcolumn was packed with two layers of rinsed gravel (φ 2–4 mm and 1–2 mm) (total mass of 200 g) and a layer of contaminated soil (total mass of 50ng). Te hmass of soil in the reactor was chosen experimentally to obtain a suitable flow rate with tested WAs through the reactor. Teh bulk density of the soil was 1.23 g/ml with a porosity on the level of 54%. Te hpore volume of the packed column reactor was 56.8/ml. Vol:.(1234567890) Characteristic DOM HLS SHS Na2EDTA pH 6.9 (± 0.08) 11.7 (± 0.13) 12.3 (± 0.11) 4.6 (± 0.09) Concentration (g/L) 6.8* (± 0.24) 9.7* (± 0.42) 5.0* (± 0.19) 0.64 (± 0.19) NH4+(mg/L) 331.2 (± 19.8) 143. 0 (± 11.1) 134.4 (± 18.1) 1.6 (± 0.9) PO43−(mg/L) 2850.4 (± 162) 2496.8 (± 141) 1015.2 (± 73) 1.4 (± 0.6) Mg2+ (mg/L) 15.0 (± 2.4) 1.7 (± 0.26) 1.4 (± 0.11) 0.014 (± 0.006) Ca2+ (mg/L) 0.8 (± 0.09) 11.5 (± 2.2) 17.8 (± 3.9) 0.11 (± 0.03) Cu2+ (mg/L) 1.1 (± 0.05) 2.3 (± 0.12) 4.7 (± 0.19) 0.7 (± 0.19) Zn2+ (mg/L) 0.7 (± 0.08) 1.3 (± 0.12) 3.6 (± 0.32) 1.6 (± 0.32) Pb2+ (mg/L) 0.0 0.0 0.0 0.0 Cd2+ (mg/L) 0.0 0.0 0.0 0.0 Table 2. Selected properties of WAs used for soil flushing (mean value, n = 3, ± standard deviation). *original DOM, HLS and SHS concentration (expressed as g of dissolved organic carbon per L) extracted from sewage sludge under conditions given in Table 1. Figure 1. Set-up for metal removal in soil flushing: container with flushing agent (1), peristaltic pump (2), column reactor (3): supporting sieve (a ), closing sieve (b ), soil (c ), n 2–4imm gravel layer (d ), i 1–2tmm gravel layer (e ), automatic sampling device (4), control cabinet (5). Teh individual WAs were pumped into column reactor with a peristaltic pump (LeadFluid BT600S) at two flow rates, i.e. 0.5 ml/min and 1.0 ml/min. Teh total time of soil fulshing with individual WAs was 24 h. Te hflush-ing solution was pumped into the column from the top layer, while the leachate was recovered from the bottom. Tish flushing method, in contrast to soil flushing from the bottom to the top, simulates better field application where the soil is subjected to a constant water head or other solution application from the top 27. Before soil flushing with individual WAs, distilled water was pumped into the reactor for 1oh to saturate the soil. Afetr this pre-conditioning, WAs were continuously applied. Teh frist volume of water leachate was withdrawn. Teh leachate from the column were collected from the bottom of the reactor by the automatic sampling device(in form of rotor with 36 leachate containers). Teh advantage of using this automatic devise was the possibility of leachate collection at every hour. All column experiments were conducted at room temperature, under labora-tory conditions. Teh average total leachate volume for each WA was 654 ml (0.5 ml/min) and 1210 ml (1.0 ml/min). Teh research scheme on soil flushing with tested WAs is shown in Fig. 2. Teh soil flushing with each WA was evaluated in duplicate columns. Sewage sludge Metal fractionation in soil after flushing Figure 2. Research scheme on soil flushing with WAs. Analyses of column leachate and flushed soil. Te hleachate from column reactor were collected regu-larly for 24oh at 1-h interval. In the raw leachate samples pH was measured using a pH-meter (HI 221). Tehn samples were flitered using 0.45 µm nitrocellulose membrane fliters and stored at 4g°C prior to chemical analyses. Concentration of dissolved HMs (Cu, Pb, Zn) were measured in samples acidifeid with 65% HNO3 using falme atomic absorption spectrometer, FAAS (AA280FS, Varian). Detection limits for Cu, Pb and Zn were 0.004fmg/L for Cu, 0.003 mg/L for Zn and 0.018mg/L for Pb. Te hleachate samples afetr 0, 1, 2, 5, 10 and 24Zh were also subjected to analysis of total dissolved organic carbon (TOC) with Shimadzu Liquid TOC-VCSN analyzer (cal-culated by subtracting the inorganic carbon from the total carbon). Teh soil afetr flushing was air dried, crushed and sieved through a 1imm sieve for the determination of chemi-cal fractions of HMs. Fractions of Cu, Pb and Zn were determined using a modifeid BCR (Community Bureau of Reference) sequential extraction procedure. Four operationally defined fractions were determined: exchangeable and acid soluble (F1), reducible (F2), oxidizable (F3) and residual (F4). Te hdetails on the BCR procedure were given in Pueyo et al.28. For HM measurement quality assurance, the certifeid reference material (BCR-142R) was used. For calibration curves, HM standards for AAS (Fluka Analytical) of concentration of 1000(mg/L each one were used. Repeatability of FAAS analyses was confrimed by triplicate reading of HMiconcentrations in samples with relative standard deviation (RSD) < 2%. Results elaboration. Teh removed HM concentrations were plotted against the soil flushing time to con-struct the mobilization curves of HMs. Cumulative HM removal from the soil column with individual WAs was calculated as the sum of HM removed at each hour of soil flushing. Based on TOC concentration in original WAs and leachate from column, the sorption of WAs was evaluated. Total HM removal during soil flushing was conjuncted with analysis of the efcfieincy of HM removal from their individual fractions (F1–F4). Based on cumulative HM removal, kinetic constants were calculated, according the 1. order kinetic formula: where: C max is the maximum concentration of the individual HMs (Cu, Pb, Zn) removed from washed soil (mg/kg); k is the kinetic constant of the individual HM removal (h−1); t is the soil fulshing time (h). On the basis of C max and k , initial rate of individual HM removal r (mg/kg h) was calculated. To ensure the accuracy, reliability, and reproducibility the soil flushing experiments were performed in dupli-cate. Teh data in fgiures are the average of duplicates, and the error bars indicate the standard deviation of the repetitions. Vol:.(1234567890) Figure 3. Flow velocity and pore volume during soil flushing with DOM, HLS, SHS and Na2EDTA. Results and discussion Hydraulic conditions and sorption of WAs during soil flushing. Teh hydraulic conditions in the soil flushing reactor are presented in Fig. 3. Tehse conditions depended on both the type of WA and the flow rate. As expected, the observed flow velocity was twofold higher at 1.0nml/min than at 0.5 ml/min. As a result, the soil in the column reactor was flushed with more pore volumes during a shorter fulshing time at the higher flow rate than at the lower rate. With all WAs at both flow rates, stable flow velocity was maintained for approximately eight pore volumes, which corresponded to flushing times of 8lh at 1.0 ml/min and 16oh at 0.5iml/min. With longer flushing times and larger pore volumes, hydraulic conditions became unstable. Tish destabilization was more noticeable at the higher flow rate, particularly with SS_WAs (Fig.33). Changes in hydraulic conditions are typical during soil flush-ing. At higher chelating-agent concentrations, the decrease in flow velocity was greater with EDDS than with EDTA 16. In the present study, the concentration of SS_WAs was higher than that of EDTA. Higher washing-agent concentrations can result in plugging due to dispersion of fine soil fractions 29,30. During soil flushing, the pH in the column leachate continuously decreased. At the beginning it ranged from4.9 to 5.1 at 0.5uml/min and from 4.6 to 4.9 at 1.0 ml/min (full data not shown). At the end of soil flushing, the pH had decreased to 4.1 to 4.3 at both flow rates. Yun etial.30 demonstrated that a decrease in the pH of leachate to a value ranging from 3 to 5 during soil flushing with citric acid could increase the electrostatic forces between soil particles and cause swelling of fine particles, resulting in decreased soil permeability to the flushing agent. Teh analysis of TOC in the leachates from the column reactor revealed changes in the concentration of WAs available for HM removal (Fig.f 4). In general, the changes in the concentrations of the SS_WAs tended to be similar to each other, but difefrent from the changes in Na2EDTA concentration. At the beginning of soil flush-ing, the concentration of all SS_WAs was 5050amg C/L (on average), whereas that of Na2EDTA was 638lmg C/L. Teh largest decrease in SS_WA concentrations took place between the frist and fifth hours of fulshing. Although sorption of SS_WAs was rapid, the drop in their concentration was not large: at a flow rate of 0.5iml/min, 13%,14% and 17% of DOM, HLS and SHS sorbed to soil, respectively; at 1.0gml/min, 11%, 13% and 15% sorbed to soil. Although WA concentration can have an important influence on HM removal efcfieincy 29, in the present study, the drop in SS_WA concentration was not large enough to disturb efcfieint HM removal, as shown by the fact that HM concentration removed from soil peaked afetr two hours of soil flushing (Figs.m 4, 5, 6). Overall, the concentration of SS_WAs remained high enough to ensure HM removal. Moreover, as soil fulshing continued, the concentration of SS_WAs rapidly increased, and at the end of the process, it was similar to the concentration at the beginning. Vol.:(0123456789) (a)5300 (b) ■Oh 5000 ■1h 4700 二 ■2h Eo 4400 ■5h 4100 ■10h ¥24h 3800) 3500 0.5 ml/min. 1ml/min. (c)5300 (d) ■Oh 5000- ■1h 4700 一 ■2h Euo 4400 ■5h ■10h 4100- ¥24h 3800 3500 0.5 ml/min. 1ml/min. (e)5300 ■Oh 5000 ■1h 4700 ¥2h 4400 ■5h ■10h 4100 ■24h 3800 3500 0.5 ml/min. 1ml/min. (g) 24 800- ■Oh -2 0 1 2 5 10 24 750 ■1h -4 700 -6 ■2h E -8 650 ■5h -10 ¥10h 一 c o 600 o -12 ■24h -14 550 -16 ----0.5 ml/min. 500 -18 .....1ml/min. 0.5 ml/min. 1ml/min. soil flushing time (h) Figure 4. Changes in the concentration of WAs (as TOC) in leachate collected, and the sorption of WAs at specific f l ushing t ime (0-24h) at two flow rates: (a,b) DOM, (c,d) HLS, (e,f) SHS, (g,h) Na,EDTA. Data are expressed as mean values (n=2)±standard deviation error bars. (a) (c)1400 soil flushing time [h] (d)1400 soil flushing time [h] Kinetic data WAs k Cu (h-1) Cmax,Cu (mg/kg) r Cu (mg/kg.h) 0.5 ml/min 1 ml/min 0.5 ml/min 1 ml/min 0.5 ml/min 1 ml/min DOM 0.20 0.23 5180 5780 1139.6 1271.6 HLS 0.20 0.23 5182 5582 1036.4 1283.9 SHS 0.23 0.25 4440 4970 1021.2 1192.8 Na2EDTA 0.36 0.37 4348 5240 1521.8 1886.4 Figure 5. Cu mobilization curves and its cumulative removal during soil fulshing at two flow rates with DOM(a ), HLS (b ), SHS (c ), Na2EDTA (d ) with kinetic constants. Data are expressed as mean values (n = 2) ± standard deviation error bars. Vol.:(0123456789) 1200 (b) 250 200) 150 -0-0.5ml/min 100 —0一1.0ml/min 50 0 0 4 8 12 16 20 24 soil f l ushing t ime [h] (C) 25500- 200 150 -e一0.5 ml/min 100 -0—1.0ml/min 50 0 4 8 12 16 20 24 soil f lushing t i me [h] (d) 250 Kinetic data WAs kpb(h) Cmax,Pb(mg/kg) rpb (mg/kgh) 0.5 ml/min 1 ml/min 0.5 ml/min 1 ml/min 0.5 ml/min 1 ml/min DOM 0.25 0.24 47 51 11.8 12.2 HLS 0.28 0.28 958 1095 268.2 306.6 SHS 0.27 0.28 830 940 224.1 263.2 Na2EDTA 0.24 0.26 948 1135 272.4 295.1 Figure 6. Pb mobilization curves and its cumulative removal during soil flushing at two flow rates with DOM (a), HLS (b), SHS (c), Na,EDTA (d) with kinetic constants. Data are expressed as mean values (n=2)±standard deviation error bars. In contrast to what was observed with the SS_WAs, the TOC concentrations in the leachates from soil flush-ing with Na2EDTA were higher than the initial Na2EDTA concentration. Tish indicates that Na2EDTA dissolved native soil organic matter during soil flushing. TOC concentrations in Na2EDTA leachates were highest afetr the fifth hour of flushing. Tsang etial.31 have observed that little EDTA is adsorbed on soils and that it is transported as a non-sorbing solute during soil flushing. According to those authors, the leachate concentration of EDTA was equal to the infulent concentration afetr 2–3 pore volumes of flushing. At a high concentration, EDTA can dissolve not only soil oxides and carbonates, but also organic matter. Tohse authors demonstrated that EDTA mobilized soil organic matter, which strongly interacts with Fe and Al oxides, and that this can facilitate HM removal from soil. In their study, as the EDTA concentration increased from 0.0001 M to 0.01 M, the concen-tration of dissolved organic carbon in the leachate from soil flushing increased from 12 to 1200Mmg/L. In the present study, with Na2EDTA concentration of 0.005aM, the maximum concentration of dissolved organic matter(calculated as the difefrence between the TOC concentration in the leachate afetr the fifth hour of flushing and TOC in the Na2EDTA solution supplied to the reactor) was 91 mg/L at 0.5eml/min and 98fmg/L at 1.0fml/min. Kinetics of HM removal. It was found that, independently of the WA that was used, a large amount of Cu was already removed afetr the frist hour of fulshing: ranging from 997Wmg/kg (with DOM) to 1118amg/kg (with HLS). With DOM and Na2EDTA, but not the other WAs, the concentration of HM removed per hour was high-est in the second hour of flushing (1174 mg/kg and 1097 mg/kg, respectively). Te hefcfieincy of Cu removal with DOM, HLS, and SHS gradually decreased from the 2nd-3rd hour of flushing, and from the 8th hour of flushing, the amount of Cu removed per hour by these WAs was 130–150 mg/kg (Fig.55). Te hcurves of Cu mobilization with the difefrent WAs were very similar. It should be emphasized that, in all cases, HM removal was more efefc-tive at the higher flow rate (1yml/min). Teh largest difefrences between the amount of Cu fulshed from the soil at each flow rate were about 150–200 mg/kg, and these difefrences were observed mainly during the frist 2–3oh. Teh results of cumulative amounts of Cu washed from soil (Fig.e 5) clearly indicate that more flushing time is required for Cu removal with SS_WAs than with Na2EDTA. For example, with DOM (Fig.m 5a, flow rate 1iml/min), the concentration of Cu removed from soil afetr 8th of fulshing was 81% of the maximal concentration removed(obtained afetr 19oh of flushing). In contrast, with Na2EDTA (Fig.a 5d, flow rate 1iml/min), the concentration of the HM that was removed from soil afetr 8th of flushing was 96% of the maximal concentration removed. Based on the curves of cumulative Cu removal, kinetic constants were calculated (Fig. 5). Teh values of the kinetic constants for Cu removal (k Cu) with Na2EDTA difefred considerably from the k Cu values with the SS_WAs: with Na2EDTA, the respective k Cu values were 0.36 and 0.37 h−1 at flow rates of 0.5 ml/min and 1 ml/min, 1.5–1.7-fold higher than these values with the SS_WAs (0.20–0.25 h−1). It should be strongly emphasized that, with all tested WAs, k Cu values at the two flow rates did not difefr considerably. However, it is also important that the flow rate influenced the maximum concentration of Cu removed from the soil (C max,Cu). With all of the next-generation WAs, C max,Cu was 10–11% higher at a flow rate of 1 ml/min than at a rate of 0.5uml/min, and with Na2EDTA, it was 20% higher at 1 ml/min. Teh initial rate of Cu removal (r Cu) was highest when using Na2EDTA (1521.8 mg/kg·h at 0.5 ml/min,1886.4 mg/kg·h at 1.0 ml/min), about 1.3–1.5-fold and 1.5–1.6-fold higher than when using the SS_WAs at flow rates of 0.5 ml/min and 1.0 ml/min, respectively. However, even though k Cu and r Cu were highest when using Na2EDTA, C max,Cu was highest when using DOM. Tehrefore, although it requires more flushing time, DOM can remove more Cu from soil than Na2EDTA (at a flow rate 1oml/min, DOM removed 73% of Cu; Na2EDTA removed 66% of Cu). Klik et al.24 found that DOM also removes Cu very efefctively under batch conditions, using the same soil with the same Cu concentration as in this study. It was found that double soil washing with DOM removed 92% of Cu, whereas double washing with Na2EDTA removed 93%. Tuhs, DOM is very efefctive for removal of Cu from soil: under batch conditions, it removes as much Cu as Na2EDTA, and under column flushing conditions, it removes more Cu. However, DOM is not an appropriate WA for removing Pb from soil. At both flow rates tested in the present study, DOM removed only ca. 50mmg/kg of Pb, corresponding to an efcfieincy of ca. 4%. Batch experiments with soil from a metallurgical area and spiked soil have also reported that DOM removes Pb with low efefctiveness. For example, Kulikowska et al.7 reported that DOM removed Pb from soil from a metallurgical area with efcfieincy below 10%. Using the same soil as that used in the present study (with the same Pb concentration), Klik et al.24found that Pb removal efcfieincy was 24%. Tehrefore, DOM should not be used to remove Pb from soils under batch conditions or via column fulshing. With the exception of DOM, the amount of Pb removed by other SS_WAs was highest in the frist hour of removal, with 215emg/kg removed by HLS and 192 mg/kg removed by SHS at flow rates of 1tml/min. A peak in a mobilization curve for Pb removal with DOM was not noted (due to the very low efcfieincy of Pb removal). Pb removal with Na2EDTA was highest in the second hour of flushing (226emg/kg; 1fml/min). However, with Na2EDTA the difefrence in Pb removal between flow rates: at 0.5 ml/min Pb removal in the second hour was187 mg/kg (1.2-fold lower than at 1 ml/min). In contrast to the values of kCu, the difefrence in the values of k Pb for the SS_WAs and Na2EDTA were compa-rable (Fig.66). Moreover, with all of the WAs, k Pb values did not difefr considerably between flow rates. Although flow rate did not influence k Pb values, it influenced the maximum concentration of Pb removed from soil (C max,Pb). With HLS, SHS and Na2EDTA, the respective values of C max,Pb were by 14%, 13% and 20% higher at 1oml/min than at 0.5 ml/min. Additionally, it should be emphasized that HLS, one of the next-generation WAs, removed Pb very efefctively (1095 mg/kg; 77%); its efefctiveness was only slightly lower than that of Na2EDTA (1135 mg/kg; efcfieincy 80%). Teh high C max,Pb with HLS corresponded to the highest initial rate of Pb removal, r Pb (306.6 mg/kg·h at 1.0 ml/min). Kinetic data WAs k Zn (h-1) Cmax,Zn (mg/kg) r Zn (mg/kg.h) 0.5 ml/min 1 ml/min 0.5 ml/min 1 ml/min 0.5 ml/min 1 ml/min DOM 0.10 0.09 188 308 18.8 27.7 HLS 0.09 0.11 450 470 40.5 51.7 SHS 0.08 0.11 401 420 34.1 46.2 Na2EDTA 0.22 0.22 340 410 74.8 90.2 Figure 7. Zn mobilization curves and its cumulative removal during soil flushing at two flow rates with DOM(a ), HLS (b ), SHS (c ), Na2EDTA (d ) with kinetic constants. Data are expressed as mean values (n = 2) ± standard deviation error bars. Vol:.(1234567890) In contaminated soil, Zn was present in the lowest concentration (566 mg/kg). Zn leaching fluctuated more with HLS, SHS and Na2EDTA than with DOM (Fig. 7). Similar to what was observed with Cu and Pb, Zn removal was highest during the frist few hours of soil flushing. Zn removal with WAs (except for DOM) fluctuated more with a fulshing time at 0.5 ml/min than at 1.0 ml/min. Te hcumulative amounts of Zn washed from soil are presented in Fig. 6. In the case of Zn, as in the case of Cu, a longer fulshing time was required for Zn removal with the SS_WAs than with Na2EDTA. For example, with SHS (Fig. 6c, flow rate 1fml/min), the concentration of Zn removed from soil afetr 8th of flushing was 53% of C max,Zn. In contrast, with Na2EDTA (Fig. 6d, flow rate 1 ml/min), the concentration of the HM that was removed from soil afetr 8 h of flushing was 84% of C max,Zn (although the overall process efcfieincy was similar, 74% for SHS and 72% for Na2EDTA). Teh difefrences in flushing time needed for efefctive Zn removal were refelcted by the values of the kinetic constants, k Zn, which were about twofold higher with Na2EDTA than with the SS_WAs(0.22e h−1 at both flow rates vs. 0.09–0.11, h−1, respectively). With all tested WAs, k Zn values did not difefr signif-i cantly between flow rates. However, the flow rate influenced the maximum concentration of Zn removed from the soil (C max,Zn), but mainly with DOM and Na2EDTA. Te hinitial rate of Zn removal (r Zn) was highest with Na2EDTA (74.8 mg/kg·h at 0.5 ml/min, 94.2Nmg/kg·h at 1.0 ml/min). However, even though k Zn and r Zn were highest with Na2EDTA, C max,Zn was highest with HLS. Tehrefore, although it requires more flushing time, HLS can remove more Zn from soil than Na2EDTA (at a flow rate 1 ml/min, 83% Zn with HLS, 72% Zn with Na2EDTA). Tish study shows that SS_WAs efefctively remove Cu, Pb and Zn from soil. Although the rate of HM removal was higher with Na2EDTA, SS_WAs removed HMs with high efcfieincy within several hours. Hauser et al.32obtained difefrent results. In column experiment with EDDS as WA, flushing time lasted 5–8aweeks, depend-ing on soil type and HM concentration: in 3 difefrent soils, Cu concentrations ranged from 73 to 527dmg/kg; Zn concentrations, from 659 to 987rmg/kg; and those of Pb, from 60 to 732rmg/kg. Tehy found that column flushing removed 18–26% of Cu, 20–64% of Zn and 18–91% of Pb. According to those authors, however, the main disadvantage of column leaching was the long flushing time, which caused substantial biodegradation and dissolution of iron oxides leading to the formation of Fe(III)EDDS and the biodegradation of EDDS. Tehse processes reduced the flushing efcfieincy because less EDDS was available for complexation. Juwarkar etsal.17 used di-rhamnolipid biosurfactant for removal of Pb (905.4amg/kg) and Cd (435.4omg/kg) in a column experiment. Cumulative removal of Pb and Cd afetr 36mh flushing, totaled 92% and 88%, respectively. Although cumulative Pb removal with HLS in the present study (77%) was lower than the amount removed with di-rhamnolipid biosurfactant 17, it should be taken into account that the amount Pb in the contaminated soil in the present study (1414amg/kg) was almost 60% higher than that in Juvarkar et al.17. Moreover, the amount of Pb removed in the present study totaled 1100 mg/kg, whereas the amount in their study equaled 800amg/kg. Additionally, the time for Pb removal was ca. twofold shorter with HLS than with di-rhamnolipid (180h versus36 h). It should be emphasized, however, that the course of Pb removal difefred between these two studies. Juvarkar etoal.17 found that, at the time of the frist leachate sample, 8% of Cd had been removed from the soil, and at 24 h, 30 h and 36th, 20% of the HM had been removed. Pb removal was 4% at the time leachate was frist sampled, followed by 8% at 6 h, 12% at 12 h and 20% at 24 h. Later, Pb removal remained constant at 22% at 30and 36 h. In the study presented here, in contrast, the hourly amount of Pb removed by the SS_WAs was highest in the frist 2th of removal, with 408cmg/kg removed by HLS during this time (37% of C max,Pb), and 982hmg/kg of Pb had been removed afetr 8 h (90% of C max,Pb). HM mobilization from chemical fractions as a factor determining soil flushing efcfieincy. Teh changes in Cu, Pb and Zn distribution in unflushed and flushed soil are presented in Figs.o 8, 9 and 10. In contam-inated soil, the content of the HMs in the fractions was as follows: Cu, F1 > > F2 > F4 > F3; Pb, F1 > > F2 > F3 > F4; and Zn, F1 > > F4 > F2 > F3. Due to their high mobility, Cu, Pb and Zn were susceptible to removal from soil via flushing. Indeed, the share of each HM in the exchangeable and acid soluble (F1) fraction ranged from 74 to86% of the total concentration. In contrast, the shares of the HMs in the potentially mobile fraction, F2, were markedly lower: 7.3% of Zn, 8.5% of Cu and 14.8% of Pb. Teh share of each HM in the oxidizable (F3) fraction was low (1.2–6.4%), which refelcted soil properties afefcting sorption capacity, i.e., low organic matter content and low cation exchange capacity 19. Similarly, the shares in the residual (F4) fraction ranged from 4.2% (Cu) to13.8% (Zn). In general, the higher the content of a HM in the F3 and F4 fractions, the lower the efcfieincy of removal of the HM 33. Teh analysis of HM distribution indicates that, during soil flushing, HMs were mainly removed from F1 and F2 fractions. In addition, the higher WA flow rate facilitated HM removal from these fractions. Te hlow removal efcfieincy of Cu from stable F3 and F4 fractions resulted from high share of HM in the most mobile F1 and F2fractions and their preferable removal with WAs. At a flow rate of 0.1 ml/min, DOM and HLS decreased Cu content in the F1 fraction from 6655omg/kg to 1236and 1486 mg/kg, corresponding to 81 and 78% efcfieincy, respectively. Tish was more efcfieint than Cu removal with SHS and Na2EDTA. DOM and HLS also removed Cu efcfieintly from the F2 fraction. Te hrelative amounts of Cu removed from the F1 and F2 fractions by the WAs corresponded well with the total amounts removed, which were higher with DOM and HLS than with SHS and Na2EDTA. Te hefefct of soil flushing at the two flow rates on Cu removal from the oxidizable fraction (F3) was clear. With HLS at a flow rate of 0.5 ml/min, and with SHS at 1.0aml/min, the content of Cu in the F3 fraction increased from 97 mg/kg to 101 and 107 mg/kg, respectively. Tish slight increase in Cu content could be due to sorption of WAs in the soil, and redistribution and incorporation of previously mobilized HMs into the F3 fraction. Although the soil had been spiked, the Cu in the residual fraction (F4) was relatively stable. With all tested WAs, the efcfieincy of Cu removal from the F4 fraction was only 2–6%. HMs in the residual fraction are usually Vol.:(0123456789) (d) 800 0.5 ml/min. 1 ml/min. 600 一 E co 400上 寸 3%5% 2%6% 4%5% 5%6% 200 0 Unflushed Flushed with Flushed with Flushed with Flushed with DOM HLS SHS Na2EDTA Figure 9. Changes in Pb distribution in unflushed soil and soil flushed with DOM, HLS, SHS and Na2EDTA at two flow rates. Te hvalues above the bars mean the removal efcfieincy of Pb from individual fractions: (a ) F1fraction, (b ) F2 fraction, (c ) F3 fraction, (d ) F4 fraction. Data are expressed as mean values (n = 2) ± standard deviation error bars. (a)500 (b)100 Figure 10. Changes in Zn distribution in unflushed soil and soil flushed with DOM, HLS, SHS and Na2EDTA at two flow rates. Te hvalues above the bars mean the removal efcfieincy of Zn from individual fractions: (a ) F1fraction, (b ) F2 fraction, (c ) F3 fraction, (d) F4 fraction. Data are expressed as mean values (n = 2) ± standard deviation error bars. expected to be very stable and generally cannot be removed or redistributed into other fractions 34. In contrast, those in the exchangeable, carbonate and oxide bound fractions are easily extracted from soil under washing conditions using organic chelators 33,35. Race et al.36 observed that fulshing with EDDS mainly removed Cu and Zn from the acid soluble fraction, which corresponded to rapid HM mobilization. Similarly, in our study, the HM concentrations in the leachate from the column reactor were highest during the frist 1–3 h of soil flushing. Efcfieint removal of HMs from the exchangeable and acid soluble fraction can be caused by ion exchange and metal dissolution from carbonates. Ke eteal.37 have shown that, during column leaching of HMs (including Cu, Pb and Zn) from industrial soils using citric acid as an organic chelator, the HMs were mainly removed from the exchangeable and carbonate fractions (the F1 fraction in our study) and from the reducible fraction. Te hmain reason for HM removal was solubility of exchangeable fraction with citric acid, while the principal cause of HM removal from the reducible and oxidizable fractions was chelation with citric acid. At the flow rates tested in this study, the overall efcfieincy of Pb removal with DOM was poor (Fig.i 8), as was the efcfieincy of its removal from each fraction with this WA (4 to 9%). Afetr application of HLS and Na2EDTA at 0.5 ml/min, the content of Pb in the F1 fraction decreased by 80–84%. An increasing in flow rate was not signifciant for further Pb removal from the F1 fraction. On contrary, flow rate of 1.0sml/min was benefciial for decreasing Pb content in the F2 fraction, i.e. from 162 to 44omg/kg for HLS and from 137 to 53bmg/kg for Na2EDTA. On this basis, the efcfieincy of Pb removal from the F2 fraction at 1.0 ml/min was higher by 57% and by 40%, respectively compared to Pb removal at 0.5 ml/min. In contrast to Na2EDTA, the SS_WAs had little efefct on Pb removal from F3 and F4 fractions. Complexation of Pb with soil organic matter limits its migration, this may explain poor decrease in oxidizable Pb afetr flushing with SS_WAs, which partially sorbed to soil 38. Na2EDTA is considered to be the most efefctive synthetic chelator to remove Pb from soil due to its strong chelating ability for Pb 39,40. Chelating agents are capable of partly dissolving soil matrix constituents including (hydr)oxides of major HMs as well as organic matter 18. Te hability of WAs to remove Zn from the F1 fraction at both flow rates was the highest for HLS, lower but comparable for SHS and Na2EDTA, and the lowest for DOM. Soil flushing with HLS at 1.0 ml/min nearly com-pletely removed Zn from the most mobile fraction. Based on HM changes in the content of F1 fraction, DOM afnfitiy towards to HMs decreased in order: Cu > Zn > Pb. Teh lowest Zn concentration in the F2 fraction was observed afetr soil flushing with HLS and Na2EDTA. Tehse two WAs were also the most efcfieint in Zn removal from the F3 fraction. Teh SS_WAs and Na2EDTA visibly difefred in Zn removal from the F4 fraction, 8–13%versus 19–45%, respectively. Conclusions Soil flushing in a column with SS_WAs can be considered a method for remediation of Cu, Pb and Zn contami-nated soil. At both flow rates and for all WAs used, HMs were removed mainly from the F1 and F2 fractions. With all the WAs at both flow rates, stable flow velocity was maintained for approximately 8 h at 1.0 ml/min and 16th at 0.5eml/min. With longer flushing times (up to 24ih) and larger pore volumes, hydraulic conditions became unstable. Although flow rate did not influence k, it infulenced the maximum concentration of each individual metal removed: with almost all tested metals and WAs, C max values were higher at 1uml/min than at 0.5hml/min. At both flow rates, k values for Cu and Zn removal, but not Pb removal, were ca. twofold higher with Na2EDTA than with SS_WAs. Of the tested SS_WAs, DOM removed Cu most efefctively (73%), and HLS removed Zn and Pb most efefc-tively (83% and 77%, respectively). Tuhs, compared to removal of the respective metals with Na2EDTA (63%,72% and 80%), DOM removes Cu more efcfieintly, HLS removes Zn more efcfieintly, and HLS removes Pb only slightly less efcfieintly. Teh large decreases in HM concentrations (C max) that were observed indicate that soil flushing with SS_WAs can be successfully applied for moderately contaminated soil. For efefctive Cu removal, DOM is the best alterna-tive; for Pb and Zn removal, HLS is the best one. Received: 18 March 2021; Accepted: 27 April 2021Publ is hed online: 12 May 2021 References 1.Taylor, M. P., Mackay, A. K., Hudson-Edwards, K. A. & Holz, E. Soil Cd, Cu, Pb and Zn contaminants around Mount Isa city, Queensland, Australia: Potential sources and risks to human health. Appl. Geochem. 25, 841–855 (2010). 2.Sainger, P. A., Dhankhar, R., Sainger, M., Kaushik, A. & Singh, R. Assessment of heavy metal tolerance in native plant species from soils contaminated with electroplating efufelnt. Ecotoxicol. Environ. Saf. 74, 2284–2291 (2011). 3.Yaylalı-Abanuz, G. Heavy metal contamination of surface soil around Gebze industrial area, Turkey. Microchem. J. 99, 82–92(2011). 4.Nakayama, S. M. M. et al. Metal and metalloid contamination in roadside soil and wild rats around a Pb–Zn mine in Kabwe, Zambia. Environ. Pollut. 159, 175–181 (2011). 5.Medyńska-Juraszek, A. & Kabała, C. Heavy metal pollution of forest soils afefcted by the copper industry. J. Elementol. 17, 441–451(2012). 6.Torres, L. G., Lopez, R. B. & Beltran, M. Removal of As, Cd, Cu, Ni, Pb, and Zn from a highly contaminated industrial soil using surfactant enhanced soil washing. Phys. Chem. Earth Parts ABC 37(39), 30–36 (2012). 7.Kulikowska, D., Klik, B., Gusiatin, Z. M. & Jabłoński, R. Sewage sludge can provide a washing agent for remediation of soil from a metallurgical area. CATENA 173, 22–28 (2019). 8.Zou, Z. et al. Teh study of operating variables in soil washing with EDTA. Environ. Pollut. 159, 229–236 (2009). 9.Gusiatin, Z. M., Kulikowska, D. & Klik, B. Suitability of humic substances recovered from sewage sludge to remedy soils from a former As mining area - a novel approach. J. Hazard. Mater. 38, 160–166 (2017). 10.Wang, G. et al. Efefct of soil washing with biodegradable chelators on the toxicity of residual metals and soil biological properties. Sci. Total Environ. 625, 1021–1029 (2018). 11.Borggaard, O. K., Holm, P. E. & Strobel, B. W. Potential of dissolved organic matter (DOM) to extract As, Cd Co, Cr, Cu, Ni, Pb and Zn from polluted soils: A review. Geoderma 343, 235–246 (2019). 12.Xiao, R. et al. Comparison of the feasibility of difefrent washing solutions for combined soil washing and phytoremediation for the detoxifciation of cadmium (Cd)and zinc (Zn)in contaminated soil. Chemosphere 230, 510–518 (2019). 13.Liu, L., Li, W., Song, W. & Guo, M. Remediation techniques for heavy metal-contaminated soils: Principles and applicability. Sci. Total Environ. 633, 206–219 (2018). 14.Cummings, J. US EPA Contaminated Site Cleanup Information (CLU-IN). In situ flushing [WWW Document]. https:// clu- in. org/ techf ocus/ defau lt. focus/ sec/ In_ Situ_ Flush ing/ cat/ Overv iew/ (accessed 7.3.21). 15.U.S. Environmental Protection Agency, 2020. CLU-IN Soil washing, Application [WWW Document]. https:// cluin. org/ techf ocus/defau lt. focus/ sec/ soil_ washi ng/ cat/ Appli cation/ (accessed 7.3.21). 16.Kantar, C. & Honeyman, B. D. Citric acid enhanced remediation of soils contaminated with uranium by soil flushing and soil washing. J. Environ. Eng. 132(2), 247–255 (2006). 17.Juwarkar, A. A. et al. Biosurfactant technology for remediation of cadmium and lead contaminated soils. Chemosphere 68, 1996–2002 (2007). 18.Mancini, G., Bruno, M., Polettini, A. & Pomi, R. Chelant-assisted pulse flushing of a feild Pb-contaminated soil. Chem. Ecol. 27(3),251–262 (2011). 19.Yang, Z. et al. Remediation of heavy metal contamination in calcareous soil by washing with reagents: A column washing. Procedia Environ. Sci. 16, 778–785 (2012). 20.Zhao, B., Che, H., Wang, H. & Xu, J. Column flushing of phenanthrene and copper (II) co-contaminants from sandy soil using Tween 80 and citric acid. Soil Sediment Contam. Int. J. 25(1), 50–63 (2016). 21.Laboratory column tests. Saeedi, M., Loretta, Li Y. & Grace, J.R. Simultaneous removal of polycyclic aromatic hydrocarbons and heavy metals from natural soil by combined non-ionic surfactants and EDTA as extracting reagents. J. Environ. Manag. 248,109–258 (2019). 22.Long, A., Zhang, H. & Lei, Y. Surfactant flushing remediation of toluene contaminated soil: Optimization with response surface methodology and surfactant recovery by selective oxidation with sulfate radicals. Sep. Purif. Technol. 118, 612–619 (2013). 23.Navarro, A. & Martínez, F. Te huse of soil-fulshing to remediate metal contamination in a smelting slag dumping area: Column and pilot-scale experiments. Eng. Geol. 115(1–2), 16–27 (2010). 24.Klik B., Gusiatin, Z.M. & Kulikowska, D. A holistic approach to remediation of soil contaminated with Cu, Pb and Zn with sewage sludge-derived washing agents and synthetic chelator. J. Clean. Prod. (under review ). 25.Kulikowska, D. & Klimiuk, E. Organic matter transformations and kinetics during sewage sludge composting in a two-stage system. Biores. Technol. 102(23), 10951–10958 (2011). 26.Klik, B., Kulikowska, D., Gusiatin, M. Z. & Pasieczna-Patkowska, S. Washing agents from sewage sludge: Efcfieincy of Cd removal from highly contaminated soils and efefct on soil organics balance. J. Soils Sediments 20, 284–296 (2020). 27.Luciano, A., Viotti, P., Torretta, V. & Mancini, G. Numerical approach to modelling pulse-mode soil fulshing on a Pb-contaminated soil. J. Soils Sediments 13(1), 43–55 (2013). Vol:.(1234567890) 28.Pueyo, M. et al. Use of the modifeid BCR three-step sequential extraction procedure for the study of trace element dynamics in contaminated soils. Environ. Pollut. 152, 330–341 (2008). 29.Wang, S. & Mulligan, C. N. Rhamnolipid foam enhanced remediation of cadmium and nickel contaminated soil. Water Air Soil Pollut. 157(1), 315–330 (2004). 30.Yun, S. M., Kang, C. S., Kim, J. & Kim, H. S. Evaluation of soil flushing of complex contaminated soil: An experimental and mod-eling simulation study. J. Hazard. Mater. 287, 429–437 (2015). 31.Tsang, D. C., Zhang, W. & Lo, I. M. Copper extraction efefctiveness and soil dissolution issues of EDTA-flushing of artifciially contaminated soils. Chemosphere 68(2), 234–243 (2007). 32.Hauser, U., Tandy, S., Schulin, R. & Nowack, B. Column extraction of heavy metals from soils using the biodegradable chelating agent EDDS. Environ. Sci. Technol. 39, 6819–6824 (2005). 33.Wang, G. et al. Efcfieincy of nanoscale zero-valent iron on the enhanced low molecular weight organic acid removal Pb from contaminated soil. Chemosphere 117, 617–624 (2014). 34.Zhang, W., Huang, H., Tan, F., Wang, H. & Qiu, R. Infulence of EDTA washing on the species and mobility of heavy metals residual in soils. J. Hazard. Mater. 173(1–3), 369–376 (2010). 35.Suanon, F., Sun, Q., Dimon, B., Mama, D. & Yu, C. P. Heavy metal removal from sludge with organic chelators: Comparative study of N, N-bis (carboxymethyl) glutamic acid and citric acid. J. Environ. Manag. 166, 341–347 (2016). 36.Race, M. et al. Ethylenediamine-N,N ′-disuccinic acid (EDDS)—enhanced flushing optimization for contaminated agricultural soil remediation and assessment of prospective Cu and Zn transport. International Journal of Environmental Research and Public Health 15(3), 543 (2018). 37.Ke, X. et al. Removal of Cd, Pb, Zn, Cu in smelter soil by citric acid leaching. Chemosphere 255, 126690 (2020). 38.Ash, C. et al. Redistribution of cadmium and lead fractions in contaminated soil samples due to experimental leaching. Geoderma 241, 126–135 (2015). 39.Zou, Z. et al. Teh study of operating variables in soil washing with EDTA. Environ. Pollut. 157(1), 229–236 (2009). 40.Voglar, D. & Lestan, D. Pilot-scale washing of Pb, Zn and Cd contaminated soil using EDTA and process water recycling. Chem-osphere 91(1), 76–82 (2013). Acknowledgements Tish study is a result of the research project No. 2017/27/N/ST8/00255 funded by the National Science Centre. Tish study financially co-supported by Minister of Science and Higher Education in the range of the program entitled “Regional Initiative of Excellence” for the years 2019–2022, Project No. 010/RID/2018/19, amount of funding 12,000,000 PLN. Author contributions B.K.—conceptualized and designed the study, carried out the experiment, interpretation of the results, writing the paper Z.M.G.; D.K.—conceptualized and designed the study, contributed to the interpretation of the results and writing the paper. Competing interests Teh authors declare no competing interests. Additional information Correspondence and requests for materials should be addressed to Z.M.G. Reprints and permissions information is available at www.nature.com/reprints . Publisher’s note Springer Nature remains neutral with regard to jurisdictional claims in published maps and institutional aflifatiions. Open Access Tish article is licensed under a Creative Commons Attribution 4.0 International License, which permits use, sharing, adaptation, distribution and reproduction in any medium or format, as long as you give appropriate credit to the original author(s) and the source, provide a link to the Creative Commons licence, and indicate if changes were made. Te himages or other third party material in this article are included in the article’s Creative Commons licence, unless indicated otherwise in a credit line to the material. If material is not included in the article’s Creative Commons licence and your intended use is not permitted by statutory regulation or exceeds the permitted use, you will need to obtain permission directly from the copyright holder. To view a copy of this licence, visit http:// creat iveco mmons. org/ licen ses/ by/4. 0/. © Te hAuthor(s) 2021
关闭-
1/15
-
2/15
还剩13页未读,是否继续阅读?
继续免费阅读全文产品配置单
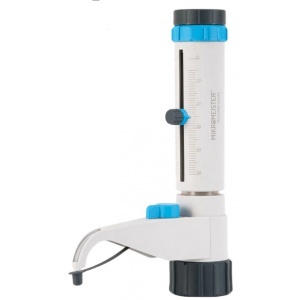
中国格哈特为您提供《农业区表层土壤样品(0-30cm)样品的24小时振荡》,该方案主要用于土壤中(类)金属及其化合物检测,参考标准《HJ 803-2016 土壤和沉积物 12种金属元素的测定 王水提取-电感耦合等离子体质谱法》,《农业区表层土壤样品(0-30cm)样品的24小时振荡》用到的仪器有格哈特强力高重现振荡器LS500/RO500、格哈特快速干燥仪STL56、德国移液器MM。
我要纠错
推荐专场
快速干燥仪
更多
相关方案
 咨询
咨询