

diamond
第1楼2006/08/25
CHAPTER 1 Introduction to Mordern FT-IR Spectoscopy
1.1 Principle of FT-IR: The Michelson Interferometer
Invented more than one hundred years ago, the two-beam Michelson interferometer is still the heart of most modern Fourier transfom infared(FT-IR) spectrometers. It consists of a fixed mirror and a beamsplitter, as illustrated in Figue 1.1. The beamsplitter is a laminate material that reflects and transmits light equally. The collimated infared(IR) beam from the source(S) is paretially transmitted to the moving mirror and partially reflect to the fix mirror by the beamsplitter. The two IR beams are then reflected back to the beamsplitter by the mirrors. The detector(D) then sees the transmitted beam from the fixed mirror and reflected beam from the moving mirror simulaneously. The two combined beams interfere constructively or destructively depending on the wavelength of the light (or frequency in wavenumbers) and the optical path difference introduced by the moving mirror. The latter is reflected to as retardation,δ(cm). to obtain an interferogram, I(δ), the decetor signal is digitized and recorded as function of retardation.
The interferogram intensity of a polychromatic source is mathematically described as :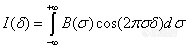
where B(δ) is the spectral intensity at wavenumber σ(cm-1).
diamond
第2楼2006/08/26
The interferogram I(δ) is a simple sinusoidal wave when a monochromatic source is used, as shown in Figure 1.2. For a continuum (or polychromatic) source, I(δ) is a superposition of sinusodial wave for IR light at all wavenumbers σ. At zero path difference (ZPD) or zero optical retardation, all the sinusiodal waves are today constructive, producing a centerburst on the interferogram. Fourier transfomation (FT) of I(δ) gives the single-beam IR spectrum expressed as below: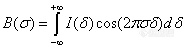
(1-2)
In pratice, a discrete Fourier transform (DFT) is used as a digital approximation of the continuous Fourier series. thus Equation (1-2) reduces to: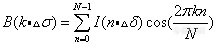
(1-3)
where the continuous variables of wavenumber σ, and optical retardation δ, have been replaced by discrete values k and n, respectively. The summation is then over the total number of discrete data points N.
diamond
第3楼2006/08/27
1.2 Continuous-Scan Interferometry
In a continuous-scan FT-IR specterometer, the moving mirror moves continuously at a constant velocity, v(cm/s), and the optical path difference at time t(s) is given by δ=2vt(cm). The interferogram data points are digitized at the zero crossings of a helium neon (He-Ne) laser signal on the fly, as shown in Figure 1.3. The use of laser signal ensure that I(δ) is measured at precisely equal intervals of mirror positions and provides an internal wavelength calibration of every scan. Because of the continuous movement of the mirror, the interferogram I(δ) becomes an explicit function of time. The Fourier frequency (fF) of IR light at wavenumber σ is given by:
(1-4)
Continuous-scan is a preferred choice for routine static or relatively slow kinetic measurements that require time resolution not faster than 20ms. In this mode, the graphite bearing of the research interferometers rides on a cushion of air. This allows precise control of the mirror velocities from 0.0079 to 4.11 cm/s. The slow velocities are chosen for thermal detectors; such as a triglycine sulfate (TGS) or a photoacoustic (PA) detector. The fast velocities are chosen for fast quantum detectors, such as a mercury cadmium telluride (MCT) or an indium antimonide (InSb) detector, for routine or kinetic measurements requiring time resolution that is not faster than 20ms.
For dynamic and time-dependent processes occurring at rates faster than 20ms time scales, continuous-scan is no longer useful, because the temporal Fourier frequencies become convolved with the time-dependence of the processes. These difficulties associated with continuous-scan can be overcome with step-scan interferometery. Step-scan provides advantages for spectroscopic measurements of dynamic experiments where the signal is phase-, time-, or space-dependent.
diamond
第4楼2006/08/28
1.3 Step-Scan Interferometry
1.3.1 Introduction
One of the research-grade Nicolet FT-IR spectrometers' advanced scanning capabilities is step-scan. In step-scan, the moving mirror moves incrementally in steps. Step-scan elimiates Fourier modulation interference encountered in continuous-scan FT-IR and allows measurements to be made as an explicit function of phase, time, or space. Typical applications of step-scan Ft-IR can be classified into three primary categoties: 1)phase-resolved spectroscopy (PRS) for modulation experiments, such as photoacoustic depth profiling and polymer rheo-optical characterization; 2)time-resolved spectroscopy (TRS) for fast kinetic processes down to nanosecond time scales; and 3)space-resolved spectroscopy (SRS) for focal plane array detector-based FT-IR chemical imaging. These powerful techniques hace opened up new avenues for solving a variety of fundamental research and industrial problems in life sciences, chemistry, physics, materials sciences and many other fields.
diamond
第5楼2006/08/29
1.3.2 Phase-,Time- and Space-Resolved Step-Scan Data Acquisition
Data acquisition schemes for step-scan phase-, time- and space-resolved FT-IR experiments are illustrated in Figure 1.4. At each sampling position of the moving mirror (usually at a zero-crossing of the He-Ne laser interferogram) data are collected (or processed) at 0°(in-phase, I) and 90°(quardrature,Q) in PRS; at time intervals defined by the sampling rate of the digitizer in TRS; or from all detector elements(pixels) in SRS. Interferograms corresponding to different phase, times and detector elements are then constructed and phase-, time- and space-resolved spectra are finally computed by performing fast Fourier transform on the interferoram data sets.
diamond
第6楼2006/08/30
1.3.3 The Vectra-Piezo Interferometer
Interferometer design. The Vectra-Piezo air-cushioned graphite step-scan interferometer, as shown in Figure 1.5, is the heart of research-grade Nicolet FT-IR spetrometers. This uniquely designed interferometer preserves some of the key performance characteristics of an air bearing and offers many unique advantages for step-scan capabilities. The performance advantages are attributed to the use of the computational powerful of the multi-embedded, digital signal processors (DSP) for many interferometer functions, including step-and-hold servo controls, dynamic alignment, modulation/demodulation signal generation and bench routing diagnostics. The properly existing near-zero friction of the air-cushioned interferometer with full DSP control allows the moving mirror to stop completely at a precise position for ideal step-scan data collection.
diamond
第7楼2006/08/31
Dynamic Alignment.
The dynamic alignment for the Vectra-Piezo interferometer maintains the optical system of the interferometer in nearly prefect alignment during a scan. It actively compensates for any potential optical misalignment caused by ambient temperature changes or environmetnal vibration disterbances and thus improves the line shape for high-resolution scans. This is accomplished by monitoring the signal phase of two orthogonally located and one centrally located, DC-coupled laser detectors at each mirror position (step). The dynamic alignment is active during the mirror pre-settling of each step, ensuring that the phase between the three laser detectors are identical to those of the precious step. Once the moving mirror comes to a complete stop for data collection, the dynamic alignment becomes inactive, thus it is referred to as smart dynamic alignment.
diamond
第10楼2006/09/01
Mirro Position Accuracy.
The designs of the interferometer and the advanced DSP control algorithms make the research-grade Nicolet FT-IR spectrometers nearly immune to ambient acoustic noises and vibrations. As show in figure 1.6, the mirror position accuracy is as googd as ±0.2nm, as measured from the peak-to-peak noise of the laser signal with the instrument placed on a regular laboratory table. This peak-to-peak noise is a critical performance parameter to ensure all step-scan experimental data is collected with high signal-to-noise ratio(SNR).
The intensity of the He-Ne laser interferogram generated from a Michelson interferometer, V(x), as shown in Figure 1.6, can be expressed in terms of mirror displacement, x(nm), by 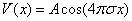
where A=18.79/2 v, σ=1/633nm-1. The peak-to-peak mirror position deviation, δx, can be measure from the total fluctuation (noise) of the laser signal δV(v), at any zero crossing (assume the first one, i.e.) 4πσx=π/2, or x=1/(8σ), using the derivative of the above equation, i.e.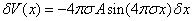
Thus,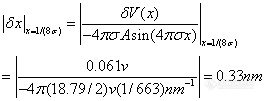
or δx=±0.33/2=±0.2nm