

方案详情文
智能文字提取功能测试中
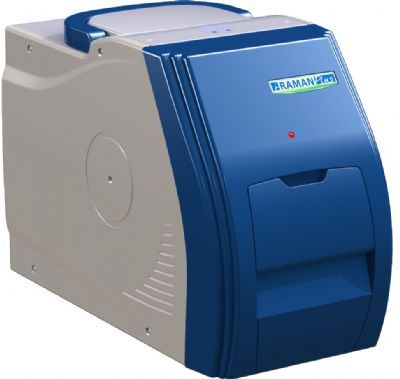
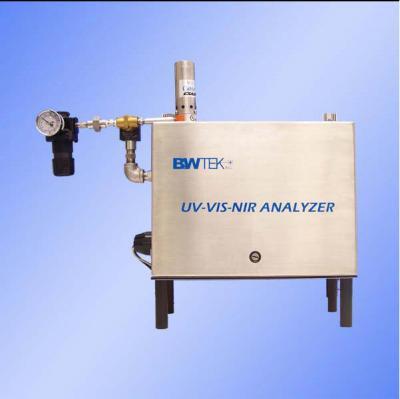
BNTEkk*INC. Measuring Surfactantsin Wastewaterby Raman SSpectrosce 19 Shea Way, Newark, DE 19713 Phone: 302-368-7824FAX:302-368-7830 info@bwtek.com www.bwtek.com General Surfactants are used in a variety of industrialprocesses to reduce the surface tension ofwater and allow various reactions and coatingtechniques to proceed more efficiently. When surfactants are discharged into waste-water, they present a host of environmentalproblems. In addition, the cost of replacinglost surfactant increases production costs,also highly undesirable. A method for monitoring a wastewater streamto quantitatively detect the presence of sur-factant was needed. While many analyticaltechniques would suffice, it was importantthat non-contact sampling be used to avoidfouling- and expensive maintenance. Raman Spectroscopy Raman spectroscopy is an optical techniqueused to study vibrational, rotational, andother low-frequency modes in a system. Itrelies on inelastic scattering of monochro-matic light, usually from a laser. As the mole-cule absorbs the laser energy, electrons arepushed to higher energy states. Since theseare unstable, the electrons quickly revert totheir ground states by emitting photons. Modern Raman spectrometers use very sen-sitive detectors to capture these photons.Those photons with wavelengths close to the The MiniRamTM// laser line (due to elastic Raleigh scattering )are filtered out and the remaining photons atwavelengths higher than the laser line aredispersed onto a detector. Raman scattering is typically very weak, sothe energy is collected for periods of timeranging from 1 to 50 seconds, dependingonthe sample’s Raman efficiency. Modern Ra-man spectrometers use gratings and sophisti-cated filtering to achieve a high degree of la-ser rejection. A CCD detector is most oftenused to collect the Raman scattered photons. Because Raman spectra are shifted from thefrequency of the exciting laser, the frequen-cies are most often referred to as “Ramanshift" and are expressed in cm, similar to For more information, or to arrange an evaluation, please contact our local representative: mid infrared spectra. It is important to note,however, that the frequencies of the two arenot the same. Raman spectra contain information about thechemical structures of molecules; in that re-spect, they are very much like FT-IR spectra.However, because water is elastic, it has avery poor Raman efficiency, making it virtuallytransparent for most applications. Thus,many of the sampling difficulties of FT-IR areavoided while collecting similar, valuablestructural information. The MiniRam TM II Portable Ra-man Spectrometer The MiniRamTM ⅡI Portable Raman Spec-trometer is an innovative development in fieldportable Raman spectroscopy. Utilizing arechargeable battery,a “handtop”computer,and an innovative sampling probe design, theMiniRam Il allows collection of Raman spec-tra in field environments. With a Raman scatter wavelength range of175 cmto 3100 cm"', a spectral resolution of10 cm"FWHM, and a rugged sampling probefor field use, the MiniRam II can collect highquality spectra without transporting samples. Experimental An unidentified surfactant powder was pro-vided along with a sample of wastewater forevaluation. Tap water, which was the main component ofthe wastewater stream, was used to create aseries of solutions containing surfactant pow-der of known concentrations by weight. The samples which were prepared using thesurfactant powder and the tap water areshown in Table 1. The samples prepared using the wastewatersample were made by mixing known volumesof the wastewater sample with tap water;these are shown in Table 2. Table 1. Prepared Standards Sample Powder Tap Water Conc (g) (g) (Wt%) 27.30 0.58% 2 0.31 26.70 1.15% 3 0.51 25.92 1.93% 1.60 3.90% 24.31 6.18% 6 3.49 22.34 13.51% 5.72 20.69 21.66% 25.00 0.00% Table 2. Diluted Wastewater Samples Sample Wastewater Tap Water Conc (ml) (ml) (vol%) a 50.0 0.0 100% b 3.5 10.0 25.9% 3.5 15.0 18.9% d 0.8 19.0 4.0% Raman spectra of all samples were collectedthrough the glass bottles used to prepare thesamples. Because the focal point of theprobe used in the MiniRam TM Il is about 6 mmfrom the end of the probe, the uneven thick-ness and surface imperfections in the glassbottles did not significantly interfere with theRaman spectra-although they probably af-fected the focus of the returning Raman scat-tered radiation. A Raman spectrum of the surfactant powderwas collected through the polymer bag con-taining the powder. Again, using the ex-tended focal length of the probe allowed sam-pling without removing the materials from itscontainers. All spectra were collected using a 40 secondintegration time and were corrected for darkcurrent. Results Figure 1 shows the Raman shift spectrum ofthe surfactant powder. measurements of salt concentration in watermade in the near infrared; the salt itself doesnot absorb, but the perturbations of the OHbands of water can be observed. There are obviously some very well definedRaman shift peaks in the 175-1500 cm"range. A series of spectra were collected from eachof the samples using the MiniRamTM Il andtransferred to The UnscramblerQ by Camo. Figure 1. Surfactant Powder Since the various samples showed baselinedifferences, probably caused by optical inter-ference from the round glass bottles, the firstderivative of each spectrum was calculatedand used for calibration purposes. Figure 3 shows the derivative spectra of thesamples used for calibration. Figure 3. Derivative Spectra of Standards When the powder is dissolved in the waste-water, some very interesting peak changesoccur, however significant peaks are still visi-ble as seen in Figure 2. Figure 2. Dissolved Surfactant in Water As the spectra show, there are clearly someRaman peaks which change as the concen-tration of the surfactant changes. Using The Unscrambler by Camo, a partialleast squares regression was performed onthe samples of known concentration listed inTable 1. A portion of the spectra (centeredaround 800 cm°Raman shift) were used togenerate the equations. This technique im-proves the quality of the prediction by leavingout the portion of the spectral data that doesnot change as the concentration changes. These spectra also indicate that, even thoughwater can be considered to be transparent inthe Raman domain, its effects on samplescan be measured. This is analogous to The results of that regression are shown inthe cross validation plot in Figure 4. Figure 4. Cross Validation of Regression 999673399 1001274 cas PLSRegession4. rvar,PC) (Conc,1)[Conc,1) The data show a high degree of correlation inthe cross validation. The best test of a regression equation, how-ever, is how well it can predict samples thatwere not included in the calibration. To test the equation, the concentrations ofthe samples in Table 2 were predicted usingthe PLS equations developed from the sam-ples in Table 1. It was believed that the concentration of thewastewater sample collected at the site wasapproximately 10%. Sample Predicted Deviation Expected Value unknown 10.4% 0.151 10.0% Sampleb 2.2% 0.165 2.7% Sample c 1.8% 0.159 1.9% Sample d 0.4% 0.162 0.4% The relative error of prediction is larger than amore rigorous calibration would produce. Fur-thermore, if the initial assumption of thewastewater concentration is in error, that willbe carried forward, biasing the predicted re-sults. Nonetheless, the relatively closeagreement between the predicted values andthe estimates ones is encouraging. Conclusion set of sample spectra can be collected usinglow cost sampling techniques. The results also show that the spectral datafrom the MiniRamTM Il can be easily trans-ferred to third party software such as The Un-scrambler by Camo and used to build calibra-tion equations. By installing the Raman spectrometer in anOnlinePro housing, and using a fiber coupledsampling probe, a system could be quicklyand economically installed near the wastewa-ter stream to provide 24/7 monitoring and re-porting. For more information, please contact: B&W TEK, Inc.19 Shea Way Newark, DE 19713 Phone:302-368-7824FAX:302-368-7830info@bwteb.com www.bwtek.com
关闭-
1/4

-
2/4
还剩2页未读,是否继续阅读?
继续免费阅读全文产品配置单
必达泰克光电设备(上海)有限公司为您提供《废水中表面活性剂检测方案(激光拉曼光谱)》,该方案主要用于废水中其他检测,参考标准《暂无》,《废水中表面活性剂检测方案(激光拉曼光谱)》用到的仪器有高灵敏度便携式拉曼光谱仪i-Raman Plus、工业在线光谱分析仪、高通量TE致冷控温CCD阵列光谱仪。
我要纠错


相关方案
 咨询
咨询