

方案详情文
智能文字提取功能测试中
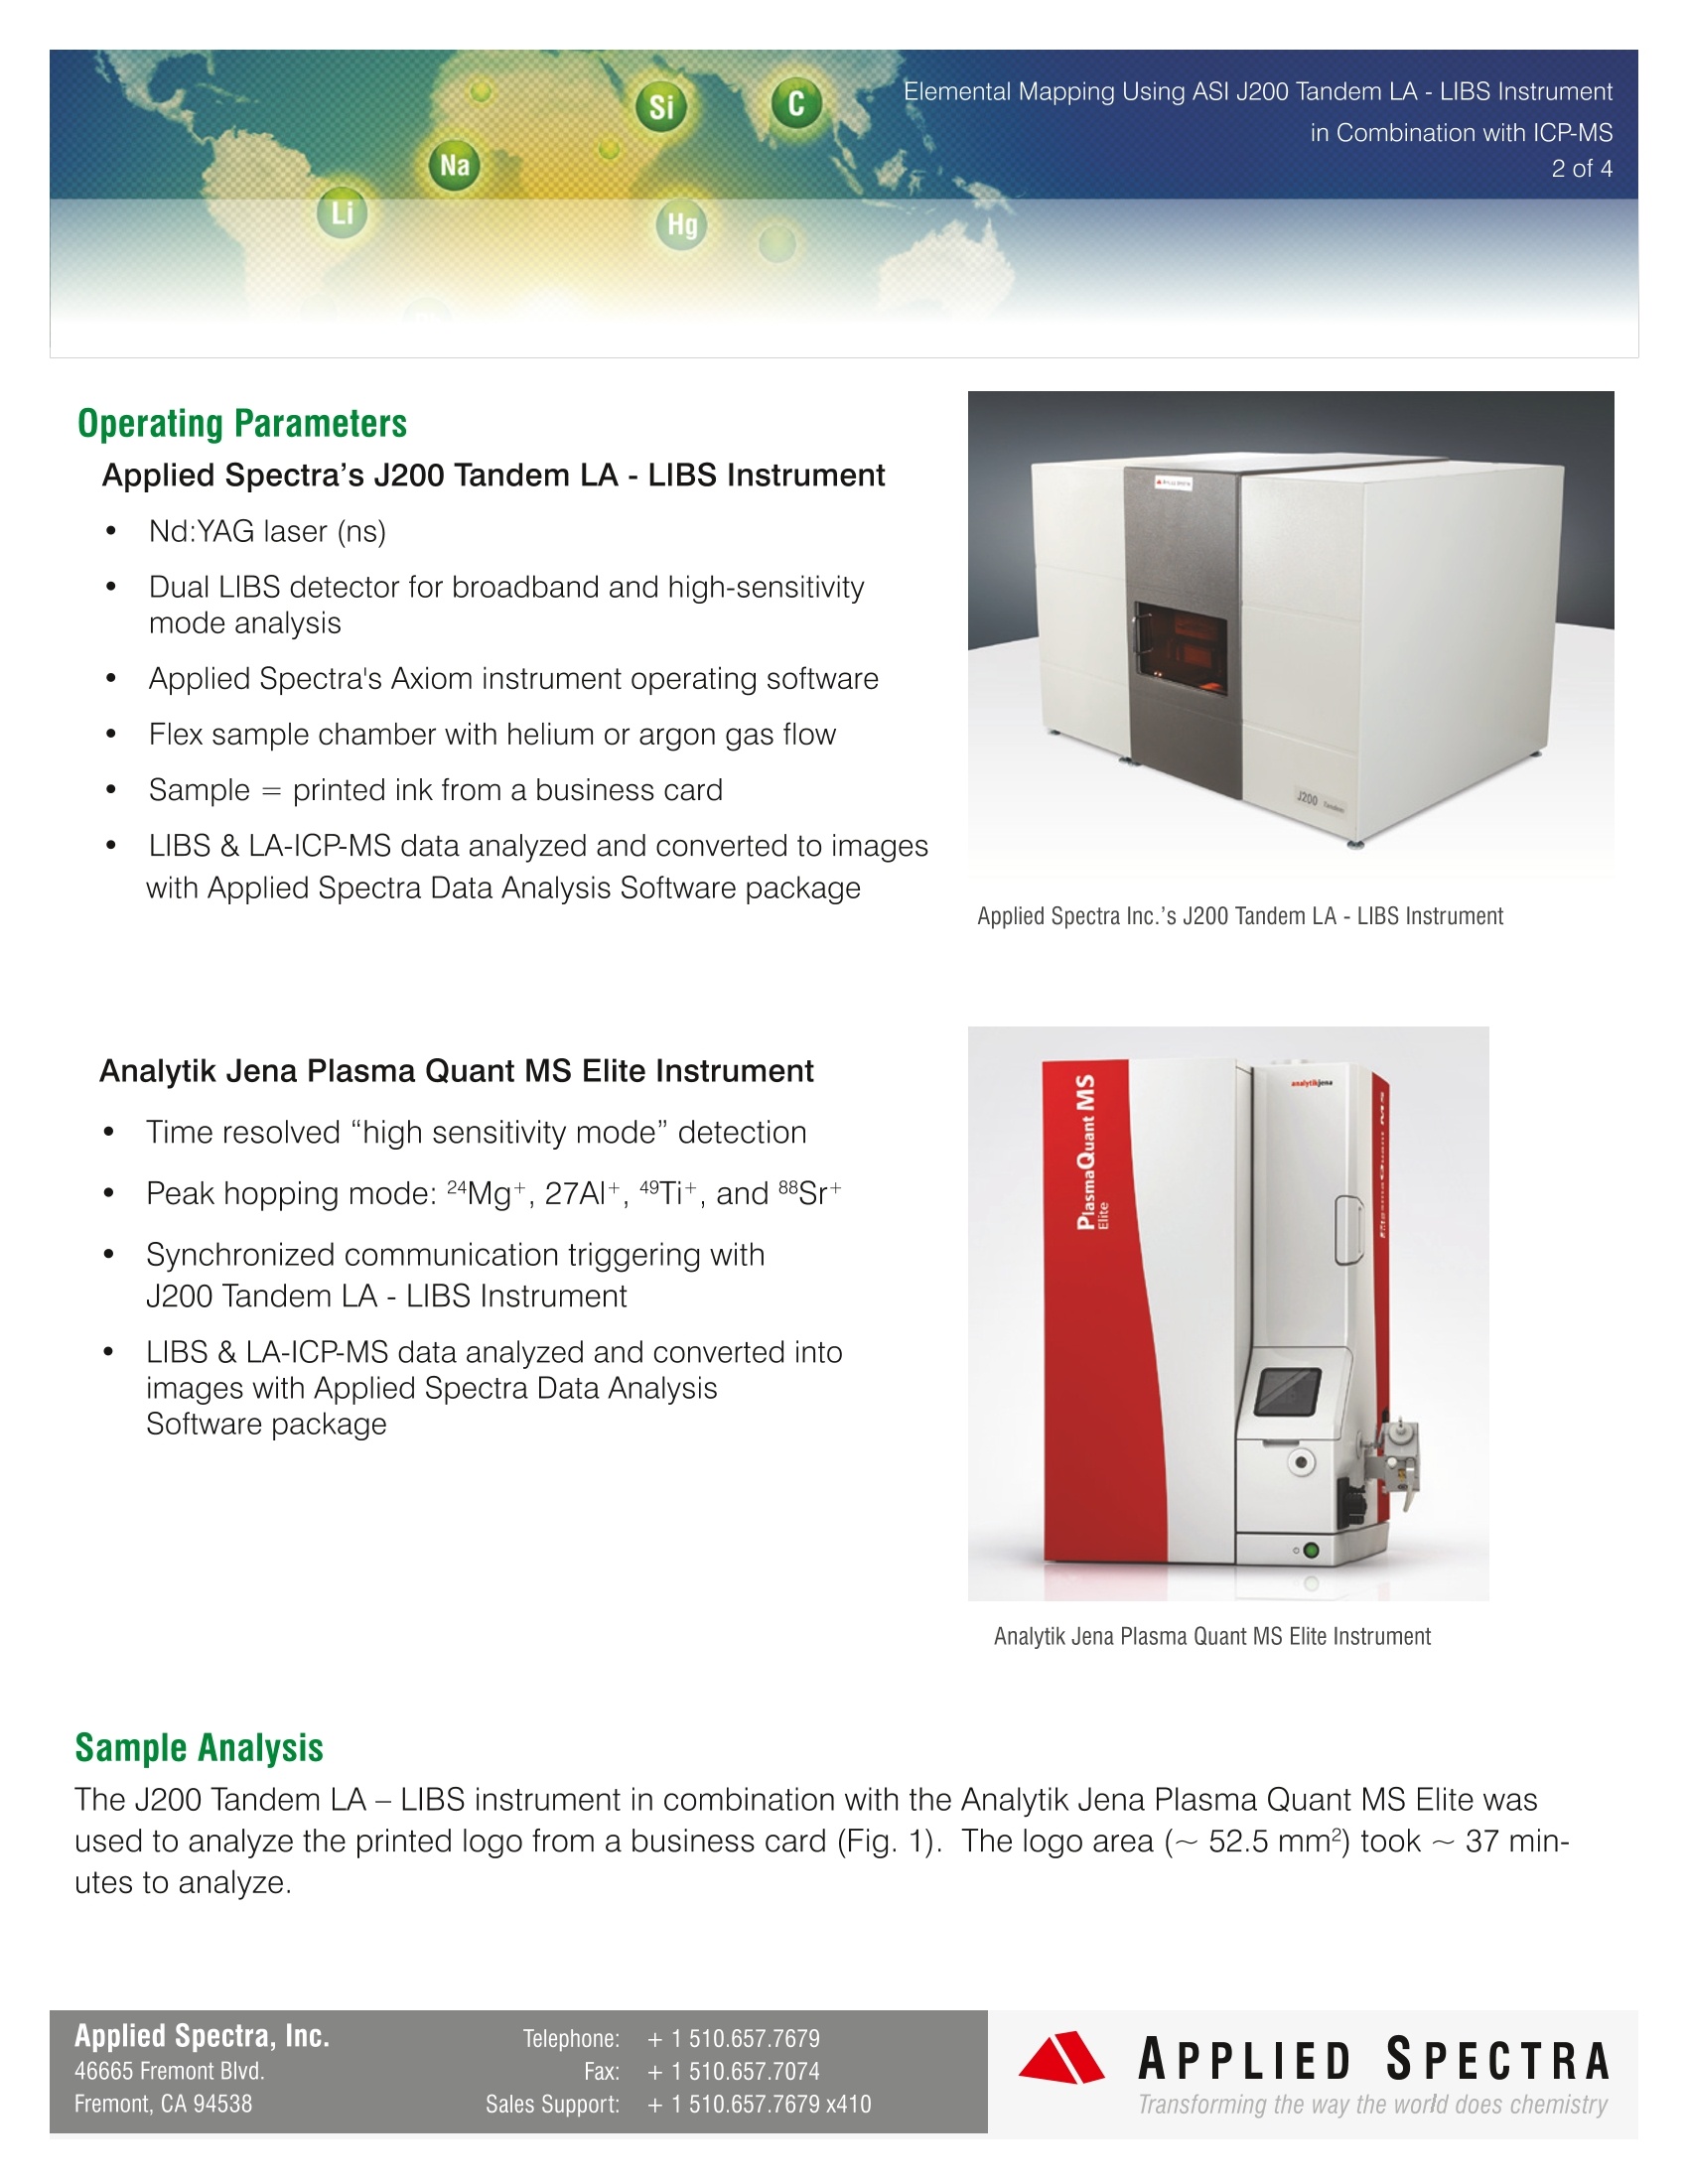
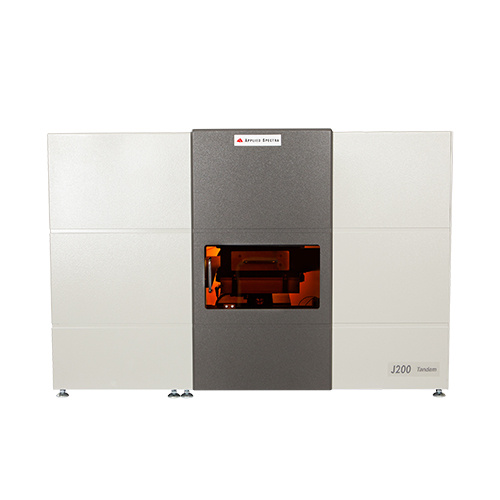
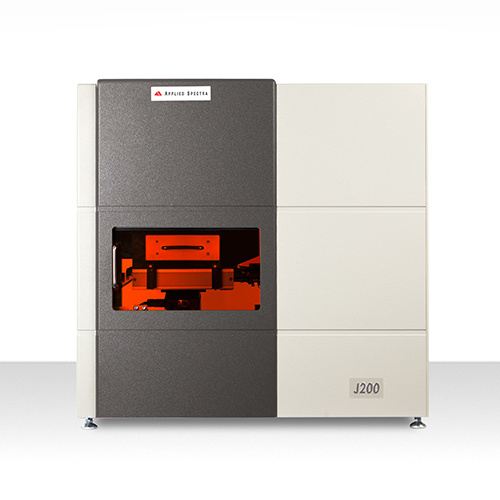
Si C Na Li Hg Pb Elemental Mapping of Printed Ink Using the J200Tandem LA-LIBS Instrument In Combination with ICP-MS Introduction The J200 Tandem LA- LIBS instrument from AppliedSpectra, Inc. provides the unique capability ofcombining the analytical benefits of both LA-ICP-MS(Laser Ablation-Inductively Coupled Plasma-MassSpectrometry) and LIBS (Laser Induced BreakdownSpectroscopy). Specifically, LIBS provides greaterelemental coverage from H-Pu, including elementsthat are difficult or impossible by conventionalICP-MS instrument such as non-metals (e.g. H, N,O), and halogens (e.g. F). When coupled with asensitive ICP-MS instrument. the J200 Tandem canperform quantitative and qualitative measurementsfocusing on trace level elements and their isotopicratio analyses. This instrument, in combination withan ICP-MS, expands the dynamic range of analysisfrom ppb (or the absolute detection limits of the ICP-MS), to % levels with LIBS The ability to determine the elemental distributionin a given sample can be very valuable for manu-facturing, failure analysis, and/or quality control inan industrial environment. For biological research,understanding the distribution of elements thatare known to disrupt biological functions in humanorgans such as the kidneys, liver, and brain, pro-vides significant information by shedding light onthe connection between the distribution of differentkey elements and functions of the tissue. In general,elemental mapping evaluations take hours to gethigh-quality, detailed images. Therefore, improve-ment to analysis time results in significant advance-ments in the efficiency of these types of analysis. Theability to perform fast elemental mapping using theJ200 tandem instrument will be demonstrated in thesubsequent sections. The data obtained from theseexperiments (ICP-MS and LIBS) are analyzed andmapped effortlessly using Applied Spectra's DataAnalysis Software Package. S CElilemental Mapping Using ASI J200 Tandem LA - LIBS Instrumentin Combination with ICP-MSNa 2 of 4LiHg Operating Parameters Applied Spectra's J200 Tandem LA- LIBS Instrument .Nd:YAG laser (ns) .Dual LIBS detector for broadband and high-sensitivitymode analysis .Applied Spectra's Axiom instrument operating software Flex sample chamber with helium or argon gas flow .Sample=printed ink from a business card LIBS & LA-ICP-MS data analyzed and converted to imageswith Applied Spectra Data Analysis Software package Applied Spectra Inc.'s J200 Tandem LA - LIBS Instrument Analytik Jena Plasma Quant MS Elite Instrument ·Time resolved "high sensitivity mode” detection .Peak hopping mode: 24Mg*, 27Al+, 49Tit, and 88Srt .Synchronized communication triggering withJ200 Tandem LA-LIBS Instrument LIBS & LA-ICP-MS data analyzed and converted intoimages with Applied Spectra Data AnalysisSoftware package Analytik Jena Plasma Quant MS Elite Instrument Sample Analysis The J200 Tandem LA - LIBS instrument in combination with the Analytik Jena Plasma Quant MS Elite wasused to analyze the printed logo from a business card (Fig. 1). The logo area (~52.5 mm2) took ~ 37 min-utes to analyze. Applied Spectra, Inc. Telephone: +1510.657.7679 46665 Fremont Blvd. Fax: +1510.657.7074 APPLIED SPECTRA Fremont, CA 94538 Sales Support: +1510.657.7679 x410 Transforming the way the world does chemistry Preliminary analysis suggested that Mg, Al, Ti, and Sr were the best elements to monitor during the LA-ICP-MS portion of this experiment. Figure 2 displays the elemental distribution maps for Mg, Al, Ti, and Sr. Thesignal for Mg was higher in the paper than the red ink. However, the thickness of the ink around the edgesappears to be thinner than the center, based on the Mg signal detected around the edges of the sample. The Al response is clearly only from thepaper and no Al was detected in thered ink of the logo. Typical elementsfor coloring such as Ti and Sr showvery strong signal from the red ink,but were not detected in the paper.These maps, measued 8.9 mm wideby 6.2 mm high, with 0.15 mm spac-ing, had 42 lines with 301 shots perline.They were created in ~ 37 min-utes, show good resolution, and canprovide results in a fast manner, whencompared to other techniques forobtaining this type of information. 4988 Sr Figure 2. LA-ICP-MS elemental maps based on Mg, Al, Ti, and Sr signals obtained from the Analytik JenaICP-MS combined with the J200 Tandem instrument. ( Fremont, CA 94538 ) Complementing the LA-ICP-MS withLIBS provides the ability to detect allelements simultaneously, even ele-ments that are difficult or impossible(e.g. C and H) to detect by ICP-MS.With a broadband detector, the J200Tandem can capture LIBS spectrafrom 190 to 1040 nm simultaneouslvwith each laser pulse. Figure 3 dis-plays the elemental maps for C, H,Ti, and Sr by LIBS. The LIBS signalfor Ti and Sr support the maps pre-sented in Figure 2. LIBS offers theunique capability of detecting the Hsignal from the ink, something that isnot possible using the ICP-MS, alone The J200 Tandem can integrate botha broadband CCD and scanning- Figure 4. LIBS elemental map based on Sr signalobtained from the J200 (ICCD detector). Ti 334C 247 H 656Sr 407 Figure 3. LIBS elemental maps based on C, H, Ti, and Sr signals obtained from the J200 (CCD detector) type ICCD detector. Figure 4 shows the Sr response from the moresensitive ICCD detector. The ICCD detector provides increased sensitiv-ity, as compared to the CCD detector, and can scan different spectralregions, depending on the choice of grating, to investigate specificelements with higher detection sensitivity. Regardless of the detectoroption used for LIBS, the Sr response is not homogenous in the logo(LIBS or LA-ICP-MS maps) that was analyzed. Both LIBS detector con-figurations gave valuable information about the sample, with regards tothis element. Combining LA-ICP-MS and LIBS using ASI’s J200 Tandem instrument provides a simultaneous solution forelemental mapping of any given sample. The printed logo sample had detectable amounts of Sr, Ti, C,andH. The business card paper had high levels of Mg and Al detected, however these elements were not foundin the red ink. This mapping method can be applied to any sample with the same level of success. The DataAnalysis package offered by Applied Spectra makes data processing and the creation of elemental mapseasy and efficient. APPLIED SPECTRAwww.AppliedSpectra.comTransforming the way the world does chemistry Applied Spectra, Inc.APPLIEDSPECTRATelephone: +ax: +ales Support: +xFremont Blvd.Transforming the way the world does chemistry 初步分析表明,Mg、Al、Ti、Sr是本实验LA-ICP-MS部分监测的元素。图2显示了Mg、Al、Ti和Sr的元素分布图。在纸上,Mg的信号比红墨水高。然而,根据在样本边缘检测到的Mg信号,在边缘处的墨水的厚度似乎比中心要薄。显然,Al的只来源于纸张,标识上的红墨水并没有检测到Al。而典型的着色元素,如Ti和Sr,则在红色墨水处表现出强烈的信号,但在纸上没有被检测到。用LIBS补充LA-ICP-MS提供了同时检测所有元素的能力,即使是用ICP-MS难以或不可能检测的元素(例如C和H)。图3显示了由LIBS表示的C、H、Ti和Sr的元素分布图。图2中所示的元素分布图对应Ti和Sr的LIBS信号。此外,LIBS提供了检测墨水中H信号的独特能力,这是仅仅依靠ICP-MS无法做到的。
关闭-
1/4
-
2/4
还剩2页未读,是否继续阅读?
继续免费阅读全文产品配置单
北京富尔邦科技发展有限责任公司为您提供《油墨中元素及元素分布检测方案(激光诱导击穿)》,该方案主要用于印刷中元素及元素分布检测,参考标准《暂无》,《油墨中元素及元素分布检测方案(激光诱导击穿)》用到的仪器有美国ASI 激光剥蚀—激光诱导击穿光谱复合系统。
我要纠错
推荐专场
相关方案
 咨询
咨询