方案详情文
智能文字提取功能测试中
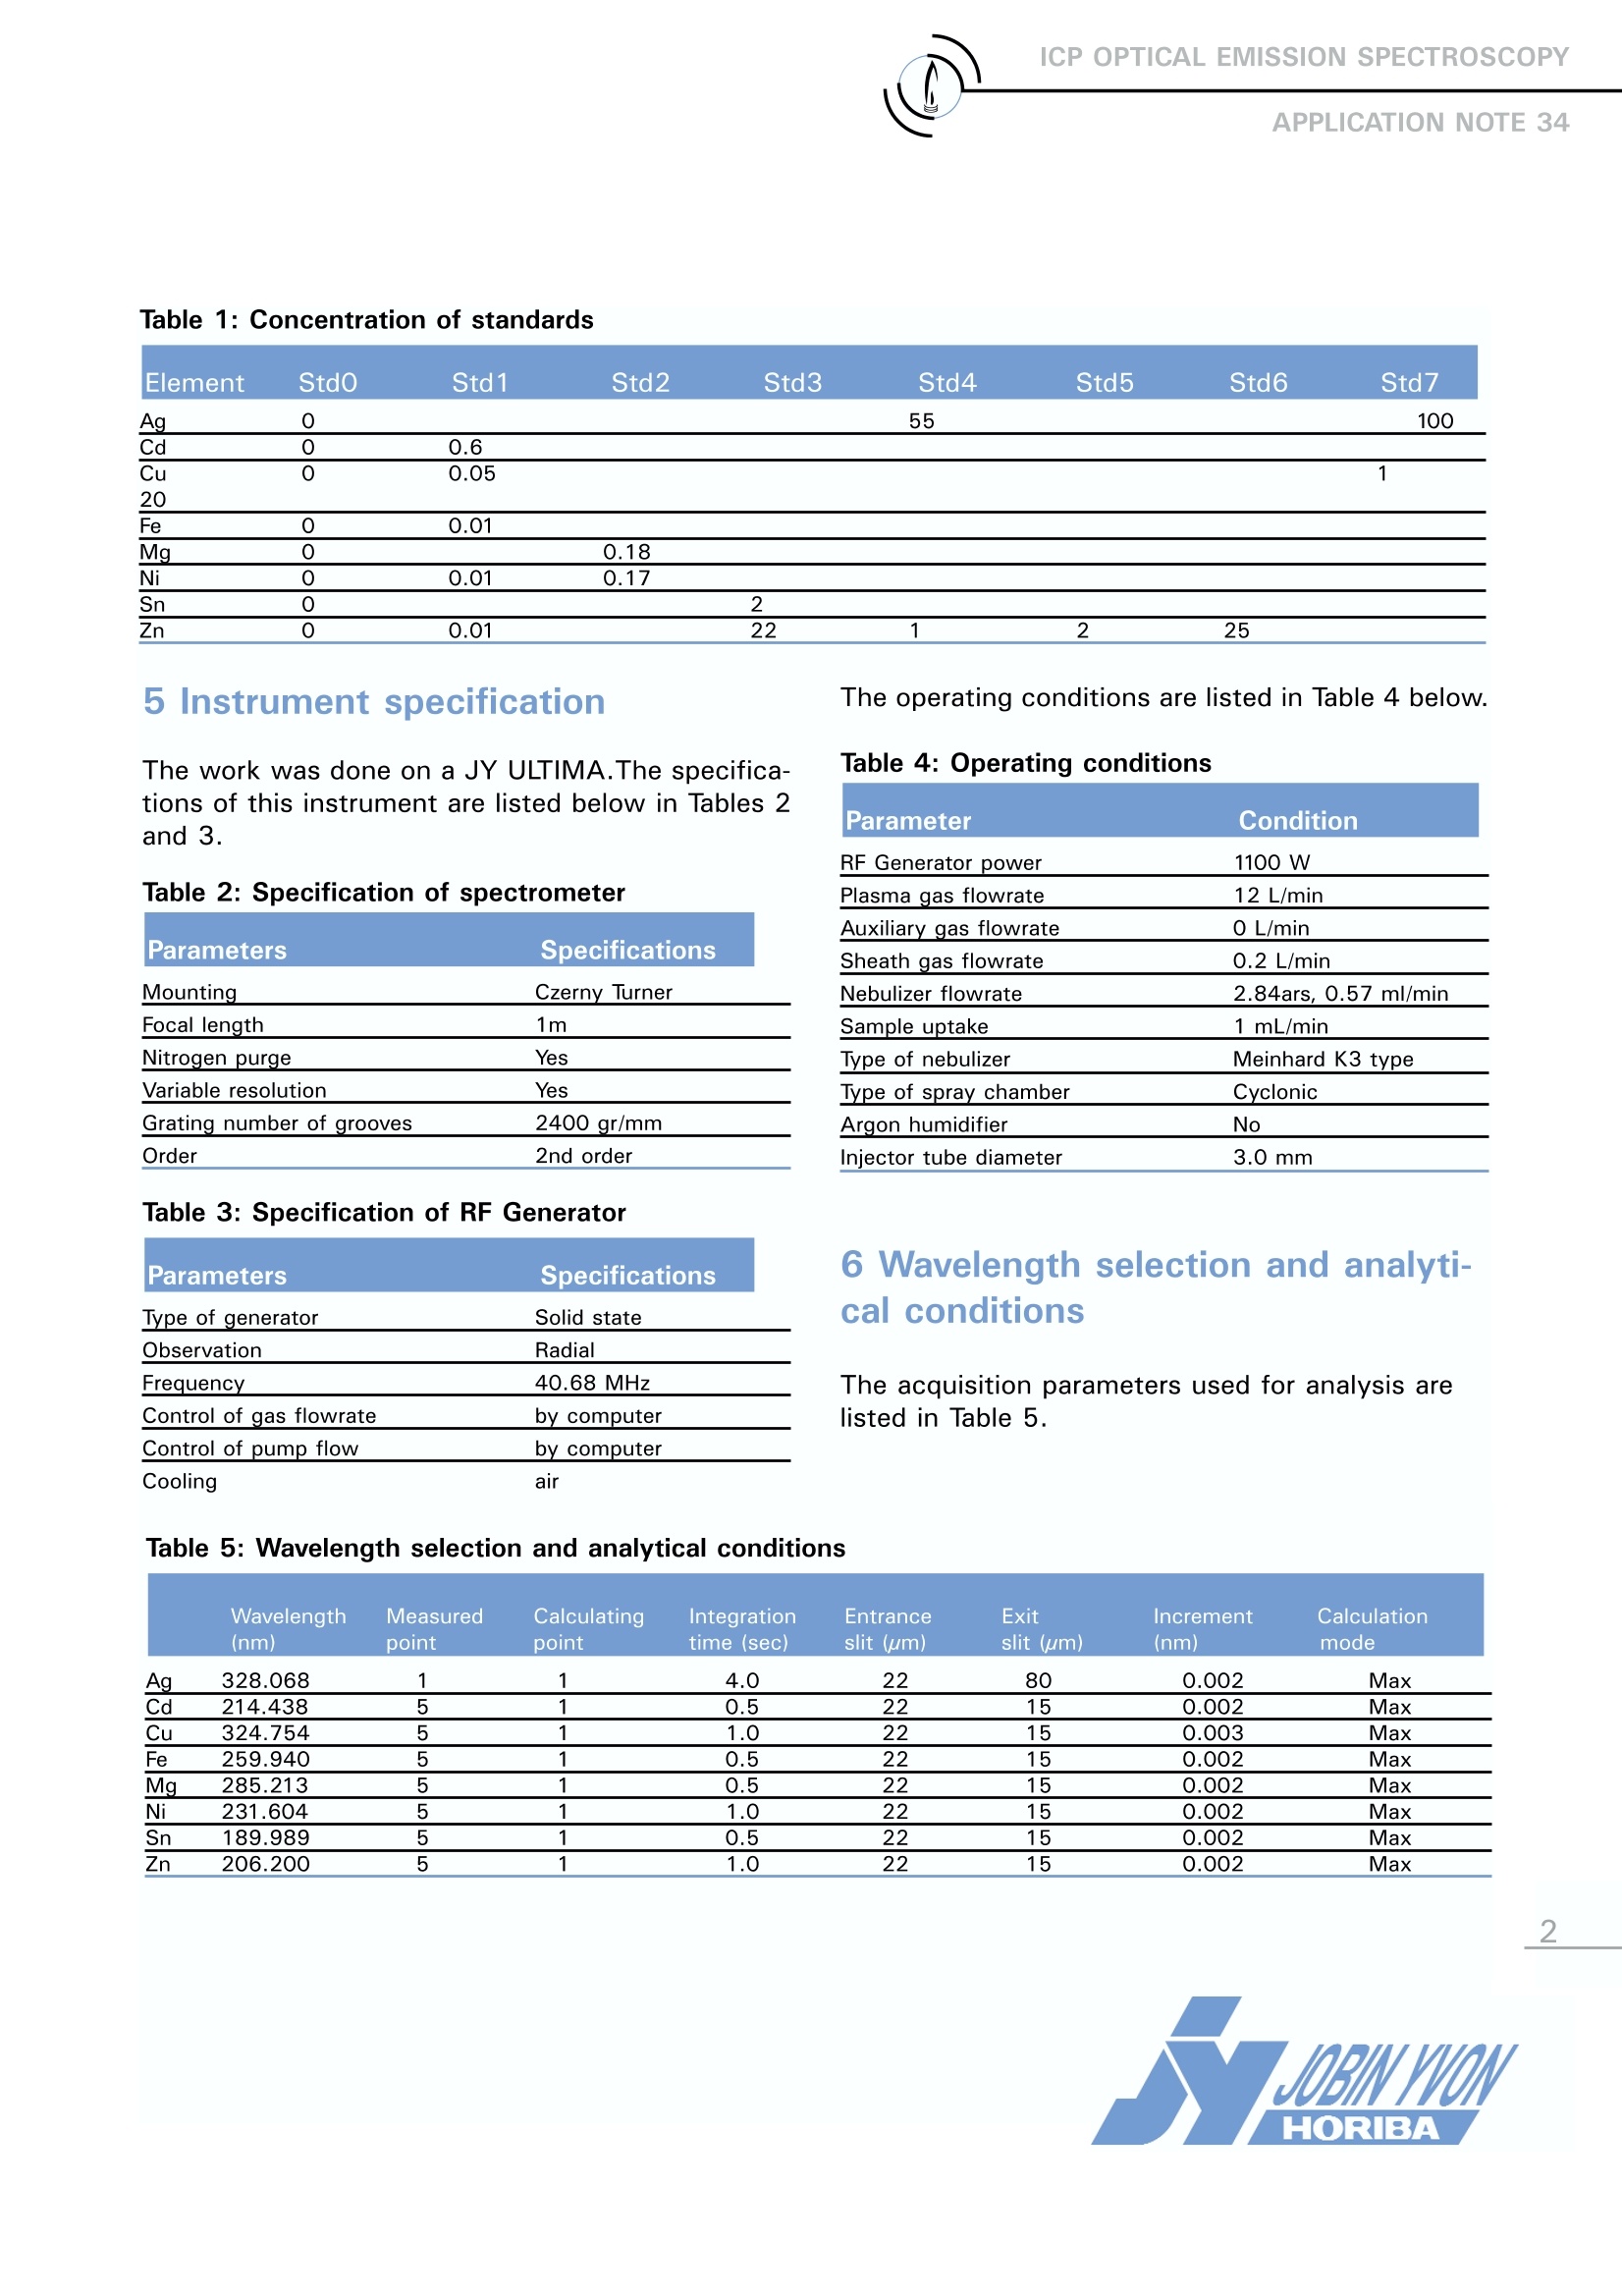
|CP OPTICAL EMISSION SPECTROSCOPYAPPLICATION NOTE 34 Analysis of Silver: Analysis of Ag, Dopants and Impurities Agnes Cosnier Jobin Yvon S.A.S., Horiba Group Longjumeau, France Keywords: silver In electronics, silver alloys are used because oftheir conductive, mechanic and contact proper-ties. These properties are improved by treatmentof silver withdifferent metallic oxides.ThisApplication Note examines the analysis of Ag andmetal oxides, with impurities such as Cd, Cu, Fe,Mg Ni, Sn and Zn. 2 Principle 2.1 Technique used The elemental analysis of solutions was under-taken by Inductively Coupled Plasma OpticalEmission Spectrometry (ICP-OES). The sample isnebulized then transferred to an argon plasma. Itis decomposed, atomized and ionized wherebythe atoms and ions are excited. We measure theintensity of the light emitted when the atoms orions return to lower levels of energy.日Each ele-ment emits light at characteristic wavelengthsand these lines can be used for quantitativeanalysis after a calibration. 2.2 Wavelength choice The choice of the wavelength in a given matrixcan be made using the "profile" function, or byusing Win-IMAGE, which is rapid semi-quantita-tive analysis mode using multiple wavelengths.The principle is the same in either case: recordthe scans of analytes at low concentration, andof the matrix. By superimposing the spectra, wesee possible interferences. 3 Sample Preparation The samples were prepared at 1 g/L or 2 g/L ofAg by dissolving with 68% HNO3 and diluting togive a final concentration of HNO3 is about 1.5%.The standards were prepared using Spexstandard single element solutions and deionizedwater. Matrix matching was not required, and wewere able to analyze both major elements andtraces using a simple calibration. 4 Calibration and analysis mode The solutions used for calibration are listed inTable1(mg/L). A weighted regression wasapplied for the Cu and Zn calibration curves. The diluted samples were analyzed directly.The"100 % analytical mode"was used for the analy-sis, meaning that the sum of all the analyzed ele-ments is assumed to be 100%. If the results donot add up to 100%, an adjustment is made overall the measured elements. This type of methodimproves the accuracy of such analyses, by com-pensating for any small drift that may occur overa period of time. The results are given in Section7 and are reported as % in the solid after cor-recting for the weight, volume and dilution fac-tors. (*): SpexCertiprep www.certiprep.com Table 1: Concentration of standards Ag_ 0 55 100 Cd 0 0.6 Cu 0 0.05 1 20 Fe 0 0.01 Mg 0 0.18 Ni 0 0.01 0.17 Sn 0 2 5 Instrument specification The work was done on a JY ULTIMA.The specifica-tions of this instrument are listed below in Tables 2and 3. Table 2: Specification of spectrometer Parameters Specifications Mounting Czerny Turner Focal length 1m Nitrogen purge Yes Variable resolution Yes Grating number of grooves 2400 gr/mm Order 2nd order Table 3: Specification of RF Generator Parameters Specifications Type of generator Solid state Observation Radial Frequency 40.68 MHz Control of gas flowrate by computer Control of pump flow by computer Table 5: Wavelength selection and analytical conditions The operating conditions are listed in Table 4 below. Table 4: Operating conditions Parameter Condition RF Generator power 1100 W Plasma gas flowrate 12 L/min Auxiliary gas flowrate 0 L/min Sheath gas flowrate 0.2 L/min Nebulizer flowrate 2.84ars, 0.57 ml/min Sample uptake 1 mL/min Type of nebulizer Meinhard K3 type Type of spray chamber Cyclonic Argon humidifier No Injector tube diameter 3.0 mm 6 Wavelength selection and analyti-cal conditions The acquisition parameters used for analysis arelisted in Table 5. Wavelength Measured Calculating Integration Entrance Exit increment Calculation (nm) point point time (sec) slit (um) slit (um) (nm) mode Ag 328.068 1 1 4.0 22 80 0.002 Max Cd 214.438 5 1 0.5 22 15 0.002 Max Cu 324.754 5 1 1.0 22 15 0.003 Max Fe 259.940 5 1 0.5 22 15 0.002 Max Mg 285.213 5 1 0.5 22 15 0.002 Max Ni 231.604 5 1 1.0 22 15 0.002 Max Sn 189.989 5 1 0.5 22 15 0.002 Max Zn 206.200 5 1 1.0 22 15 0.002 Max Six samples were analyzed and the results werecompared to those obtained in the quality controllaboratory. The results show the feasibility of the analysis ofSilver alloys by using a high resolution ICP-OESinstrument. Results were close to the ones expect-ed, even with the high dilution factors, due to thehigh sensitivity and stability of the JY ULTIMA 2spectrometer. Precision would be further improvedby the use of a simultaneous internal standard usingthe optional internal standard monochromator avail-able from JY. This enables simultaneous measure-ment of both analyte and internal standard. Element Sample 1 Sample 2 Sample 3 0.105 g; 50 mL 0.1132 g;100 mL 0.11078 g; 50 mL; 20 fold dilution 10 fold dilution 20 fold dilution Conc RSD Expected Conc RSD Expected Conc RSD Expected (%) (%) conc (%) (%) (%) conc (%) (%) (%) conc (%) Ag 99.18 0.58 99.33 91.18 0.37 90.6 99.63 0.29 99.86 Cd 0.665 0.44 0.61 8.46 1.9 9.1 0.0401 0.18 Cu 0.071 1.3 0.055 0.0674 1.15 0.05 0.0285 1.55 Fe 0.236 2.45 0.014 4.48 0.125 0.86 Mg 0.002075.08 0.00446 6.48 0.00199 7.93 Ni 0.0112 2.9 0.0024 0.224 0.52 0.195 0.148 0.35 0.13 Sn < LD
-
1/3
-
2/3
还剩1页未读,是否继续阅读?
继续免费阅读全文产品配置单

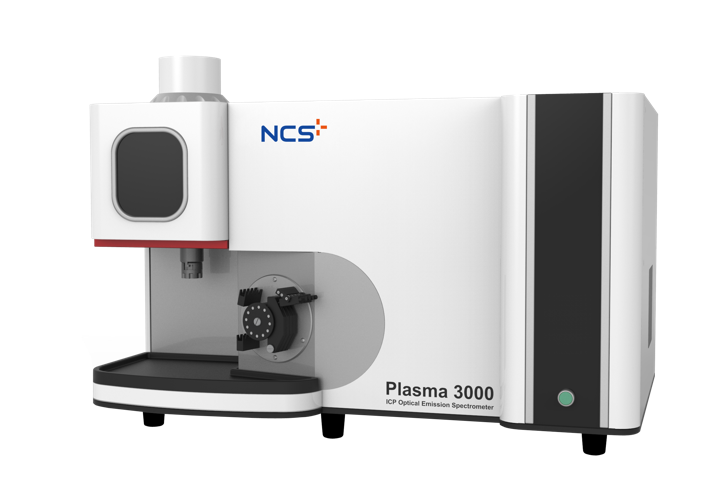
HORIBA(中国)为您提供《采用ICP方法分析银掺杂物及杂质》,该方案主要用于纯金属中null检测,参考标准《暂无》,《采用ICP方法分析银掺杂物及杂质》用到的仪器有HORIBA Ultima Expert高性能ICP光谱仪。
我要纠错
推荐专场
相关方案
 咨询
咨询