

方案详情文
智能文字提取功能测试中
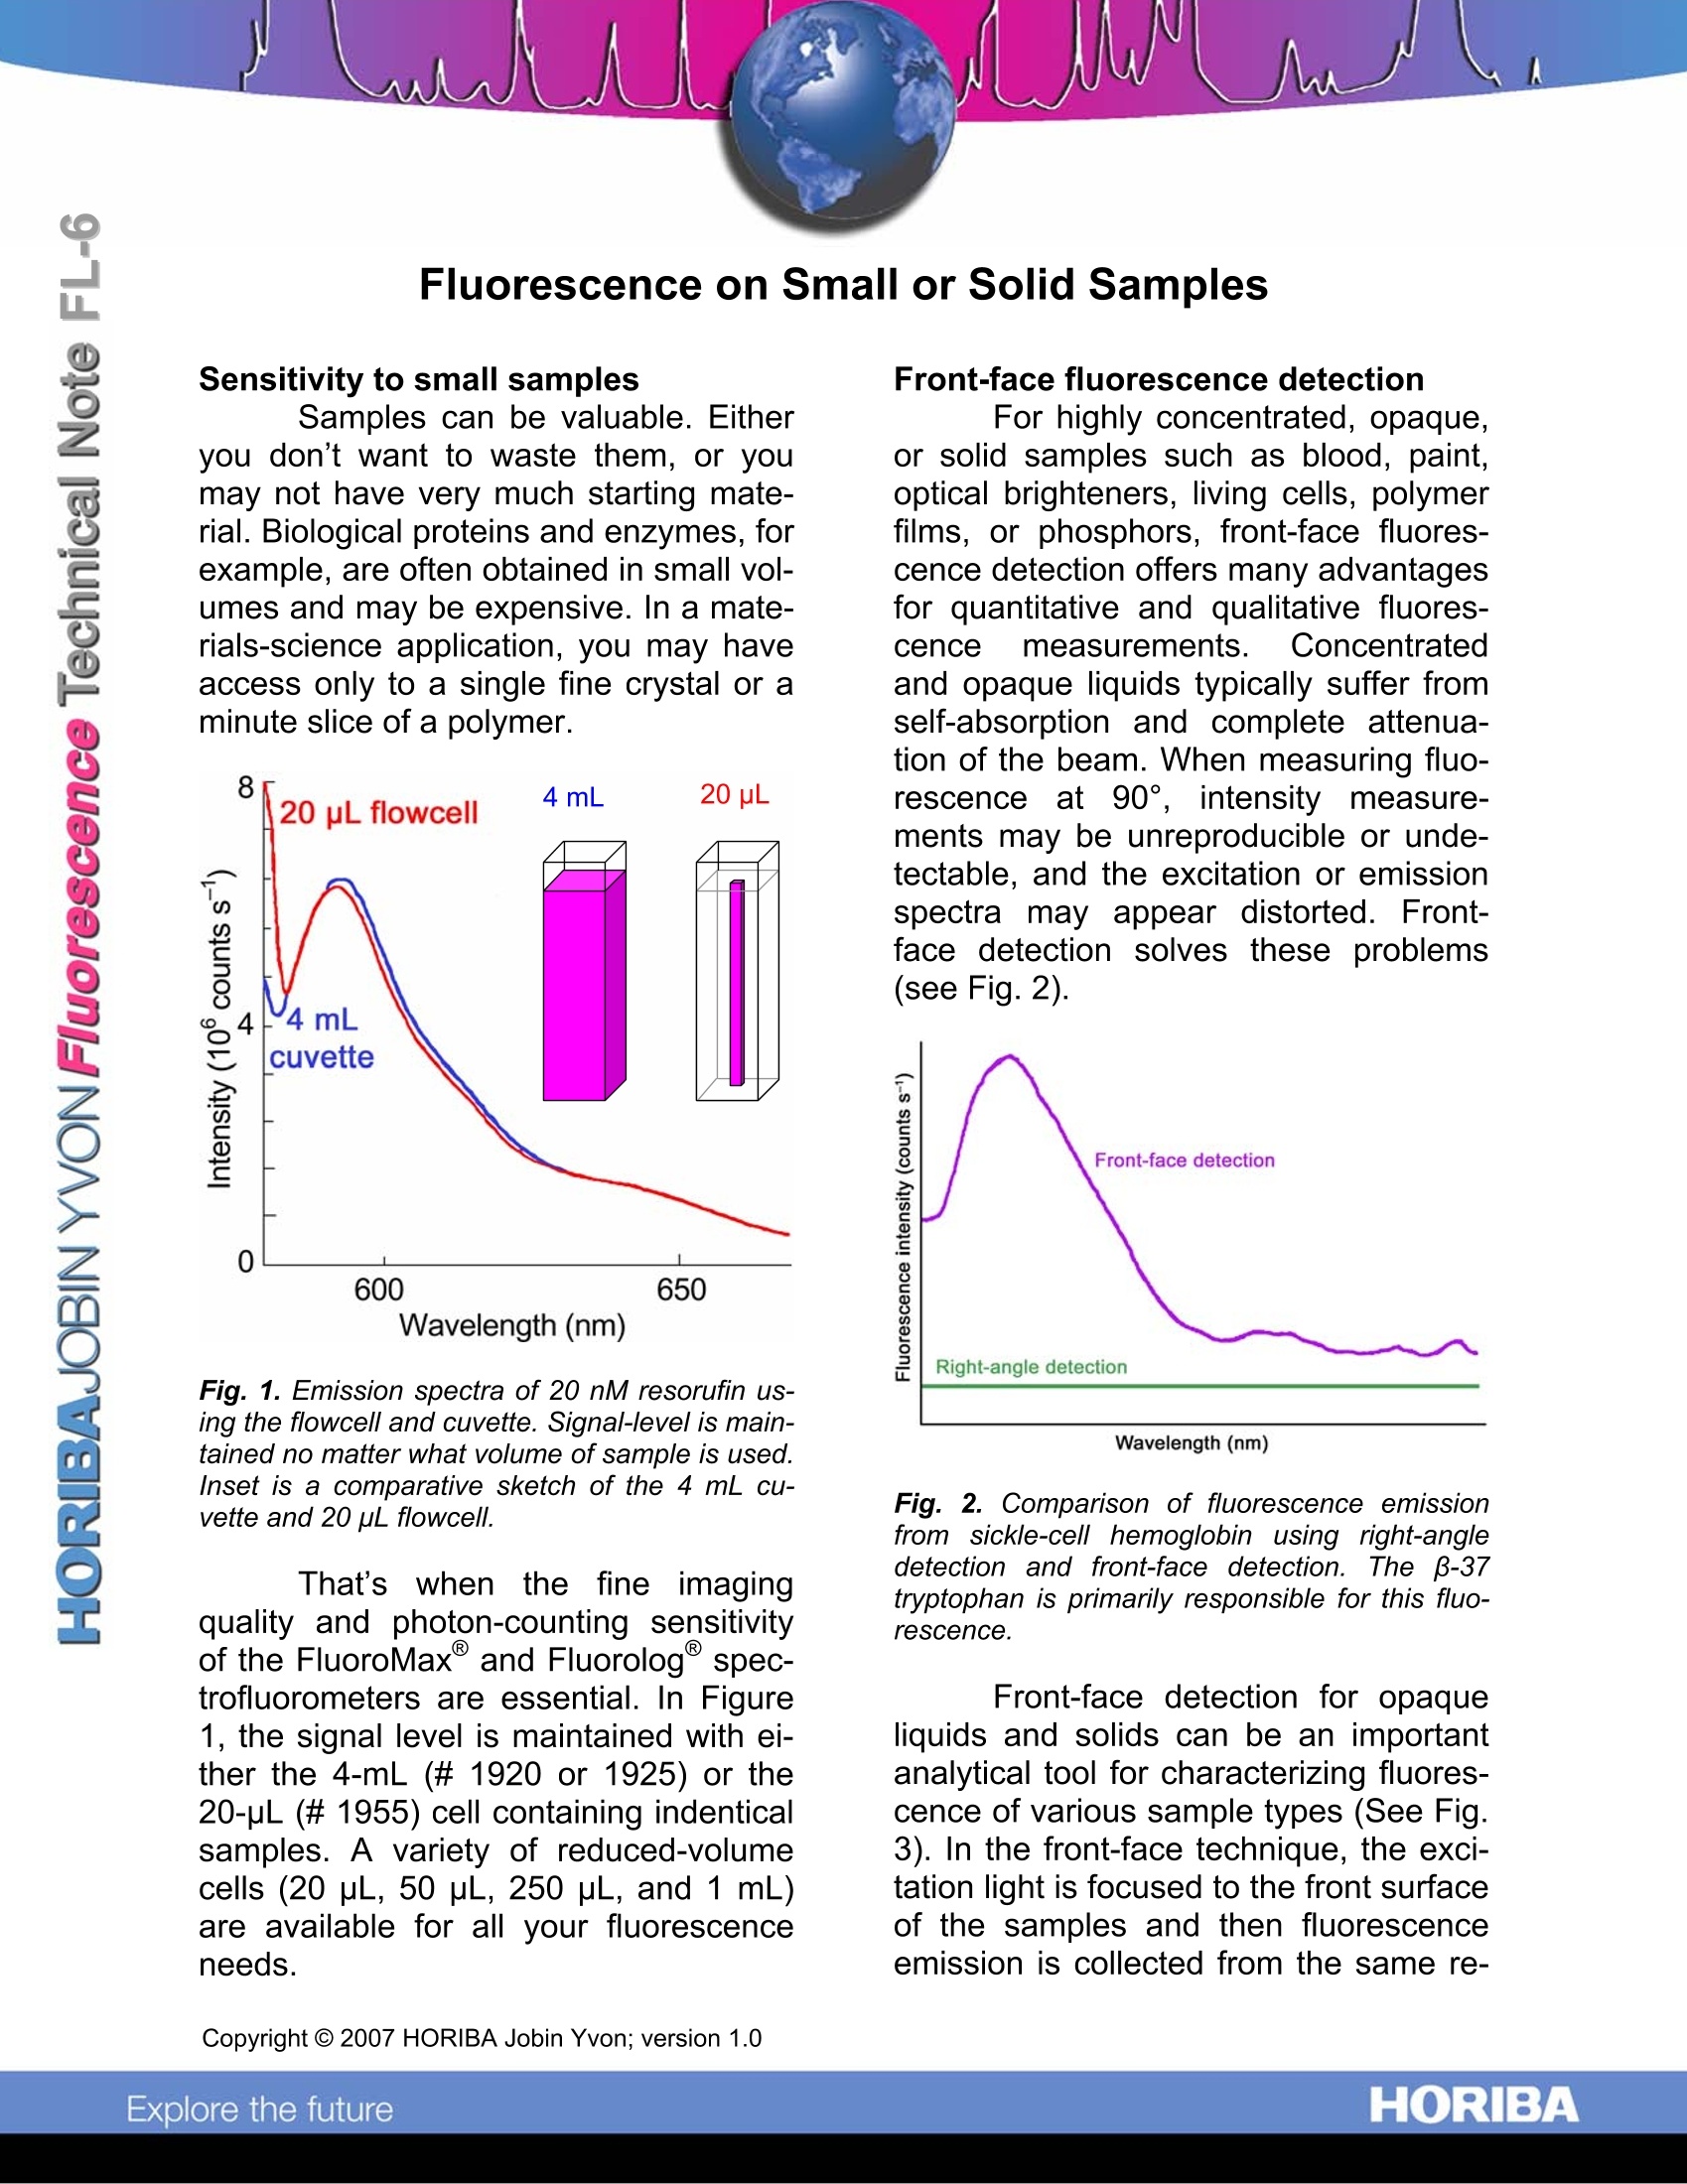
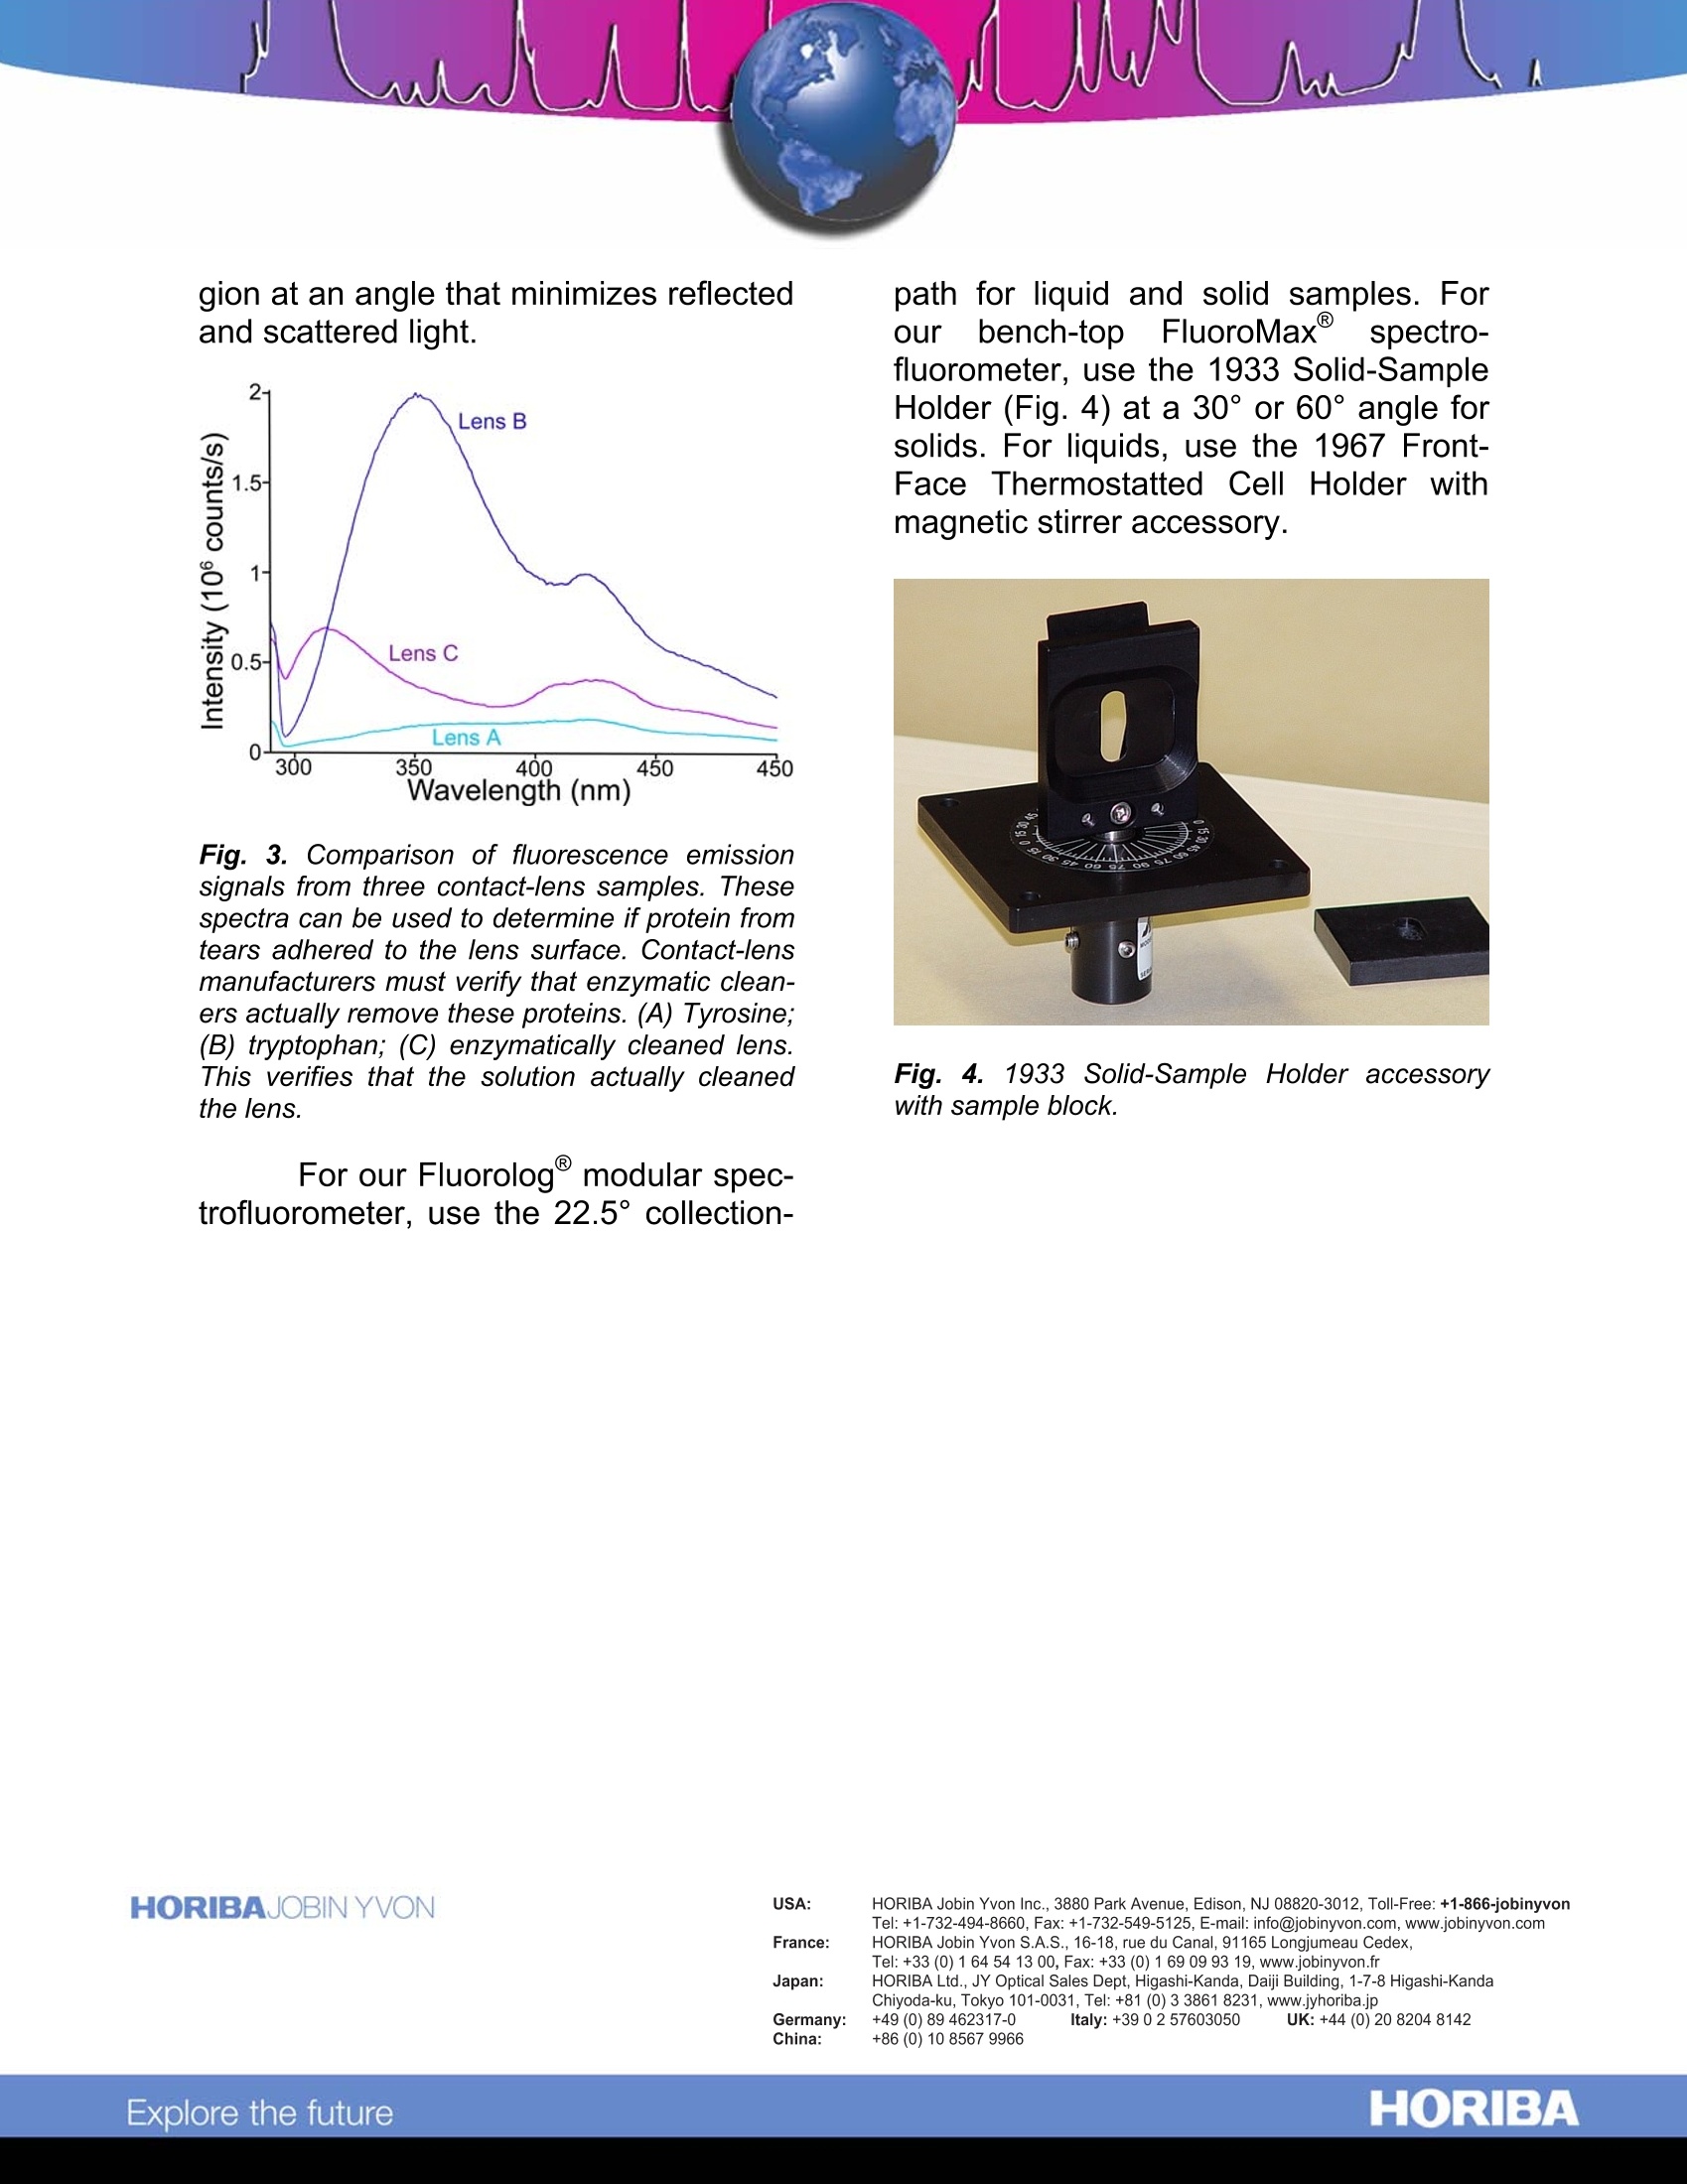
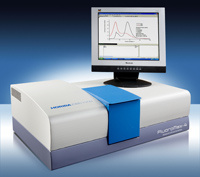
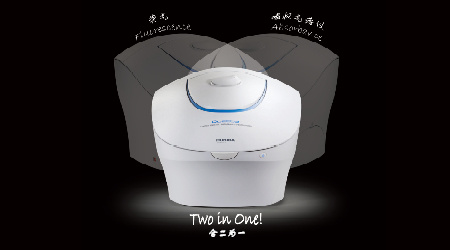
Fluorescence on Small or Solid Samples Sensitivity to small samples Samples can be valuable. Eitheryou don’t want to waste them, or youmay not have very much starting mate-rial. Biological proteins and enzymes, forexample, are often obtained in small vol-umes and may be expensive. In a mate-rials-science application, you may haveaccess only to a single fine crystal or aminute slice of a polymer. Fig. 1. Emission spectra of 20 nM resorufin us-ing the flowcell and cuvette. Signal-level is main-tained no matter what volume of sample is used.lnset is a comparative sketch of the 4 mL cu-vette and 20 pL flowcell. That'swhen the fine imagingquality and photon-counting sensitivityof the FluoroMax and Fluorolog@ spec-trofluorometers are essential. In Figure1, the signal level is maintained with ei-ther the 4-mL (#1920 or 1925) or the20-pL(#1955) cell containing indenticalsamples. A variety of reduced-volumecells (20 pL, 50 pL, 250 pL, and 1 mL)are available for all your fluorescenceneeds. Front-face fluorescence detection For highly concentrated, opaque,or solid samples such as blood, paint,optical brighteners, living cells, polymerfilms, or phosphors, front-face fluores-cence detection offers many advantagesfor quantitative and qualitative fluores-cence measurements.Concentratedand opaque liquids typically suffer fromself-absorption and complete attenua-tion of the beam. When measuring fluo-rescence at 90°, intensity measure-ments may be unreproducible or unde-tectable, and the excitation or emissionspectra may appear distorted. Front-face detection solves these problems(see Fig.2). Fig. 2. Comparison of fluorescence emissionfrom sickle-cell hemoglobin using right-angledetection and front-face detection. The B-37tryptophan is primarily responsible for this fluo-rescence. Front-face detection for opaqueliquids and solids can be an importantanalytical tool for characterizing fluores-cence of various sample types (See Fig.3). In the front-face technique, the exci-tation light is focused to the front surfaceof the samples and then fluorescenceemission is collected from the same re- gion at an angle that minimizes reflectedand scattered light. Fig. 3. Comparison of fluorescence emissionsignals from three contact-lens samples. Thesespectra can be used to determine if protein fromtears adhered to the lens surface. Contact-lensmanufacturers must verify that enzymatic clean-ers actually remove these proteins. (A) Tyrosine;(B) tryptophan; (C) enzymatically cleaned lens.This verifies that the solution actually cleanedthe lens. For our Fluorolog@ modular spec-trofluorometer, use the 22.5°collection- path for liquid and solid samples. Forourbench-top FluoroMaxspectro-fluorometer, use the 1933 Solid-SampleHolder (Fig. 4) at a 30°or 60° angle forsolids. For liquids, use the 1967 Front-Face Thermostatted Cell Holder withmagnetic stirrer accessory. Fig. 4. 1933 Solid-Sample Holder accessorywith sample block. Copyright C HORIBA Jobin Yvon; version .HORIBAExplore the future HORIBAJOBIN YVONChina: +() ORIBAExplore the future
关闭-
1/2
-
2/2
产品配置单
天津东方科捷科技有限公司为您提供《微量样品和固体样品的荧光测量》,该方案主要用于其他中含量测定检测,参考标准《暂无》,《微量样品和固体样品的荧光测量》用到的仪器有HORIBA 科研级荧光光谱仪 FluoroMax+。
我要纠错
推荐专场
相关方案
 咨询
咨询