

方案详情文
智能文字提取功能测试中
INTERNATIONAL JOURNAL OF ENERGY RESEARCHInt. J. Energy Res. 2007; 31:1237-1250Published online 20 June 2007 in Wiley InterScience(www.interscience.wiley.com) DOI: 10.1002/er.1331 1238G. SKODRAS ET AL. Combustion and environmental performance ofclean coal end products G.Skodras1.2,3, E. Someus4*,t, P. Grammelis, A. Palladas’, P. Amarantos',P. Basinas, P. Natas, M. Prokopidou, I. Diamantopoulou,E. Kakaras and G. P. Sakellaropoulos1.2,3 Institute for Solid Fuel Technology and Applications/Centre for Research & Technology Hellas, P.O.1520,54006, Thessaloniki, Greece Chemical Process Engineering Laboratory, Chemical Engineering Department, Aristotle University of Thessaloniki, Thessaloniki, Greece 3Laboratory of Solid Fuels and Environment, Chemical Process Engineering Research Institute, Thessalonik“3R Environmental Technologies Ltd., H-1222 Budapest, Szechenyi 59, Hungary SUMMARY Thermal desorption recycle-reduce-reuse technology (TDT-3R).) isiSbased on the low-temperaturecarbonization fuel pre-treatment principles. Clean coal samples were produced according to this methodin an indirectly heated rotary kiln and were examined for their combustion efficiency and environmentalperformance. Raw materiaInyl included coal and biomass, such as willow and straw. Investigations wererealized via on-site measurements both in the clean coal procurement and combustion facilities and thecharacterization of end products and by-products. Clean coals were proved to be less reactive than raw coal samples, while biomass chars increased thereactivity of fuel blends during combustion. In the clean coal production and combustion processes, fluegases emissions, such as CO, SO2, NOx, were particularly low, while polychlorinated dibenzo-p-dioxins anddibenzofuran emissions were in an order of magnitude less than anticipated from the EU legislation.Reduced total CO2 emissions are anticipated with the implementation of TDT-3R process compared to theconventional combustion of raw fuels. All ash leachates were accepted by the EPA-TCLP test, since noneof them exceeded the EPA limits for safe disposal. The mercury content of all samples was very low andwas reduced by about 90% after the leaching treatment. The pilot scale combustion tests demonstrated themajor advantage offered by the TDT-3R process, which is the production of clean fuels with much lowerpollutants content. High added value commercial application of the technology is feasible, provided thatthe ash content of raw fuel does not exceed 20% w/w. It is expected that the employment of produced cleancoal originating from high-grade coal in combination with biomass derived materials may result in almostzero emission power plant operation. Copyright C 2007 John Wiley & Sons, Ltd. KEY WORDS: low-temperature carbonization; TDT-3R; CO2 reduction; heavy metals; dioxins; furans ( *Correspondence to: Edward S omeus,3R Environmental Technologies Ltd., H-1222 Budapest, Szechenyi 59, Hungary. ' E -mail: edward@te r renum.net, ht t p://www.terrenum.net/cleancoal ) ( Contract/grant sponsor: European Commission (EC) ) 11. INTRODUCTION In order to achieve sustainable and sound economic development, there is a strong demand forextended clean power production which is affordable by cost, utilizes existing coal-fired plantsand large quantities of renewables, while offering high level of process safety and comprehensivelong-term management of all residual operation streams. Since regional utilization of theavailable biomass in power or combined heat and power production is often not cost effective asstand-alone installations, new patterns need to be developed combining low cost and calorificvalue domestic fuels, such as low-grade coal and biomass. However, the utilization of these fuelsentails the risk of severe environmental impact due to their content in polluting compounds, i.e.N, S, Hg, Cl, etc. Therefore, such combinations are subjected to significant improvements inoverall environmental performances of solid fuel utilization, including improvements ongreenhouse gas emissions (Antal et al., 2003; Braden et al., 2001). During the past decade, several clean coal technologies have been developed as end of pipe’solutions, such as gasification, the integrated gasification combined-cycle systems for large-scaleuse well over 150MWe net capacity, and the flue gas desulphurization. In order to meet thenew environmental norms, the end-of-pipe’technologies have increased their complexity,resulting in increased cost. However, it seems that their technical complexity cannot be furtherincreased and therefore that they have reached their ultimate limits, while new environmentalrestrictionss and international conventions, such asthe Kyoto protocol, require moreefforts (Liao et al., 1998). An alternative option that continuously attracts R&D interest isfuel pre-treatment. Among various available technologies for clean energy production, thelow-temperature carbonization (LTC) fuel pre-treatment technology is looking promising forfuture implementations. The thermal desorption recycle-reduce-reuse technology (TDT-3R) isbased on LTC principles and is essentially a process for producing cleansed fuels from coaland other carbonaceousSmaterial. such asbiomassS(Someus, 2006). Past R&D project(CERTH/ISFTA, 2005) has established the concept’s viability, since it results in a value addedtechnology that converts widely available low-grade domestic fuels to high-grade fuels, whileremoving hazardous air pollutants, such as sulphur, chlorine and mercury, which can beseparately treated or recycled. The integrated application is primarily designed for small-scalepower plants of less than 50MW capacity and cogeneration options, and for medium-scaleplants with less than 300 MW power capacity, as well. It is also worth mentioning that accordingto energy calculations, the incorporation of the TDT-3R process in a medium-sized powerplant may bring about a 2% efficiency gain in electricity generation.+ An electric efficiency of32% in a raw brown coal-fired power plant will be increase1111d to 34% if clean coal is used.These calculations are based on the assumption that the rotary kiln reactor operates with95% efficiency, clean coal consumption equals to 100t/h, boiler efficiency is 0.92, and 46%of the steam energy is converted to electricity of which one-fifth is needed for various electricauxiliaries. In this work, the combustion efficiency and the environmental performance of the TDT-3Rprocess are investigated via pilot-scale tests of clean fuel production and of their subsequentcombustion, which were performed in order to demonstrate the operational feasibility of theprocess. Tests included flue gas emissions monitoring, raw fuel and product characterizationand thermogravimetric tests, polychlorinated dibenzo-p-dioxins and dibenzofuran (PCDD/F)and heavy metals analyses, and toxicity tests. Raw material included coal and biomass, such aswillow, straw, and demolition wood. 2. EXPERIMENTAL 2.1. Clean fuel production TDT-3R pilot plant has been built and tested under semi-industrial conditions at Polgardi, inHungary, during 2005. The installation consists of a horizontally arranged rotary kiln, a gas-vapour post-burner, a multi-venturi off-gas treatment scrubber,and a carbon heat exchanger.The kiln is heated externally and raw material is carbonized and decomposed into char and gas-vapours in a reductive environment, under less than 850°℃ material core temperature andvacuum conditions. Volatile HAPs are removed from the solid feedstock by thermal desorptionand are combusted in the post burner at 850°C, while the carbonized ‘Clean Coal'end productcan be utilized as an upgraded clean fuel in power plants with capacities up to 300MW.A detailed description of the process is given elsewhere (CERTH/ISFTA, 2005). In this work,results obtained from tests of four representative raw fuels are presented, specifically of coalfrom two mines, the Rakoczi mine and the Lencshegy mine, of the corresponding clean coals, aswell as of two demolition wood produced chars. Tests included flue gas emissions monitoring,raw fuel and product characterization, and thermogravimetric tests. 2.2. Clean fuel combustion tests Combustion tests of raw coal, clean fuels produced by the TDT-3R process and blends,including clean coal and raw or clean biomass fuels, were performed in a combustion unit at theTechnical University of Dresden Facilities, Germany. The utilized pilot-scale installationincluded a pulverized coal combustion unit with a down-shot burner and a maximum thermaloutput of approximately 75 kW, Figure 1.The vertical cylindrical combustion chamber (290 mmdiameter) had air-cooled walls and was insulated with a refractory lining. The down-shot burnerwas designed as a twist burner with twisted boundary surface air. The primary air-fuel mixtureentered through the central pipe into the combustion chamber, while the twisted secondary airwas preheated to 200-350℃. The main goals were to demonstrate produced clean fuelcombustion that presents minimum pollutants emissions and to obtain usefulCOm informationregarding the combustion chamber optimization. Tests included assessing the emissionscharacteristics of the combustion unit, regarding gas pollutants and toxic emissions, and thecharacterization and thermogravimetric analysis of samples collected in order to investigatepyrolysis and combustion behaviour of the specific fuels and their blends. 2.3. Methods and means The collection, treatment, and proximate analysis of fuel samples were performed according toASTM standard analytical methods. A ThermoFinnigan Flash EA 1112 CHNS analyser wasused for the ultimate analysis. Samples behaviour under pyrolysis and combustion conditionswas also investigated by thermogravimetry in order to obtain the fingerprint of the fuels andtheir blends. Experiments were performed in a non-isothermal thermogravimetric analyser (TAQ600) where the sample weight loss and the rate of weight loss were continuously recordedunder dynamic conditions, as functions of time or temperature, in the range of 30-1000℃. Contained ash in fuels and ash samples collected during combustion tests were undertakentoxicity tests in order to estimate the potential environmental impact of their disposal. Thestandard toxicity characteristic leaching procedure (TCLP) method according to EPA Method Figure 1. Flow diagram of the combustion unit. 1311 was applied to the solid samples to determine the potential leachability of their traceelements (U.S. Environmental Protection Agency, 1992). The chemical composition of ashleachates was determined by a Perkin-Elmer Inductively Coupled Plasma-Atomic EmissionSpectroscopy spectrophotometer, while the determination of total contained mercury required adifferent extraction protocol to be followed, because of its high volatility. Therefore, itsquantificationwas made using a cold vapour atomic absorption spectrometer (AAS,LabAnalyzer 254, Mercury Instruments, GmBh) (U.S. Environmental Protection Agency,1994). The toxicity of the liquid samples collected from the TCLP leaching test was evaluatedusing the bioluminescence bacteria Vibrio fischeri (Microtox test). The tests were performedusing the Microtox 500 analyser, while the toxic effect of the leachates on V. fischeri wasevaluated following the 82% screening test protocol (Microbics Corporation, 1992). During clean fuel production and combustion tests, conventional flue gas emissions, such asCO, CO2,SO2,NO, were measured on-line with a MADUR GA-40T plus flue gas analyser, whilesamples for PCDD/Fs analyses were collected by a TECORA isokinetic sampling device. The...analysis of the samples for the determinations of the PCDD/Fcontent of the flue gases was madein high-resolution GC/MS and the toxicity equivalency factor of all the isomers was estimated. 3. RESULTS AND DISCUSSION 3.1. Clean fuel production The average quality characteristics ofthe samples are given in Table I. According to the results,clean coals exhibit reduced moisture content, especially the Rakoczi mine ones, while biomass chars moisture is quite low. Volatile matter also decreased during clean fuel production, whilefixed carbon is increased with biomass chars presenting very high values up to 74.6%. Ashcontent is generally increased. Ultimate analysis illustrates that carbon content of clean fuelsincrease and hydrogen,nitrogen, and sulphur content decrease. The calorific value of the cleancoal samples varied from about 14.7 to 17.5MJkg, while the heating value of biomass charswas around 29.3MJkg. The main combustion characteristics established from the thermogravimetric analysisof the samples are summarized in Table II. The TG (weight loss) and DTG (weight loss rate)curves of all raw fuels and chars are given in Figure 2(a)-(f). The shape of the TGA/DTGcurves indicates that combustion in air proceeds in a different way for the various samples.Lower combustion rates and total conversions are observed for the Lencshegy chars comparedto the Rakoczi ones. DTG curves indicate also that the maximum peaks of the Rakoczi raw Table I. Proximate and ultimate analysis of the raw and clean fuel samples. Sample Rakoczi mine Lencshegy mine Demolition wood Analysis Raw coal Clean coal Raw coal Clean coal Char 1 Char 2 Proximate analysis (% w/w as received) Moisture 14.50 2.00 8.00 2.00 6.70 6.10 Volatiles 21.60 17.5 38.20 20.28 13.95 20.54 Fixed carbon 19.86 21.23 10.21 35.02 74.59 70.15 Ash 44.04 59.25 43.59 42.70 4.76 3.21 Ultimate analysis (%w/w dry) C 32.95 37.31 42.81 44.37 78.79 83.19 H 2.90 1.28 3.23 1.42 2.07 2.15 N 0.87 0.83 1.18 1.02 0.25 0.43 S 0.90 0.69 4.22 2.15 0.00 0.00 cl (ppm) 150.50 93.70 84.30 86.30 135.10 111.30 Hg (ugg-1) 0.22 0.22 0.32 0.04 0.03 0.04 O (by subtr.) 10.87 0.02 1.18 7.47 13.79 10.81 Heating value (MJkg) 15.6 14.7 19.8 17.5 30.1 31.7 Table II. Combustion characteristics of the fuels. Initial combustion Max combustion Temperature at max Combustion Total conv. Sample temperature (C) rate (min-10-2) combustion rate(C) time (min) (%w/w) Rakoczi raw 254 6.2 487 31.34 42.1 Rakoczi clean 372 5.6 521 31.97 53.5 coal Lencshegy 300 6.2 541 37.43 63.6 raw Lencshegy 398 5.9 552 38.53 53.8 clean coal Demolition 343 8.3 527 33.85 93.0 wood char 1 Demolition 312 8.6 518 34.36 88.2 wood char 2 Figure 2. Non-isothermal combustion tests in the TGA of: (a) Rakoczi Raw sample 1;(b) Rakoczi CCSample 1;(c) Lencshegy Raw Sample 1; (d) Lencshegy CC Sample 1; (e) Demolition wood char 1; and(f) Demolition wood char 2 (medium: Air, heating rate: 20℃min). fuels and chars do not deviate significantly and the burn process is completed in almost thesame time. It is also worth noting that the combustion of the chars is completed at lowertime compared to the pure fuels, Table II. For all the wood chars DTG curves indicatethat combustion takes place between 350 and 600°C. This temperature region accountsfor the 96-98% of the total weight loss. It should be noted that the obtained DTG curvesfor the wood chars are quite different from the ones of the Rakoczi mine and resemble more to the corresponding curves of the Lencshegy samples. The combustion of the biomass charspresent two clear peaks. The first is considered to correspond to the volatiles evolution andcombustion. The second correspond to the remaining volatiles release and combustion and tothe combustion of the produced char. In general, results revealed that produced clean coal wasless reactive than the raw coal. Combustion tests exhibited higher initial combustiontemperature and lower total conversion in the case of clean coal, which may be mostlyattributed to the reduction of the volatile matter and increment of ash content during the cleancoal preparation stage. Conventional flue gas emissions, such as CO,CO2, SO2,NO, were measured in two samplingpoints at the TDT-3R pilot plant, in Polgardi. Sampling point 1 was at the chimney, andsampling point 2 was before the flue gas scrubber. In Figure 3(a) and (b), the values and thevariations of the emissions versus the time are shown, during the pyrolysis test of Rakoczi rawcoal. All values remained almost constant within a time interval of 1.5 h. The temperature atthat position was around 50℃. CO2 content of the flue gases varied between 6.2 and 6.5%. Theoxygen content at the chimney was 13.80%, while the humidity was very high, more than 91%.The temperature before the scrubber was around 110-120C. Gaseous pollutants values were alittle higher than those after the scrubber, while increased variations were observed. The CO2content was also higher, varying between 7 and 7.5%. All pollutants measured values werebelow the limits set by the legislation (2000/76/EC Directive). European Union accepts CO andNOx emissions in the order of magnitude of 50 and 200 ug m, respectively, for such units,while the average emissions of the specific pollutants in the pyrolysis plant were 20 and89 ug m-3,respectively. A major aspect of environmental concern is the CO2 emissions derived from fuel combustionor thermal treatment. Kyoto protocol is in force and all Annex I countries are obliged tomeetttheirr greenhousegasess emissionstargets. Implementations of technologies thatcan provide measurable results of reduced CO2 emissions are potential options for the powerutilities. The TDT-3R process can offer the benefit of clean fuels utilization for energyproduction. However, the process itself produces considerable CO2 amount. In order toevaluate this quantity, basic mass balance calculations based on on-site measurement valueshave been performed. Taking into account the geometry of the chimney and the averagevelocity of the flue gasesat the sampling point, average CO2 concentration at thesampling point, and the feed rate of the utilized raw coal, produced CO2 is calculated as0.54 kg kg- of feed. Such value is considered as reasonable in the case of coal thermal Figure 3. Emitted pollutants in the flue gas at: (a) position 1 (chimney) and (b) position 2 (scrubber inlet). treatment. The produced clean fuels contain higher carbon contents that result in higheroverall combustion efficiencies. Higher efficiencies in turn result in lower CO2 emissions,since less fuel is required in order to produce the same amount of heat or power.Therefore,the total amount of emitted CO2 isSlower than the one originating from raw fuelscombustion. Moreover, when biomass chars are utilized in combustion, possibly as secondaryfuels in coal-biomass fuel mixtures, the benefit regarding CO2 emissions is much greater,since it is commonly accepted that biomass is CO2 neutral fuel. Consequently, the TDT-3Rprocess offers an even greater advantage since it may produce clean fuels from both coal andbiomass raw fuels. In Table III the PCDD/F emissions during the pyrolysis process as well as the PCDD/Fcontent of the water collected at the scrubber and the corresponding toxicity equivalence valuesare vn. DD/F emissions at the chimney were 0.01 ngNman order of magnit SSthan the emissions limit that the EU legislation accepts (2000/76/EC Directive). WastewaterPCDD/F content was much lower than this of the flue gases. The water had 0.02 ng1- while thelimit is 0.3 mg1. Scrubberrwastewateranalysisforheavy metal compositionhasbeen performedfocusing on elements of environmental interest as described in related EU directive (2000/76/EC Directive), Table IV. Results show low concentrations for most metals, including As, Cr, Pb,Ti, and Hg. However, in some cases the heavy metal concentration exceeds the abovementioned legislation limits. More specific, Cuand Zn concentrations were measuredas 1.80 and 2.88 mg1, while the respective limits are somewhat lower (0.5 and 1.5mg1).Moreover, Cd and Ni concentrations were found to be much higher than the acceptedvalues; Cd concentration was 1.07mgl-and Ni content was 6.5 mg1,and the respectivelimits are 0.05 and 0.5mg1. Therefore, unless such results can be attributed to specificparameters of unit operation that may be improved, wastewater treatment is necessary prior toits disposal. Table III. Fuel blends in pilot plant combustion tests and corresponding emissions. Fuel/blend Total PCDD/F PCDD/F I-TEQ Emission limits Rakoczi RM 0.050 (ngNm) 0.01 (ngNm~) 0.1 I-TEQ ngNm 一3 Wastewater from scrubber 1.380ngl 0.024ng1一1 0.3mgl Table IV. Heavy metal concentrations in scrubber wastewater. Element Concentration (ppm) EU limits (ppm) <0.001 0.15 1.07 0.05 0.29 1.80 6.50 0.037 0.2 0.001 2.88 1.5 0.006 0.03 3.2. Fuel combustion Utilized fuels and fuel mixtures for pilot-scale tests are presented in Table V. It must be notedthat during combustion tests of the first and the last fuels slagging and fouling problems in thecombustion chamber occurred, resulting in emissions monitoring interruption. The average quality characteristics of the selected fuels and blends are given in Table VI. Allsamples present very low moisture content, while their ash content was rather high, varyingfrom 50.53% w/w (dry basis) for the Markushegy raw coal up to 67.04% w/w for the Rakocziclean coal. Mercury content in raw fuels ranges from 0.08 to0.3 ugg. Generally, mercury is atrace element contained in coal whose percentage varies with coal rank (0.01-3.3pgg)(Hancai et al.,2004). The low contents that have been measured in our samples are in agreementwith the above observation, since all the raw fuels could be characterized as low rank coals. The main combustion characteristics of the fuels tested, the total weight loss and thecontribution of the temperature regions in the weight loss are given in Tables VII and VIII.Combustion of raw fuels starts at about 200℃, while two degradation steps occur during theconversion of Markushegy clean coal and its blends. Furthermore, raw fuels presented the Table V. Fuel blends used in the combustion tests. Fuel mixture Test code Fuel 1 Markushegy raw coal Fuel 2 CMF Markushegy clean coal+DW (3:1 blend) Test A Fuel 3 Rakoczi clean coal Test B Fuel 4 Rakoczi clean coal+ straw char (3:1 blend) Test C Fuel 5 Rakoczi raw coal dry Test D Fuel 6 Rakoczi clean coal + willow char (3:1 blend) Test E Fuel 7 Markushegy clean coal Table VI. Proximate and ultimate analysis of the raw fuels. Analysis Fuel 1 Fuel 2 Fuel 3 Fuel 4 Fuel 5 Fuel 6 Fuel 7 Proximate analysis (% w/w as received) Moisture 11.4 1.2 0.9 1.3 4.7 1.4 0.7 Volatiles 37.43 22.99 28.12 19.02 26.92 18.57 28.62 Fixed carbon 6.40 27.87 4.54 22.34 16.38 26.67 16.01 Ash 44.77 47.94 66.44 57.34 52.00 53.36 54.67 Ultimate analysis (% w/w dry basis) 31.02 40.33 22.12 31.43 29.57 43.32 30.67 2.81 1.85 1.31 1.63 2.50 1.71 1.44 0.57 0.81 0.56 0.80 0.66 0.50 0.38 1.97 0.76 0.37 0.33 0.99 0.16 1.75 Cl (ppm) 207.8 678.5 127.1 71.1 165.9 513.6 195.6 Hg (ugg ) 0.3 0.23 0.27 0.21 0.196 0.076 0.12 Ash 50.53 48.52 67.04 58.10 54.56 54.12 55.06 O (by subtraction) 13.1 7.73 8.60 7.71 11.72 0.19 10.7 Gross HV (MJkg ) 14.9 16.6 9.5 13.2 13.9 17.4 12.8 Net HV (MJkg -1 14.3 16.2 9.2 12.8 13.3 17.0 12.5 highest total conversion followed by the clean coal blends, while clean coals presented the lowestweight loss. CO, CO2, SO2, NO, emissions were measured during the combustion tests. Two samplingpoints were selected on the flue gas duct of the combustion unit for these measurements.Sampling point 1 was at the exit of the burner, and sampling point 2 was just after the cyclonefor the fly ash collection. In Table IX, the average values of the measurements at both samplingpoints for the combustion tests A, B, C, and D are shown. During test E, a sampling trainproblem occurred and measuring was not possible. In Table X the PCDD/F emissions as well as the corresponding toxicity equivalence valuesare presented. It is evident that in all flue gases measurements the sum of all isomers was either Table VII. Combustion characteristics of the fuels. Initial combustion Max. combustion Temperature at max. Combustion Sample temperature (C) rate (min-10-2) combustion rate (C) time (min) Fuel 1 214 7.8 532 35.90 Fuel 2 325 7.8 490 33.62 Fuel 3 342 4.8 487 35.21 Fuel 4 300 4.7 495 40.95 Fuel 5 251 6.5 486 30.80 Fuel 6 293 8.4 419 44.09 Fuel7 320 6.0 527 37.28 Table VIII. Total weight loss during combustion of the fuels. Sample Total conversion (% w/w) Combustion time ratio Fuel 1 72.9 0.814 Fuel 2 70.5 0.762 Fuel 3 36.2 0.799 Fuel 4 45.7 0.929 Fuel 5 60.4 0.699 Fuel 6 74.7 1.000 Fuel 7 50.8 0.845 Table IX. Flue gas emissions. Test co (mgNm-3r NO (mgNm-3 r NO.(mgNm~' 02 Excess CO2 code Position (C) dry,6% 02) dry, 6% 02) dry, 6% 02) (%) air (%) A 1 417.26 158.34 270.37 413.63 3.43 1.18 1.22 15.7915.97 A 2 182.96 101.54 285.20 436.31 8.90 1.65 1.95 11.1211.40 B 1 372.71 455.24 254.31 389.06 6.53 1.44 1.52 13.0513.29 B 2 157.46 293.25 341.20 521.98 10.99 1.73 2.60 7.9910.34 C 1 360.24 451.65 280.76 429.52 6.97 1.34 1.46 12.3613.74 C 2 164.83 403.71 294.47 450.50 10.05 1.82 2.11 9.6910.26 D 392.18 245.43 276.49 422.99 4.23 1.21 1.29 15.12 15.38 2 165.02 193.60 290.59 444.56 9.71 1.82 1.91 10.07 10.08 zero or was well below the emissions limits enforced by the EU legislation (2000/76/ECDirective). Specifically, the relevant limit is 0.1 I-TEQng Nm-and the higher value measuredduring the combustion tests was 0.018 I-TEQ ng Nmcorresponding to the Rakoczi clean coal/straw char blend, almost one order of magnitude lower. This indicates that although thefavouring PCDD/F formation chlorine content of the raw fuel was rather high, the relativelylow carbon fly ash content prevented toxics existence in the flue gases. In Figure 4(a) and (b), the homologue pattern distribution of PCDD and PCDF is shown,respectively, for the fuel blend Rakoczi clean coal/straw char. In that case, the lower (tetra- andpenta-) chlorinated isomers prevailed over the higher ones, especially in the case of furans. Thisis a typical distribution for coal co-combustion processes. Bottom and fly ash samples were collected and concentrations of the various metalcompounds in their TCLP leachates are presented in Table XI. Cr and Cu compoundconcentrations were not traced to the aquatic phase, while Sn was only found in fly ash leachatethat corresponds to Rakoczi clean coal combustion. Regarding the bottom ash leachates, Cd,Co, Cr, Cu, and Sn were not traced in any of the liquid samples. In general, all ash leachatespassed the EPA-TCLP test, since none of them exceeds the EPA limits for its safe disposal. Before all TCLP leaching tests, the pH values of the liquid samples were adjusted to 7±0.2 inorder to ensure that the toxicity is only due to the substances that are present in the samples andtest bacteria are not affected by the pH. The results were obtained by measuring the toxic effectsof the TCLP leachates on the V. fischeri within exposure times of 5, 15,30 min, according to the Table X. Fuel blends in combustion tests and corresponding emissions. Fuel Content Total PCDD/F PCDD/FI-TEQ Fuel/blend code (% w/w) (ngNm~) (ngNm~) CMF Markushegy clean coal/DW (A) 75/25 0.124 Rakoczi clean coal 100 0 Rakoczi clean coal/straw char 75/25 1.897 0.018 Rakoczi raw coal dry 100 0.213 0.007 Rakoczi clean coal/willow char 75/25 0 0 Rakoczi RM (mine) 100 0.050 0.001 Figure 4. (a) PCDD and (b) PCDF homologue pattern for Rakoczi clean coal/straw char (3:1 blend) fuel.Copyright C 2007 John Wiley & Sons, Ltd. Int. J. Energy Res.2007; 31:1237-1250 45 and 82% screening test protocols. Screening test protocols, with pH adjusted at 7±0.2, aregiven in Figures 5 and 6, where FA1-5 and BA1-5 represent samples from tests A-E,respectively. The toxic effect of the fly ash leachates FA1, FA2, and FA5 on V. fischeri isrelatively high in both protocols, while the liquid sample FA3 presented a sufficient ecologicalquality, as its effect on the bacteria did not exceed the 20%. Concerning the bottom ashleachates, Figures 5 and 6 reveal that their toxic effect on the microorganisms is relatively low,up to 30% fo82%SSTfr the 45% screening test protocol and up to 40% for the 82% screening testprotocol, for almost all samples. These values were exceeded in the case of the liquid sampleBA2, which corresponds to Rakoczi clean coal that caused the highest toxic effect on V. fischeriin both protocols. The results of the Microtox toxicity tests were compared with the chemical Table XI. Chemical analysis of the fly and bottom ash leachates. mgl-1 Values of fly/bottom ash leachates Test 1 Test 2 Test 3 Test 4 Test 5 EPA max As 0/0 0.02/0 0/0.02 0/0 0.01/0.018 5 Cd 0/0 0/0 0.003/0 0.004/0 0.001/0 1 Co 0.12/0 0.1/0 0/0 0.12/0 0.1/0 5 0/0 0/0 0/0 0/0 80 0/0 0/0 0/0 0/0 15 0.0007/0.00007 0.00075/0.00023 0.00045/0.00028 0.0004/0.0002 0.00035/0.00028 0.2 0.4/0 48/24 74/46 59/29 53/23 0/0 0/0.38 1.9/0.68 1.5/0.68 1.3/1.1 0.121/0.068 0.049/0.113 0.16/0.062 0.216/0.06 0.144/0.045 5* 0.015/0 0.105/0.01 0.01/0.13 0.013/0 0.06/0 5 0/0 0/0 0.128/0 0/0 0/0 0.01/0 0/0.31 1.65/0.14 1.75/0.58 0.71/0.68 25 *100×drinking water maximum,EPA-TCLP maximum has not been established. Figure 5. Toxicity effect on V. fischeri of fly ash TCLP leachates using: (a) the 45% Screening TestProtocol and (b) the 82% Screening Test Protocol. Figure 6. Toxicity effect on V. fischeri of bottom ash TCLP leachates using: (a) the 45% Screening TestProtocol and (b) the 82% Screening Test Protocol. analysisof the corresponding leachatesaandno) correlation Was foundd tbetween theconcentrations of the metal species and the toxic effect caused on the test organisms. However,for the fly ash leachates, which showed higher toxic effects than the bottom ash leachates on thebacteria, the measured concentrations of heavy metals were also higher than those measured inthe liquid bottom ash samples. In addition, the high toxic effect of the leachate BA2 could beattributed to the high Ni content in the sample. 4. CONCLUSIONS A series of experimentations focused on the combustion and environmental performance ofclean coals produced by the TDT-3R process were accomplished. In the lab scale investigations,clean fuels were found to be less reactive than the raw samples. The overall combustionbehaviour of both clean and raw fuels was the same, while clean fuels exhibited much highercarbon content and lower heteroatoms and toxic pollutants. Biomass addition in the fuel blendfavoured the reactivity increase compared to the exclusive coal use. In this sense, biomass inputin the clean fuels production may compensate for the low calorific content of coal chars, offeringat the same time significant environmental benefits in terms of CO2 reduction. In the pilot-scale combustion tests, severe slagging and fouling problems were observedwhen 100% clean coal was employed. Operational problems were mainly attributed to thehigh ash content of the selected raw coal. Such high ash content (33-45% w/w) of the rawfuel has proven to be a limiting factor for the TDT-3R technology.IDuring both cleanfuel production and combustion tests at the pilot-scale facilities, all gaseous pollutantsvalues were well below European and international legislation limits. Toxic emissions weregenerally very limited. However, heavy metal analysis of the wastewater in the clean fuelproduction revealed that wastewater treatment is probably necessary prior to its disposal. Allash leachates passed the EPA-TCLP test, since none of them exceeded the EPA limits for safe disposal. However, high toxicity effects have been observed in almost all samples. Therefore,safe disposal measures of produced ashes should be maintained even when clean fuels areutilized in energy production. In all collected samples, PCDD/F concentrations and theirrespective toxicity equivalent factor was either zero or it was much lower than the EU legislativeemission limits. Conclusively, the major advantage of the TDT-3R process is the production of fuels withmuch lower pollutants content. The ‘3R’recycle-reduce-reuse integrated environment controltechnology provides preventive pre-treatment of low-grade solid fuels, such as brown coal andcontaminated solid fuels to achieve high-grade fuels. It is safer, faster, better, and less costlyprocess in comparison to the end-of-the-pipe’post-treatment solutions. Its industrial-scaleapplication is considered feasible for power generation up to 300 MWe, provided that theash content of the raw solid fuel does not exceed 20%6 w/w. Future research should befocused on the optimization of the low carbonation operating conditions aiming to furtherimprove the quality of the produced clean coals at minimum pollutants content. The 3Rtechnology could be applied as vital component of an integrated strategy towards the near zeroemission power plant targets, combining technologies for environmentally sustainable andeconomical solid fuel power generation, including but not limited to the decrease or evenremoval of greenhouse gases. ACKNOWLEDGEMENTS The authors thank the EC for the financial support of this work through the NNE5/2001/363 project,European Union CORDIS database: http://cordis.europa.eu/search/index.cfm?fuseaction=proj.simple-document&PJ_RCN=5487554. REFERENCES Antal MJ, Gronli Jr M. 2003. The art, science and technology of charcoal production. Industrial and EngineeringChemistry Research 42:1619-1640. Braden JB, Kolstad CD, Woock RA, Machado JA. 2001. Is coal desulphurisation worthwhile? Evidence from themarket. Energy Policy 29:217-225. CERTH/ISFTA, Moving towards zero-emission plants. Proceedings of the International Symposium. Leptokarya,Greece. 20-22 June 2005. Directive 2000/76/EC of the European Parliament and of the Council of the 4 December 2000 on the Incineration ofWaste. Official Journal of the European Communities. Hancai Z, Feng J, Jia G. 2004. Removal of elemental mercury from coal combustion flue gas by chloride-impregnatedactivated carbon.Fuel 83:143-146. Liao H, Li B, Zhang B. 1998. Pyrolysis of coal with hydrogen-rich gases. 2. Desulphurisation and denitrogenation in coalpyrolysis under coke-oven gas and synthesis gas. Fuel 77:1643-1646. Microbics Corporation. 1992.Microtox Manual. Azur Environmental: Carlsbad, CA. ( Someus E d . 2 0 06. The ‘3'R A n thracite c l ean coal t echnology: e conomical conversion of browncoal t o anthracite t ypeclean coal b y low temperature carbonization pre-treatment proc e ss. The Journal ofThermal Science 3: 55-69. O riginalscientific paper, UDC: 662.641.66:662.612, BIBLID: 0354-9836. ) U.S. Environmental Protection Agency. 1992. Method 1311-Toxicity Characteristic Leaching Procedure (TCLP). 35. ( U.S. Environmental Protectio n Agency . 199 4 . Metho d 7471A—Mercury in Soli d or Semisolid Waste Manual Cold-Vapour Atomic A b sorption S p ectroscopy. 7 . ) Copyright C John Wiley & Sons, Ltd. Copyright C John Wiley & Sons, Ltd.Int. J. Energy Res. OI: er
关闭-
1/14
-
2/14
还剩12页未读,是否继续阅读?
继续免费阅读全文产品配置单
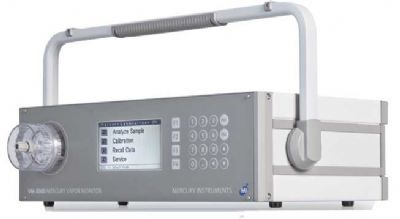
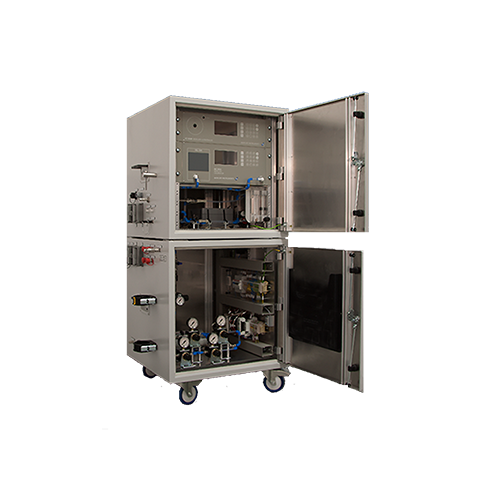
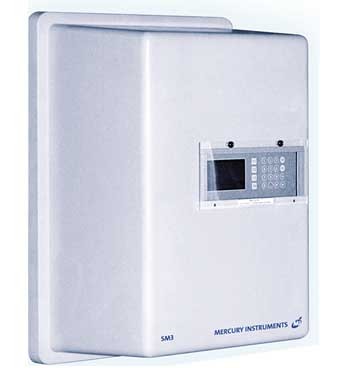
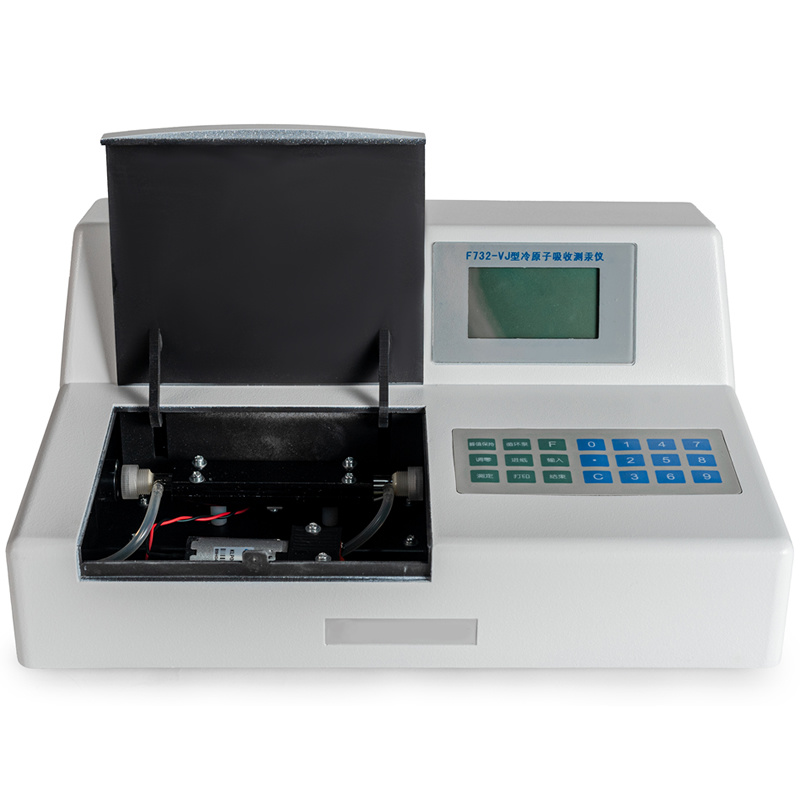
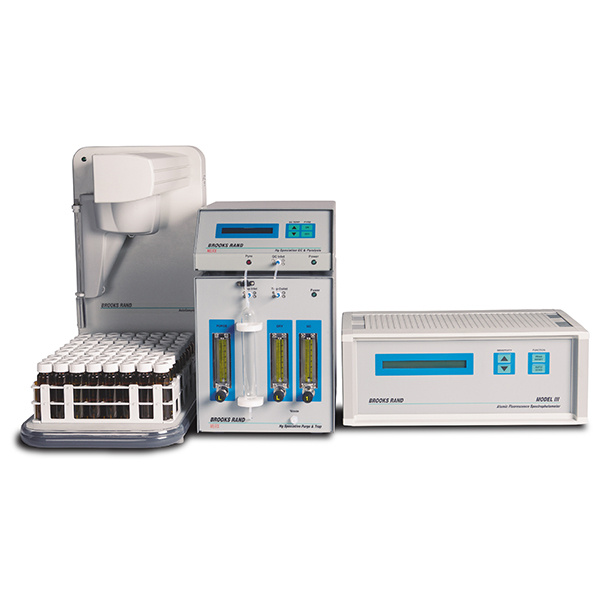
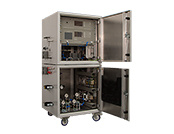
北京诚驿恒仪科技有限公司为您提供《废气中(类)金属及其化合物检测方案 》,该方案主要用于废气中综合检测,参考标准《暂无》,《废气中(类)金属及其化合物检测方案 》用到的仪器有德国MI LabAnalyzer 254实验室快速测汞仪、德国MI AULA-254 Gold实验室全自动测汞仪、德国MI VM-3000汞蒸气测汞仪、德国MI SM-4 Mobile烟囱气体-汞监测器、德国MI SM-3烟道气汞分析仪。
我要纠错
推荐专场
烟气汞连续监测系统(Hg-CEMS系统)
更多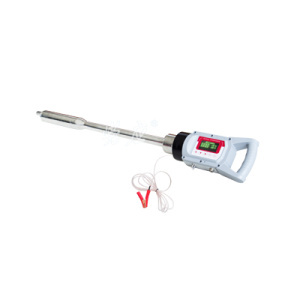
相关方案
 咨询
咨询