

方案详情文
智能文字提取功能测试中
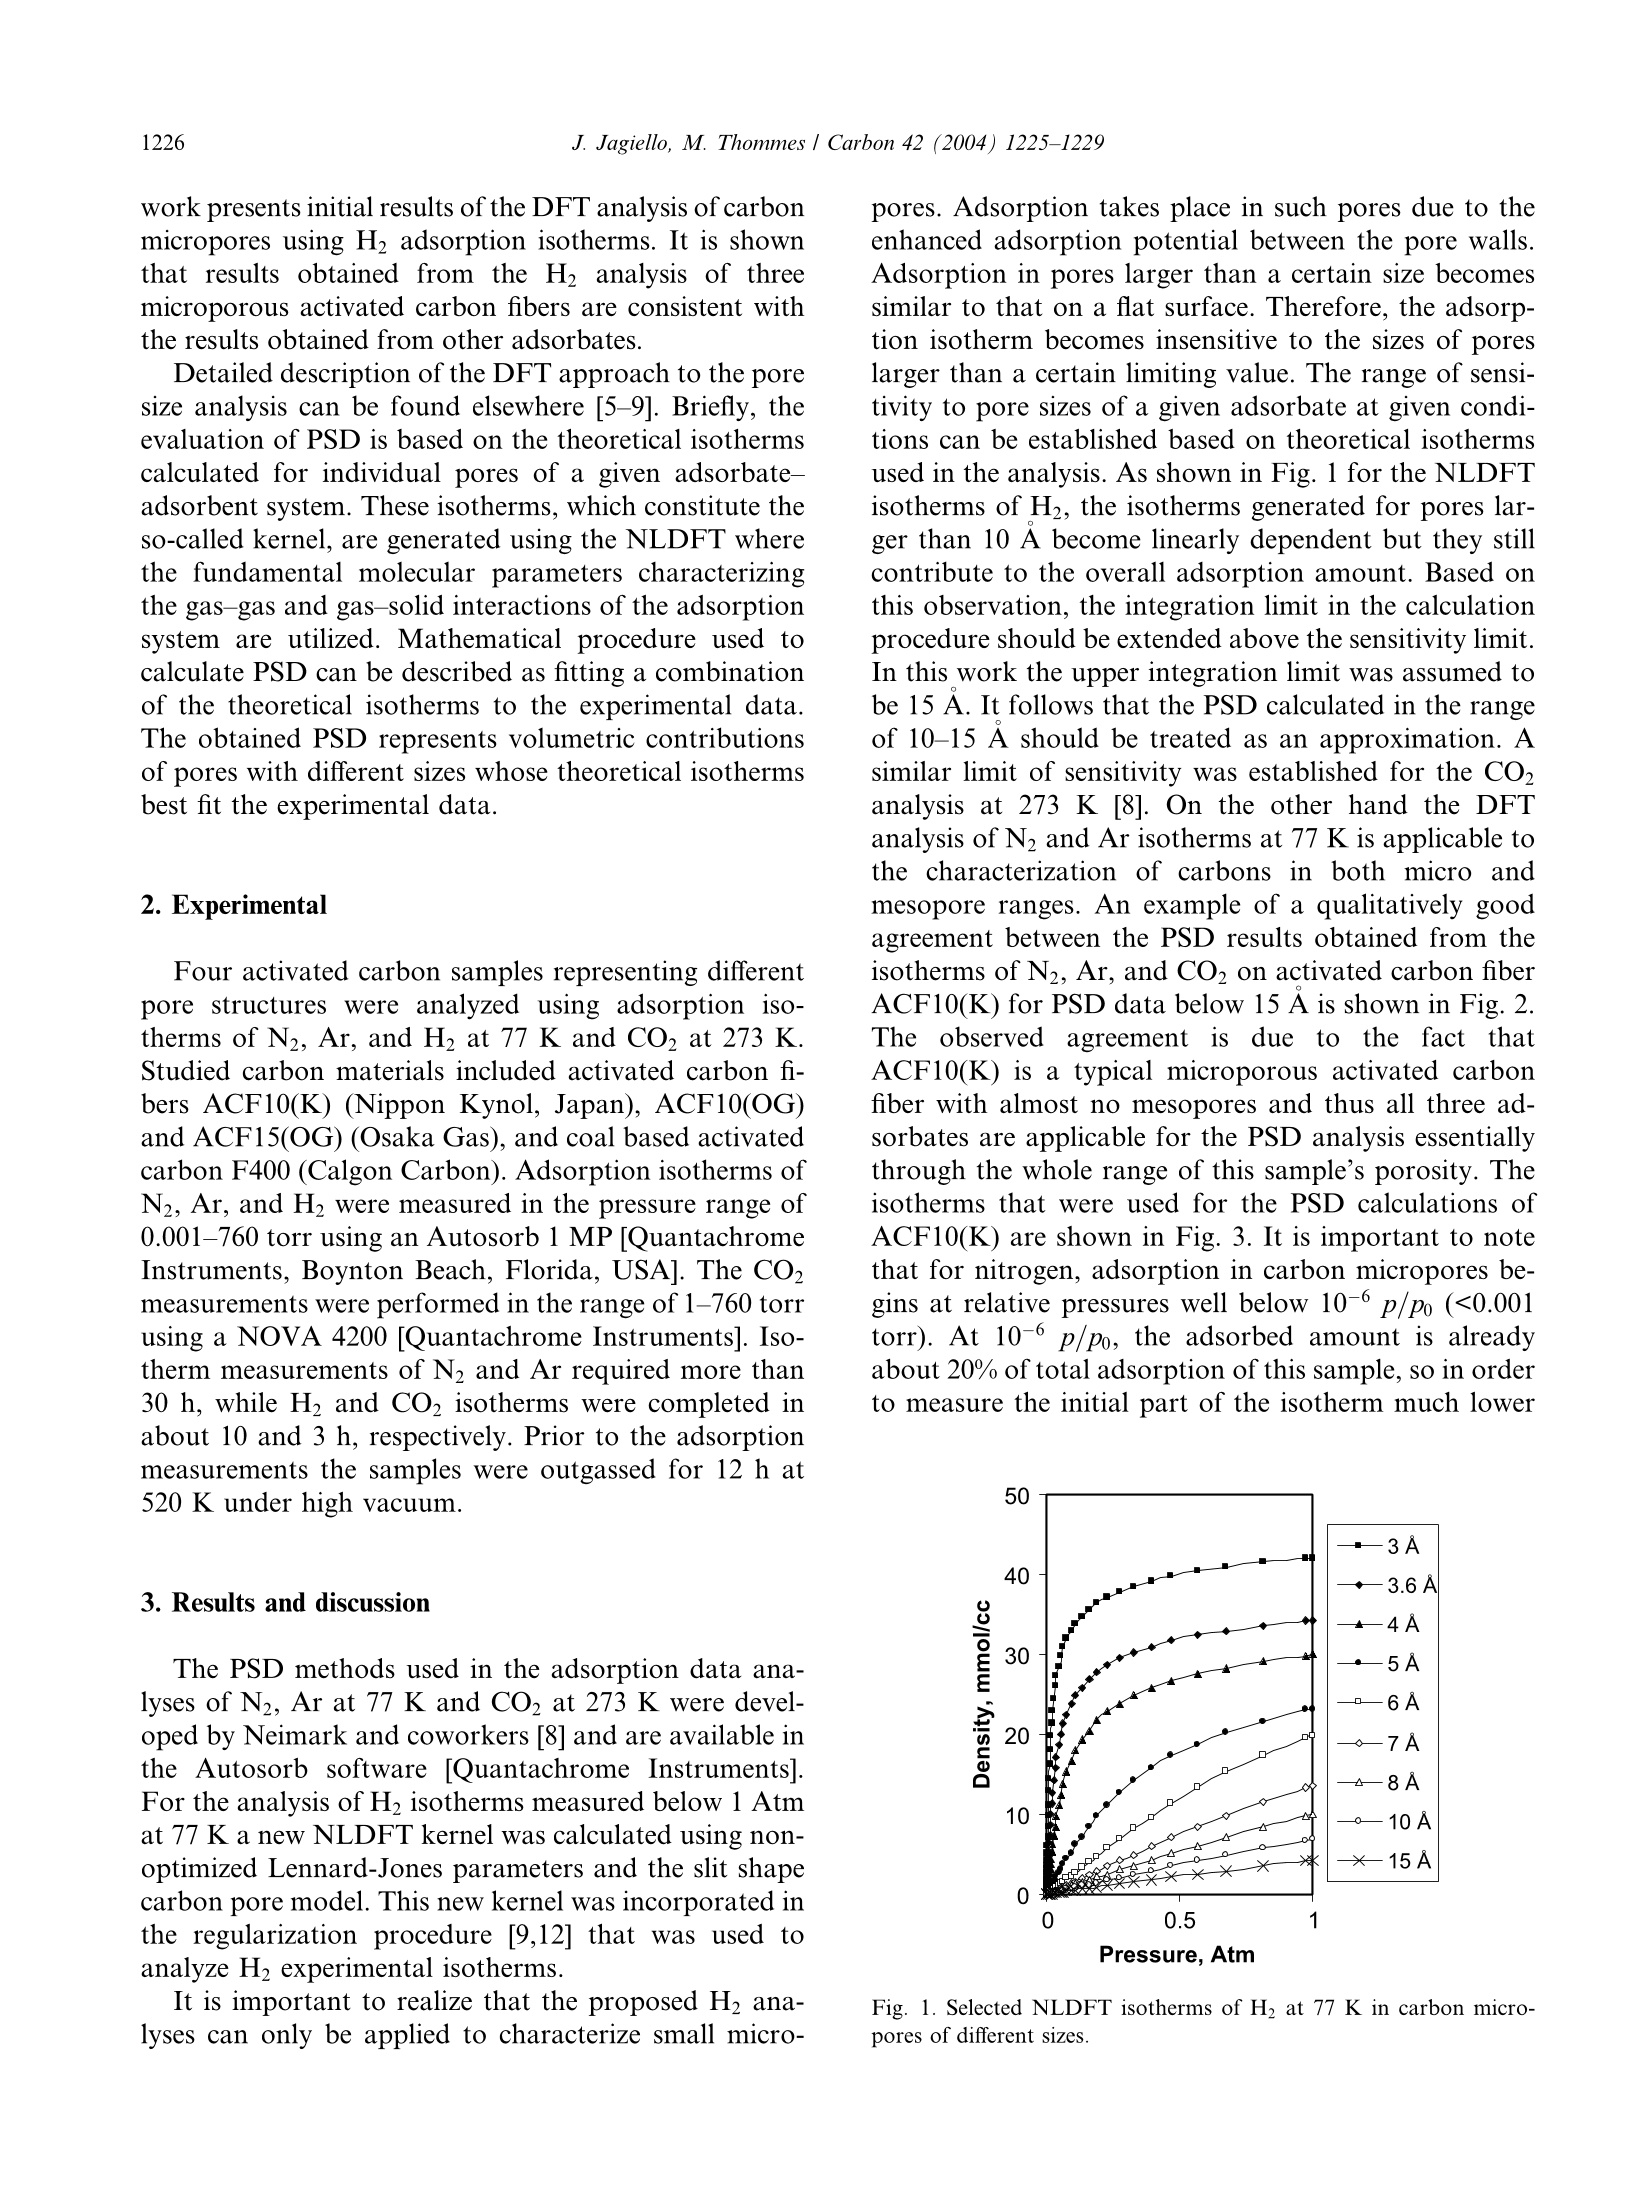
Available online at www.sciencedirect.comCARBONCarbon 42 (2004) 1225-1229www.elsevier.com/locate/carbon 1226J. Jagiello, M. Thommes / Carbon 42 (2004) 1225-1229 Comparison of DFT characterization methods basedon N2, Ar, CO2, and H2 adsorption applied to carbonswith various pore size distributions Jacek Jagiello *, Matthias Thommes Quantachrome Instruments, 1900 Corporate Drive, Boynton Beach, FL 33426, USAReceived 10 July 2003; accepted 28 December 2003 Available online 10 February 2004 Abstract Adsorption isotherms of N2, Ar, CO2, and H2 were measured on selected activated carbons representing various pore sizedistributions. Isotherm data were analyzed using the DFT method. A good agreement was obtained between N2 and Ar results in awide range of pore sizes. Both N2 and Ar results agree with CO2 analysis at 273 K in the range of small micropores where CO2analysis is most applicable. Also, in this range of pores the analysis of H2 adsorption data at 77 K gives results which are consistentwith the results obtained from the more conventional vapor-phase adsorptives. However, the range of PSDs calculated from H2 dataextends to pore sizes smaller than those that can be characterized by other adsorbates. @ 2004 Elsevier Ltd. All rights reserved. Keywords: A. Activated carbon; C.Adsorption, Modeling; D. Gas storage, Microporosity 1. Introduction The pore size distribution (PSD) is a key element inthe characterization of porous carbons and a number ofmethods were developed for the PSD analysis [1]. Aspecial issue of Carbon Journal was devoted to the morerecently developed methods [2]. Since the developmentof the PSD calculation method [3] based on the so-calledNon Local Density Functional Theory (NLDFT) [4],the methods based on this approach became widely usedfor the characterization of pore structure of activatedcarbons and other porous materials [5-8]. The detaileddescription of the pore structure in terms of PSD may beused for correlation and prediction of the performanceof activated carbons in industrial applications as well asin developing new porous materials [9]. Traditionally, the PSD of a porous solid is evaluatedfrom the analysis of nitrogen adsorption isothermsmeasured at 77 K. It is well known, however, that at thistemperature diffusion of nitrogen molecules into carbonmicropores is very slow. Moreover, it was pointed out ( C orresponding author. ) ( E-mail address: jacek.jagiello@q u an t ac h rome . com (J. J a gi e llo). ) ( 0008-6223/$ - s ee front matter @ 2 004 Else v ier Ltd. All rights reserved.doi:10.1016/j.carbon.2004.01.022 ) that diffusional limitations at this temperature mightinfluence adsorption in ultramicropores (pores smallerthan 7 A) [10]. For porous carbons, usually containing awide range of pore sizes including ultramicropores, thisleads to time-consuming measurements and may causeunder-equilibration of measured adsorption isotherms.It has long been recognized [11,12] that problems of thistype can be eliminated by using CO2 adsorption analysisat 273 K. At this temperature, CO2 molecules can moreeasily access ultramicropores than N2 at 77 K in spite ofthe fact that critical molecular dimensions of both gasesare similar. Other adsorptives including CH4 and CF4were also employed to obtain information about carbonmicroporosity [13-15]. In light of the recent growing interest in hydrogenstorage and fuel cell applications it is fundamentally andpractically significant to develop a better understandingof hydrogen adsorption on carbonaceous materials andimprove methods for accurate characterization of carbonmicropores that play a role in H2 adsorption and sepa-ration [16-19]. Part of such pores may only be accessibleto H but not to other molecules. Therefore it seems tobe natural to explore the use of H for the PSD analysisof carbon materials considered for H2 applications. This work presents initial results of the DFT analysis of carbonmicropores using H2 adsorption isotherms. It is shownthat results obtained from the H analysis of threemicroporous activated carbon fibers are consistent withthe results obtained from other adsorbates. Detailed description of the DFT approach to the poresize analysis can be found elsewhere [5-9]. Briefly, theevaluation of PSD is based on the theoretical isothermscalculated for individual pores of a given adsorbate-adsorbent system. These isotherms, which constitute theso-called kernel, are generated using the NLDFT wherethe fundamental molecular parameters characterizingthe gas-gas and gas-solid interactions of the adsorptionsystem are utilized. Mathematical procedure used tocalculate PSD can be described as fitting a combinationof the theoretical isotherms to the experimental data.The obtained PSD represents volumetric contributionsof pores with different sizes whose theoretical isothermsbest fit the experimental data. 2. Experimental Four activated carbon samples representing differentpore structures were analyzed using adsorption iso-therms of N2, Ar, and H2 at 77 K and CO2 at 273 K.Studied carbon materials included activated carbon fi-bers ACF10(K) (Nippon Kynol, Japan), ACF10(OG)and ACF15(OG) (Osaka Gas), and coal based activatedcarbon F400 (Calgon Carbon). Adsorption isotherms ofN2, Ar, and H2 were measured in the pressure range of0.001-760 torr using an Autosorb 1 MP [QuantachromeInstruments, Boynton Beach, Florida, USA]. The COmeasurements were performed in the range of 1-760 torrusing a NOVA 4200 [Quantachrome Instruments]. Iso-therm measurements of N2 and Ar required more than30 h, while H2 and CO2 isotherms were completed inabout 10 and 3 h, respectively. Prior to the adsorptionmeasurements the samples were outgassed for 12 h at520 K under high vacuum. 3. Results and discussion The PSD methods used in the adsorption data ana-lyses of N2, Ar at 77 K and CO2 at 273 K were devel-oped by Neimark and coworkers [8] and are available inthe Autosorb software [Quantachrome Instruments].For the analysis of H2 isotherms measured below 1 Atmat 77 K a new NLDFT kernel was calculated using non-optimized Lennard-Jones parameters and the slit shapecarbon pore model. This new kernel was incorporated inthe regularization procedure [9,12] that was used toanalyze H2 experimental isotherms. It is important to realize that the proposed H2 analyses can only be applied to characterize small micro- pores. Adsorption takes place in such pores due to theenhanced adsorption potential between the pore walls.Adsorption in pores larger than a certain size becomessimilar to that on a flat surface. Therefore, the adsorp-tion isotherm becomes insensitive to the sizes of poreslarger than a certain limiting value. The range of sensi-tivity to pore sizes of a given adsorbate at given condi-tions can be established based on theoretical isothermsused in the analysis. As shown in Fig.1 for the NLDFTisotherms of H2, the isotherms generated for pores lar-ger than 10 A become linearly dependent but they stillcontribute to the overall adsorption amount. Based onthis observation, the integration limit in the calculationprocedure should be extended above the sensitivity limit.In this work the upper integration limit was assumed tobe 15 A. It follows that the PSD calculated in the rangeof 10-15 A should be treated as an approximation. Asimilar limit of sensitivity was established for the CO2analysis at 273 K [8]. On the other hand the DFTanalysis of N2 and Ar isotherms at 77K is applicable tothe characterization of carbons in both micro andmesopore ranges. An example of a qualitatively goodagreement between the PSD results obtained from theisotherms of N2,Ar, and CO2 on activated carbon fiberACF10(K) for PSD data below 15 A is shown in Fig. 2.The observed agreement is due to the fact thatACF10(K) is a typical microporous activated carbonfiber with almost no mesopores and thus all three ad-sorbates are applicable for the PSD analysis essentiallythrough the whole range of this sample’s porosity. Theisotherms that were used for the PSD calculations ofACF10(K) are shown in Fig. 3. It is important to notethat for nitrogen, adsorption in carbon micropores be-gins at relative pressures well below 10-6p/po (<0.001torr). At 10-6 p/po, the adsorbed amount is alreadyabout 20% of total adsorption of this sample, so in orderto measure the initial part of the isotherm much lower Fig. 1. Selected NLDFT isotherms of H2 at 77K in carbon micro-pores of different sizes. Fig. 2. PSDs of activated carbon fiber ACF10(K) obtained from theDFT analysis of N2, Ar, and CO2 isotherms. Fig. 3. Adsorption isotherms of N2 and Ar at 77 K and CO2 at 273 Kon activated carbon fiber ACF10(K). pressure is necessary. For argon, adsorption begins atabout 10-6 p/po (0.001 torr). In the case of CO2,adsorption begins at about 10-4 p/Po (~1 torr) so theinitial part of the isotherm can be more easily measured.This comparison clearly demonstrates that in order tofollow and analyze adsorption in micropores it is moreconvenient and beneficial to use CO, at 273 K ratherthan N2 or Ar at 77 K. To characterize carbons containing both micro andmesopores the DFT analysis of N2 or Ar isotherm isusually performed. The PSDs obtained from suchanalyses for F400 sample (Fig.4) show that the twomethods give practically equivalent results. In general,however, Ar analysis may be expected to provide moreaccurate PSD data because argon adsorption is almostnot affected by any specific interactions that may occurwith carbon surface groups. Hydrogen storage applications of carbon materialsrequire accurate methods for characterization of carbonmicropores that play a role in H2 adsorption. It is pro-posed that these pores can be analyzed using H2adsorption. To demonstrate the feasibility of suchanalysis and its consistency with the results for other Fig. 4. PSDs of coal based activated carbon F400 obtained from theDFT analysis of N2 and Ar isotherms at 77 K. gases, the isotherms of H2,N2, and CO2 were measuredat 77, 77, and 273 K, respectively, on three activatedcarbon fibers:ACF10(K),,ACF10(OG))aand AC-F15(OG). The BET surface areas of both ACF10 sam-ples are ~1000 while ACF15 is ~1500 m²/g. The H2isotherms measured for these carbons and the corre-sponding PSDs calculated from the isotherms are shownin Fig. 5a and b. The isotherms show significant differ- (a) Pressure, Atm Fig. 5. (a) Adsorption isotherms of H2 measured at 77 K on threeactivated carbon fibers ACF10(K), ACF10(OG), and ACF15(OG). (b)PSDs of activated carbon fibers obtained from the DFT analysis of H2isotherms. Fig. 6. Differential PSDs calculated from H2, N2, and CO2 isothermsfor the ACF10(OG) sample. ences in H2 adsorption for the two ACF10 carbon fibershaving similar BET surface areas. The higher Hadsorption capacity of ACF10(K) sample in the initialpressure range is related to the larger PSD peak in therange of smallest pores. On the other hand ACF10(OG)and ACF15(OG) samples having very different BETsurface areas show similar H2 adsorption capacities andsimilar micropore structure. Comparisons between theresults of the H2, N2, and CO2 analyses are shown asdetailed differential PSDs for the ACF10(OG) sample inFig. 6 and as abbreviated cumulative PSDs for all threecarbon fiber samples in Fig. 7. Results obtained usingdifferent gases demonstrate overall consistency amongthe methods. As expected, analysis with H2 moleculesshows the highest volumes for pores in the range below 5A. It seems that using H2 will allow for extending thelower limit of pore sizes that can be analyzed byadsorption methods. More work is underway to analyzecarbons with well-defined pore structure in order tovalidate the proposed approach. 4. Conclusions Results of the DFT analysis obtained using differentprobe molecules are consistent, which indicates that thismethod provides a means for the reliable characteriza-tion of porous materials. It also shows that the analysismethod can be optimized for a given pore size range.For example, if micro and ultramicropores are of themain interest, an analysis can be performed at 273 Kwith a molecular probe such as CO2, which ensuresfaster analysis, and more importantly, greater confi-dence that measured adsorption points are equilibrated.The range of PSD analysis can be additionally extendedto smaller pore sizes by using H2 analysis. Additionalinformation about ultramicropores obtained from theH2 analysis may be especially important for character- N, ■ Co, H, Pore Size Range,A Fig. 7. Abbreviated cumulative PSDs for three activated carbon fiberscalculated from the DFT analysis of adsorption isotherms of N2 at 77K,CO2 at 273 K, and H2 at 77 K. ization of materials considered for H2 applications suchas hydrogen storage. ( References ) [1] Gregg SJ, Sing KSW. Adsorption, Surface Area and Porosity.London: Academic Press: 1982. [2] McEnaney B, Mays TJ, Rodriguez-Reinoso F, editors. Carbon.Fundamental aspects of active carbons 1998;36(10), special issue. [3] Lastoskie C, Gubbins KE, Quirke N. J Phys Chem 1993;97:4786-96. [4] Tarazona P, Marini Bettolo Marconi U, Evans R. Mol Phys1987;60:573. [5] Lastoskie C, Gubbins KE, Quirke N. Langmuir 1993;9:2693-702. [6] Olivier JP, Conklin WB, Szombathely M. In: Rodriguez-ReinosoF, Rouquerol J, Sing KSW, Unger KK, editors. Characterizationof Porous Solids III. Amsterdam: Elsevier; 1994. p. 81-9. ( [7] Neimark AV, Ravikovitch PI, Grin M, Schith F, Unger KK. J Colloid Interface Sci 1998;207:159-69. ) ( [8] Ravikovitch PI, Vishnyakov A, Russo R, Neimark AV. L angmuir 2000;16:2311-20. ) ( [9] Jagiell o J , Tolle s D . In : Meunier F, editor. Fundamentals of Adsorption, 6. A msterdam: Elsevier; 1998. p. 629- 3 4. ) ( [10] Rodriguez-Reinoso F, L inares-Solano A. I n: T hrower P A , editor. Chemistry and Physics of Carbon, 21. N ew York: Marcel Dekker;1988. ) ( [11] Garrido J, Linares-Solano A , Martin-Martinez JM, Molina-Sabio M , Rodriguez-Reinoso F, T o rregosa R. L a ngmuir 1987;3:76-81. ) ( [12] Jagiello J. Langmuir 1994;10:2778-85. ) ( [ 1 3] Sosin KA, Quinn DF. J P orous Ma t er 199 5 ;1:111-9. ) ( [14] Lozano-Castello D, Cazorla-Amoros D , Linares-Solano A, Quinn DF. J Phys Chem B 2002;106:9372-9. ) ( [15] Jagiell o J, Bandosz TJ, Schwarz JA. L angmuir 1 9 96;12:2837- 42. ) ( [16] Kadono K, K ajiura H , S hiraishi M. Appl P hys Lett 2003; 83(16):3392 - 4. ) ( [ 1 7] Wang Q, J ohnson JK. J Chem P h ys 1 9 99;110(1):577- 8 6. ) ( [18] Zhou Y, F eng K, Sun Y , Z h ou L. Chem Phy s Lett 2003;380(5- 6):526-9. ) ( [19] Kajiura H, Tsutsui S, Kadono K, Kakuta M, Ata M , MurakamiY. Appl P hys Lett 2 003;82(7):1105-7. )
关闭-
1/5
-
2/5
还剩3页未读,是否继续阅读?
继续免费阅读全文产品配置单
安东帕(上海)商贸有限公司为您提供《适用于对碳素不同孔径分布测定的,基于碳氢吸附的DFT测试方式特性分析》,该方案主要用于其他中null检测,参考标准《暂无》,《适用于对碳素不同孔径分布测定的,基于碳氢吸附的DFT测试方式特性分析》用到的仪器有null。
我要纠错
相关方案
 咨询
咨询