

方案详情文
智能文字提取功能测试中
联用技术应用文章合辑 TG-IR分析:实验方法 O IC 联用技术 强强联合,获得更全面的结果 PerkinElmer联用技术解决方案是将两种或两种以上的仪器连接使用,最大程度地提高单次实验的分析能力和获取的数据信息并节省操作时间。 PerkinElmer TGA 8000TM 或 STA系统充 FTIR, MS和(或者) GC/MS相连,代表了行业最完 整和先进的联用技术平台,可应用于聚合物材 料表征,制药,化工,石油,橡胶和食品等领域。 其应用包括检测土壤中的有害化学物质,定量测定聚合物中的成分,确定产品包装中是否有可能污染产品的溢出物质,检测PVC样品中的.邻苯二甲酸酯。 我们了解客户和市场独特和多样化的需求,我们是行业内唯一―家能够提供全套联用系统的生产,技术支持和售后服务的公司,简化从样品的处理到结果分析、传递的整个过程并使其更加流畅。 PerkinElmer 的联用技术将为您的实验室提供创新和科学探索的新途径。 高品质分析,源于全面的数据获取 目录 引言聚合物分析 汽车工业所用多层电缆的热重-红外光谱 (TG-IR)联用技术分析 鉴别墙面底漆中的丁苯树脂聚合物......... . . 7 使用 DSC-Raman 技术研究聚合物的结晶度.. ....13 使用GC/MS对热重分析中的溢出气体进行定性分析... ..16 TG-MS联用技术分析EVA... 20 TG-MS 及 TG-GC/MS 联用技术分析不同邻苯二甲酸含量的 PVC 23 使用新型的双炉体 DSC 本 UV-DSC研究... . . . . . .. .27 使用 TG-IR联用技术表征增塑剂....... .. 31 光固化丙烯酸树脂的 UV-DSC 和 UV-DMA分析T ... 34 在 DSC 8000 中用紫外线照射研究光学胶黏剂的固化.. ...39 .原位分析3D打印过程中的逸出气体......... ..41 TG-GC/MS 联用技术分析手套中的添加剂. ..44 药物分析 超高灵敏度逸出气分析方法:医药中溶剂重结晶的研究. . x. .a 49同步 DSC-Raman 分析扑热息痛中的多种晶型....... ..53 逸出气分析.采用 TG-MS 联用技术分析样品中的残留溶剂 .. ..56TG-IR联用技术研究水水合草酸钙T........... .60 食品与饮料分析 .TG-GC/MS技术:咖啡豆中的复杂基质分析 ......63 纳米材料分析 用热重分析仪研究老化处理的碳纳米管. ..66 热分析和光谱联用技术在表征纳米粒子和有机污染物相互作用中十...........的应用 环境样品分析 热重-红外-气相色谱/质谱 (TG-IR-GC/MS) 联用技术分析未知水性样.............75 TG-IR联用技术用来分析土壤污染物........... ..79 应 用 文 章 Thermal Analysis 作者 Maria Garavaglia PerkinElmer Italia Via Tiepolo 24 Monza, Italy 20052 汽车工业所用多层电缆的热重-红外光谱 (TG-IR)联用技术分析 引言 某位用户向PerkinElmer提供了一个汽车工业所使用的电缆样品,其分析目的是识别该电缆外护套所使用的高分子材料。 该电缆样品的外护套包含5个同心圆圈层,依次为:橡胶、织物、橡胶、织物、橡胶。构成外护 套的高分子材料中填充了大量的炭黑,因此难以直接用红外光谱对这些材料进行识别。所以,我们决定使用热重-红外光谱:((TG-IR)联用技术,通过材料的分解产物对其进行识别。通过这种方法,可以完全避免炭黑的存在对测试结果造成的干扰。 TG-IR分析:样品处理 TG-IR分析一般不需要特别的样品前处理措施。用比较锋利的解剖刀从橡胶外护套切取一小部分(约26mg)),即可直接进行测试。 根据一般性的规律,TG-IR分析的样品用量通常在10mg到30 mg之间,以保证能够对数量很少的释放气体进行识别。样品用量太少时,难以进行正确的分析;而样品体积太大时,没有被气流吹扫到的部分样品可能燃烧(或者热解)不完全。 热重分析中使用流速为100 ml/min的氮气进行吹扫,样品的加热速率为20℃/min。 在热重分析过程中,对样品释放的气体产物的红外光谱进行测量。每4秒钟采集一张红外光谱,光谱分辨率为4cm1 TG-IR分析:结果讨论 下面对样品的热重测试结果和释放气体的红外光谱强度曲线进行分析。可以看到,样品存在三个主要的失重阶段:第一个失重阶段在15分钟左右,第二个失重阶段在24分钟左右,第三个失重阶段在29分钟左右。与样品的失重过程相对应,红外光谱强度曲线上可以看到三个峰。上述结果说明,样品失重的同时也释放出气体产物。 接下来我们对释放气体的红外光谱进行详细分析,然后对这些气体进行识别。 测试开始后10分钟左右(样品温度约为200℃),在导数失重曲线上可以看到样品重量的轻微下降,此刻之后 热重分析结果显示3个失重阶段,红外光谱检测到3个样品分解峰。 的释放气体红外光谱显示出-CH,和-CH,的伸缩振云吸收峰 (峰A)。还可以看到样品释放出少量的二氧化碳,并且在15分钟左右达到最高值(如图1和图2所示) 样品释放出的二氧化碳可能来自高分子材料中的醋酸乙烯基团的脱羧过程。释放气体中的有机成分可能是由于添加剂的挥发,或者是因为高分子基质的早期分解。事实上,接下来的失重过程中大量HCI气体的产生可以进一步支持后一种假设。图3显示了HCI气体的红外光谱特征峰强度曲线,并且与峰A的强度曲线进行了比较。图4显示了数据处理前与峰A叠加在一起的HCI气体的红外光谱,而图5则显示了扣除峰A后的HCI气体的特征谱带。 分析过程中氯化氢气体的产生证实了样品中氯元素的存在。 接下来我们分析发生在24分钟左右(样品温度约为500℃)的第二个失重过程中释放的气体。在这一温度下,高分子材料发生明显地降解,主链的断裂产生了一系列不同的气体分子,包括甲烷、乙烯、短链和中等链长的碎片。显而易见的是,这些气体分子的红外光谱相互之间具有部分重叠。为了对这些气体分子进行识别,可以观察图6显示的数据库气体光谱与24.4分钟时的释放气体光谱。图7显示了各种气体分子所对应的红外光谱强度曲线。 上述气体释放结束之后,从27分钟开始直到测试过程结束,,可以检测到二氧化碳和微量的一氧化碳的释放。 图1.释放气体的红外光谱。 图2.峰A显示了-CH,和-CH,的伸缩振动吸收峰,还可以看到CO,的吸收峰。 本实验所用热重分析仪为PyrisTM1 TGA。 PerkinElmer可以同时提供热分析仪器和红外光谱分析仪器,能够更好更全面地对样品进行表征。 图3.释放气体的红外光谱强度曲线。 图4.与峰A叠加在一起的HCl气体的红外光谱。 图5.扣除峰A后的HCl气体的特征谱带。 图7.释放气体红外光谱强度曲线的叠加。 图8.二氧化碳的红外光谱。 图9.二氧化碳和微量一氧化碳的红外光谱强度曲线。 附录显示了热重-红外光谱联用技术分析结果的几种图形表示方式,为了节约空间而没有在前面几页中给出。 显示了HCl气体产生过程的赝彩色图像。 中心在2950 cm'的红外光谱吸收谱带的堆积图(21.5 min ~ 28.0min) 。 珀金埃尔默仪器(上海)有限公司 地址:上海张江高科技园区张衡路1670号邮编:201203电话:021-60645888传真:021-60645999www.perkinelmer.com.cn 要获取全球办事处的完整列表,请访问http://www.perkinelmer.com.cn/AboutUs/ContactUs/ContactUs APPLICATIONN O T E FT-IR Spectroscopy and Thermogravimetric Analysis Authors Dale C. Mann, BS Keith G. Cline,PE MDE,Inc 700 S. Industrial Way Seattle, WA 98108 Confirmation of the Presenceof Styrene Butadiene Resin(SBR) Polymer in DrywallPrimer Applications. A combination of Fourier Transform Infrared (FT-IR)Spectrometry and Thermogravimetric Analysis (TGA) wasused to distinguish and identify styrene butadiene frompolyvinyl acrylic resin-based interior latex primers andpaints. A wide range of standard mixtures of the two resinswere analyzed and the relative percentages of the twoaccurately estimated using the two methods. The isolationtechniques and analytical methods of analysis were devel-oped to verify the composition of primer/texture/paintapplications used on interior condominium walls. Introduction Over the past several years, architects and developers of condominium housing projects in westernWashington have begun to utilize the Washington State’s Energy Codel allowing a rated vaporbarrier primer/paint to replace the traditional polyethylene plastic sheeting or Kraft-backed insulationbats historically used in the construction to achieve the required water vapor perm rating of 1.0 orless. Building specifications for the interior wall finish called for the application of a vapor barrierrated primer followed by the normal decorative paint/top coat. A literature review of many major paint distributors of interior vapor barrier primers shows theresin in the vapor barrier primers is a styrene butadiene rubber (SBR) formulation. This formulationis quite different from the normal drywall primer, polyvinyl acrylic (PVA). Litigation involving theperceived lack of a SBR primer on interior drywall surfaces soon led MDE Forensic Laboratories todevelop methods to positively identify the presence/absence of an SBR primer after a PVA top coathad been applied to the walls. Cross sections of the texture, primer and paint applied to theinterior of the drywall were prepared by mounting specimensin acrylic and polishing. Examination of these samplesshowed the presence of a primer layer applied to the drywall,followed by a texture and finally the decorative top coatpaint. The primer layer exhibited an average dry film thicknessthat met all manufacturers' specifications, regardless of thepotential resin formulation of the primer. Fourier Transform Infrared Spectrometry The decorative top coat and texture were physically separatedfrom the primer layer. The primer layer and uppermost layerof drywall paper were peeled off and ultrasonically extractedusing a 50/50 mixture of tetrahydrofuran/methylene chloridesolvent. The solvent was evaporated to dryness and theisolated primer resin analyzed using FT-IR23. FT-IR results for pure SBR and PVA resins are shown in Figure 1.The predominant absorbances for an SBR resin, resultingfrom the styrene content, are at 700 and 730 cm-1. Figure 2illustrates some typical results from the extracted condo-minium primer layers. Many of these did not yield pure SBRspectra, however absorbances typically due to styrene werereadily detected in all extractions. The primary absorbancesin these spectra appeared to be due to the co-extractedpresence of a quantity of PVA resin. Note that a PVA resindecorative top coat was originally present on each sample. Figure 1. FT-IR comparison of a pure PVA resin (top) and a pure SBR resin(bottom). cm Figure 2. Examples of three “typical"FT-IR results from the solvent extraction ofisolated primer layers from three separate condominium units. Note the lack of adefinitive SBR spectra but the presence of a styrene absorption at 700 cm. Thermogravimetric Analysis Resins extracted from both PVA and SBR formulated paintswere analyzed using TGA4,5,6. The samples were analyzedusing nitrogen gas and a temperature program of 25-600 ℃with a 20℃/min ramp. This temperature program causedthe complete pyrolysis of the paint resin samples. Evaluationof the data showed distinctly different slopes in the weightloss versus temperature curves. The first derivative of thesecurves was used to identify the inflection points.The tem-peratures of these inflection points were found to be 350℃for the PVA resin and 425 ℃ for the SBR resin. Figure 3illustrates the first order weight loss curve and the firstderivative of that curve for both pure SBR and PVA resins. Pyrolysis Gas Chromatography/Mass Spectrometry Pyrolysis GC/MS methodology was also investigated as ameans of verifying the presence of SBR by using the pres-ence of styrene. However, it was found that small amountsof styrene were produced during the pyrolysis of PVA resin.This artifact and the desire to use available instrumentationled us to not pursue this methodology. Figure 3. TGA comparison of a pure PVA resin (top) and a pure SBR resin(bottom). The weight loss vs. temperature is shown in blue and the 1st derivativeof that curve is shown in red. Pure SBR and PVA resins were extracted from exemplarprimer and paint products. The purity of the resultingevaporated extracts was evaluated using FT-IR and TGA.Mixtures of the two were made by adding a weighedamount of each resin, dissolving in solvent to homogenizeand drying for analysis. The standard mixtures were 0%,10%, 30%, 50%,70%,90% and 100% of SBR resin in PVA. These mixtures wereanalyzed using both FT-IR and TGA. The ratio of the peakheight at 700 cm1(the styrene absorption for the SBR) tothe 1740 cm1(the carbonyl adsorption for the PVA) wasused to estimate the relative amounts of the two resins.Figure 4 illustrates typical FT-IR results and Figure 5 depictsthe resulting calibration curve. The standard mixtures were likewise analyzed using TGA.The ratio of the peak heights of the second derivative plotsat 425℃ (for the SBR) to the 350℃ (for the PVA) was usedto estimate the relative amounts of the two resins in themixture. Figure 6 illustrates typical TGA 1st derivative plotsand Figure 7 depicts the resulting calibration curve using thelog of the ratio of the peak heights of these curves. Subject Samples Samples isolated for the several condominium projectsevaluated during the course of the investigations yielded a wide range of FT-IR and TGA results.In some instances, a SBR was easilyand cleanly confirmed by bothanalytical methods. In other condo-minium projects evidence of SBR wasmuch less pronounced. Figures 2 and8 depict the range of FT-IR and TGAresults for some of these investigations. Some "contamination”of thephysically isolated primer layer by theoverlying PVA paint was expecteddue to the difficulty of mechanicallyseparating the coating layers duringsample preparation. This was par-ticularly true when the primer andpaint had been applied without anintervening layer of texture. For someprojects only low relative concentra-tions of SBR were calculated, evenwhen it was thought a "clean"isolation of the primer layer wasperformed. Figure S. Calibration curve for the FT-IR analysis of standard mixtures of SBR and PVA. Peakheight ratios are the SBR/styrene absorbance at 700 cmdivided by the PVA/carbonylabsorbance at 1732cm. As laboratory work progressed during these investigations, many ofthe locally available drywall primers (both vapor barrier products andtraditional drywall primers) were analyzed. Though not clearly specifiedon product labels or in the product technical data sheets, it becameapparent during the laboratory analysis that many primers labeled asvapor barrier products were actually a blend of SBR and PVA resins.At least one manufacturer alluded to this in their product information.Figures 9 and 10 depict the FT-IR and TGA results for a variety ofexemplar vapor barrier primers. Calculation of the relative amount of SBR to PVA in the analyzedexemplar primers showed a range from 100% SBR to 20% SBR. Inone condominium project, the calculated SBR in the isolated primerlayer never exceeded 20%. The primer that was later confirmed tohave been used as the vapor barrier was a blended resin containingonly 20% SBR. This information was only confirmed after the labora-tory results were used as motivation to persuade the manufacturer torelease their formulation. Summary The combination of FT-IR and TGA analysis of vapor barrier primers is apowerful analytical method useful for confirming the presence/absenceof a styrene butadiene resin in the primer. A semi-quantitative estimateof the relative amount of the SBR compared to the more traditionallyused PVA resin is possible. Figure 6. TGA comparison (using 1st derivative of weight losscurve) of standard mixtures of SBR and PVA resins. From top tobottom, the SBR/PVA ratios are 90/10(A), 70/30(B), S0/S0 (C),30/70 (D) and 10/90 (E). Figure 7. Calibration curve for the TGA analysis of standard mixtures of SBR andPVA. Calculated ratios are the SBR/1st derivative peak height at 425 °C dividedby the PVA/1st derivative peak height at 350°C. Figure 8. Examples of three"typical"TGA 1st derivative results from the solventextraction of isolated primer layers from three separate condominium units. Figure 9. FT-IR spectra of four different brands of vapor barrier primer. Each is amixture of SBRand PVA resins. References 1. Washington State Energy Code, 502.1.6.1-4, 1994. 2.ASTMD3168-85(2005) Standard Practice for QualitativeIdentification of Polymers in Emulsion Paints, 2005. 3. Kolske, Joseph V. Paint and Coating Testing Manual,Chapter 75:850-852, 1995. 4. Earnst, C.M, Ed. The Compositional Analysis by Thermo-gravimetry, STP 977, ASTM@, 1988. 5. ASTM E1131-03 Standard Test Method for CompositionalAnalysis by Thermogravimetry, 2003. 6. ASTM@E2008-06 Standard Test Method for Volatility Rateby Thermogravimetry, 2006. 46700870837AM Figure 10. TGA 1st derivative curves of three different brands of vapor barrier primer.Each is a mixture of SBR and PVA resins. PerkinElmer, Inc. 940 Winter StreetWaltham, MA 02451 USAP: (800) 762-4000 or(+1) 203-925-4602 www.perkinelmer.com PerkinElmer For a complete listing of our global offices, visit www.perkinelmer.com/ContactUs ( C opyrigh t C 2 009-2010, PerkinElm e r , I n c . All r ig h ts res e rved. Per k in E l m er i s a r e g i s tered trad e mark o f Pe rki n Elm e r , I nc. A l l o t h e r trademarks a r e th e proper t y of the i r r e spe c tive owner s . ) Polymer CrystallinityStudies by DSC-Raman Spectroscopy Differential scanning calorimetry (DSC) and Raman spectroscopy areboth used to investigate crystallinity but in rather different ways.DSC can determine the degree of crystallinity very precisely and canalso follow the kinetics of crystallization by measuring the associatedenthalpy changes. Because of its ability to rapidly stabilize at temperatureand its heating and cooling rates of up to 750 ℃/min in control, thePerkinElmer DSC 8000 or 8500 is often used for crystallization studies.Since the double-furnace design allows precise control at true isothermaltemperatures, isothermal studies are best carried out in this model.Raman spectra of crystalline and non-crystalline forms generally differ with the bands of the former being much narrower. Additional possibilities provided by Raman are tomonitor very slow changes and also to identify situations where crystallization leads to a mixture of forms.As the PerkinElmer RamanStation" 400 and RamanFlexlines allow the timing of its laser pulses to beadjusted, the collection of the Raman spectra can be tuned to match the scanning rate. Simultaneousmeasurements remove the uncertainties that arise when the behavior of the material may depend onthe thermal history of the sample. Semi-crystalline polyethylene oxide illustrates the complementary nature of the two techniques. Thismaterial has a variety of clinical applications and is widely used in consumer products such as toothpaste.A sample was heated from 10℃ to 75℃ through melting, then cooled back to 10℃ and the cycle wasrepeated. The maximum of the melting peak is at 70.0℃ in the first cycle and at 66.7C in the second.The heat of fusion is also lower in the second heating (Figure 1 -Page 2). This implies that the initialmelting and solidification increases the proportion of amorphous material. Raman spectra were obtained at 5-second intervals duringthe DSC runs. In the spectrum after the first heat/cool cycle,there are broad features associated with the amorphouscomponent (Figure 2). The difference between the spectrabefore and after the first cycle is obtained by subtraction.Although noisy, it is very similar to the spectra obtainedfrom the melt, which is amorphous. So the Raman spectraconfirm directly the inference from the DSC data that thefirst heat/cool cycle increases the amorphous content.Spectra of crystalline and amorphous components canbe obtained from these data (Figure 3 - Page 3). Polyethylene terephthalate (PET) has been much studied byboth techniques. The sample examined here has significantamorphous content after rapid cooling from the melt. Theheat-flow curve shows a glass transition (Tg) at around 70℃,crystallization, and then melting at 270℃ (Figure 4- Page 3).Changes in the Raman spectra are small but can be followedby using principal components analysis (PCA). Analysis of the1727 cmC=0 Raman band gives two principal components:PC 1 has the shape of a first derivative, corresponding to aband shift and PC 2 is second-derivative shape representinga change in peak width. The temperature profile for thepeak-width change clearly matches that for crystallizationand melting. However, the temperature profile for the peakshift does not correspond to the events seen in the DSCheat-flow curve but reflects a continuous shift to lowerfrequency with increasing temperature. Figure1. DSC run of polyethylene oxide (PEO). The first and second cycleshave been offset for clarity. Isothermal crystallization is readily monitored by DSC orRaman spectroscopy, with DSC being ideal for rapid processeswhile Raman is applicable even when crystallization is veryslow. The comparability of the data from the two techniquesis seen in a study of two blown polyethylene films, one ofwhich was from a batch of bad material. Crystallization at121℃ was measured after rapid cooling at 500℃/min fromthe melt. This type of experiment requires a HyperDSC@_capable instrument like the DSC 8500 to cool rapidly andstill precisely come to the isothermal holding temperature.After a stabilization transient, the DSC data (Figure 5a -Page 3) show that the bad material crystallizes more rap-idly and with higher enthalpy than the good material. TheRaman data (Figure 5b - Page 3) are shown for the initialheating and cooling of the samples as well as the isothermalperiod. In this case, a factor score from PCA is directlyrelated to crystallinity. Here too the bad material is seen tocrystallize more rapidly and also achieves a higher degree ofcrystallinity than the good material. From both sets of data,it appears that the final degree of crystallinity in the badmaterial is about 50% higher than the good. In both cases,the final degree of crystallinity is much lower than in thestarting materials. DSC-Raman spectroscopy allows us to precisely probe thecrystallization behavior of polymers under various thermalconditions and correlate the energy changes from the DSCto changes in structure as seen in the Raman. This approachallows precise correlation of the two methods and promisesa greater understanding of crystallization behavior. Figure 2. Spectra from DSC run of PEO. Figure 3. Raman spectra of crystalline and amorphous PEO. Figure Sa. DSC of HDPE isothermal crystallization. Temperature/℃ Figure Sb. Raman of HDPE melting and isothermal crystallization. Figure 4. DSC and Raman data for PET. PerkinElmer, Inc. 940 Winter StreetWaltham, MA 02451 USAP: (800) 762-4000 or(+1)203-925-4602 www.perkinelmer.com PerkinElmer For a complete listing of our global offices, visit www.perkinelmer.com/ContactUs Copyright O2009, PerkinElmer, Inc. All rights reserved. PerkinElmer@ is a registered trademark of PerkinElmer, Inc. All other trademarks are the property of their respective owners. APPLICATION NOTE Thermogravimetric Analysis -GC Mass Spectrometry Author GregJohnsonPerkinElmer, Inc.Shelton, CT 06484 USA Qualitative Analysisof Evolved Gases inThermogravimetry byGas Chromatography/Mass Spectrometry Thermogravimetric analysis (TGA)measures the change in the weight ofa sample as a function of temperature.A limitation of TGA is that it cannot identifywhat material is lost at a specific tempera-ture. The analysis of gases evolved duringa TGA experiment by gas chromatographymass spectrometry (GC/MS) provideslaboratories with a way to identify thecompound or groups of compoundsevolved during a specific weight-lossevent in a TGA analysis. This application note discusses the utility of TG-GC/MS with an exampleapplication - the identification of specific organic acids evolved during TGAanalysis of switchgrass. Figure 1. Clarus 600 GC/MS interfaced to the Pyris 1 TGA. Switchgrass (Panicum Irgatum) is a perennial warm-seasongrass native to the northern states of the USA; it is easilygrown in difficult soils. Switchgrass is potentially useful inthe production of biofuels, specifically cellulosic ethanoland bio-oil. The instrumentation used in this study was a PerkinElmer@Pyris 1 TGA interfaced to the PerkinElmer Clarus 600 GC/MS with the S-Swafer micro-channel flow splitting device(S4 configuration). The preferred mode of operation of theTGA maintains the atmosphere around the sample at ambi-ent atmospheric pressure. The sample is collected from theTGA by allowing the high vacuum of the MS to create apressure drop across the GC column, causing a flow of gasfrom the TGA through the transfer line and the analyticalcolumn to the MS. During the analysis, there are times whenthe TGA inlet will be surrounded by air, rather than an inertatmosphere. This would cause air to flow into the GC/MS; thisis undesirable as it will cause oxidation to a number of dif-ferent areas of the system. The S-Swafer device (shown inFigure 2) is used to switch between backflushing of theTGA transfer line during non-sampling time and samplingof the TGA environment during analysis. Figure 2. Schematic showing the pneumatic interfacing of the TG-GC/MSusing the S-Swafer. Figure 3 describes in greater detail the pneumatic supplyto the S-Swafer device and assists in explaining why thisapproach is so well suited to interfacing the Pyris 1 TGAto the Clarus 600 GC/MS. Figure 3. Schematic showing carrier-gas supply to the S-Swafer device. The S-Swafer configuration is optimal because it will ensurea very rapid adjustment of carrier gas to the Swafer device,allowing for a rapid switch between backflush of the transferline and sampling from the TGA. The samples of evolved gasare collected by setting a simple parameter in the GC method;multiple samples can be collected during a TGA analysis.Additionally, backflush of the transfer line will isolate theGC/MS and enable purge gas at the TGA to be switchedfrom an inert gas (during analysis) to an air supply forcleaning of the TGA pan prior to the next sample. Oven subambient cooling will be extremely useful in thisapplication, allowing protracted sampling periods to berefocused into a narrow band of analytes on the column. Experimental The deactivated fused-silica transfer line used here was1.6 m x 0.32 mm i.d. A few centimeters of the deactivatedfused silica protrudes into the sample weighing area of theTGA. Approximately 30 cm of fused silica passes throughthe injector into the oven environment and is connected tothe S-Swafer using specialized SilTite""nuts and ferrules toensure a leak-free connection that will not shrink and leakduring normal or even extended thermal cycling of the mainoven. In all cases, a 30 m x 0.32 mm analytical column wasemployed as this allows a carrier flow of approximately1 mL/min with the fixed 1.00 atmosphere pressure dropfrom ambient at the TGA to vacuum at the MS. Data wasacquired using an EliteWAX stationary phase. A small quantity of dried and ground switchgrass wasplaced on the TGA pan and weighed using Pyris software.A rapid TGA analysis based on heating the sample from30 ℃ to 1000 ℃ at 100℃/min in a nitrogen atmospherewas performed to determine which regions of the weight-loss curve were to be further studied using the TG-GC/MStechnique. The primary reason for using such rapid heating, whichreduces the resolution of the weight-loss curve producedby the TGA, is to transfer the evolved gas quickly into theGC column. A quick transfer will improve GC peak shape,sensitivity and resolution. After the sample was loaded onto the TGA and the furnaceraised,the analysis was started immediately. The first step inthe TGA heating program maintained the low initial furnacetemperature for 5 to 10 min. During this time, the furnaceenvironment is being purged with helium (or nitrogen/argon),and the carrier-gas pressure of 7.0 psig maintained at Aux 1(Figures 2 and 3) ensures that no sample can enter the ana-lytical column. After this initial hold period, the TGA furnacebegins to heat the sample,and simultaneously, the GC/MSrun is started using an external start command. Based on previous TGA runs on the same sample, timedevents within the GC method switch off the carrier gassupplied by the Aux 1 PPC module and then close thesolenoid valve (SV3) shown in Figure 2 (Page 2). This beginsthe sampling and this procedure is reversed to bring the sam-pling period to an end. After the sampling is complete, boththe GC oven-temperature program and MS data acquisitionbegins. The TGA can now be programmed to switch purgegases to clean the system using oxidation at elevatedtemperature, prior to the next analysis. A typical TGA weight-loss curve for the switchgrass is shownin Figure 4 and reveals a typical weight % loss curve for thesample of switchgrass that was tested. In addition, super-imposed on the weight-loss curve is the derivative of thiscurve which greatly assists the analyst in setting up the GC timed events that will be used to sample the evolved gasesonto the GC/MS column. Note that the TGA is held iso-thermal for the first 5.0 min at which point heating begins.Simultaneously, the GC/MS analysis is started. Figure 5 illustrates the TG-GC/MS analysis of the switch-grass based on timed events that collect the evolved gasesfrom the main transition shown in Figure 4. The smallerearlier transition, also seen in the same figure, was also sampledonto the GC/MS but preliminary findings indicate that thisis simply evolved water. The major transition produced largenumbers of oxygenated volatile organic compounds (VOCs),including some very polar species. Earlier work using a non-polar capillary column had generated extremely smeared-outearly-eluting peaks. The chromatogram below was generatedusing a thick-film polar Elite WAX column. Figure S. TG-GC/MS analysis ofthe switchgrass sample on a 30 mx 0.32 mmx1 um Elite WAX column. The three peaks labeled with asterisks in Figure 5 are identifiedas a homologous series of free fatty acids (Figure 6-Page 4),based on a library search of their MS spectra (NIST@ 2008).Usually in GC, a homologous series tends to elute in carbon-number order but here, the elution order appears to beacetic, followed by formic, followed by propanonic acid. Asthis retention behavior is not typical and in the absence of aliterature reference or a similar chromatogram in the publicdomain, it seemed prudent to analyze a simple retention-time standard to confirm this tentative result. Figure 7 (Page 4)shows the same analysis again but with the retention-timestandard shown in parallel. This standard was a simplemixture diluted in water with a small (5 uL) aliquot of thisaqueous solution deposited by syringe onto the TGA panfor analysis. Figure 6. Mass spectra extracted from the total ion chromatogram of theswitchgrass sample. The spectral data matches that of acetic, formic andpropionic acid respectively available in the 2008 NISTmass spectral library. Figure 7. TG-GC/MS analysis ofthe switchgrass sample (bottom) on a30 mx 0.32 mm x1 um Elite WAX column and the analysis of a simple retentiontime mix (top) under the same TGA and GC conditions. Conclusions In this application note, we describe the technique of TG-GC/MS through the analysis of switchgrass. TG-GC/MS isdemonstrated to be a valuable technique in the separationand identification of complex mixtures of gas evolved duringa TGA analysis. The S-Swafer device is demonstrated as ameans to interface a TGA to GC/MS. The main benefits areits simplicity and the inertness of the entire sample path. TG-MS;联用技术分析 EVA 引言 将热重分析仪(TGA)和质谱(MS)联用,进行逸出气分析,已成为热重分析中非常熟知的科研手段。本文中对一个有着两个明显转变的样品进行分析,表明MS 对逸出气体的鉴别非常方便。 实验部分 实验所用仪器为 PerkinElmer 的 Pyris1 TGA 热重分析仪,标准炉体。此热重分析仪事先在空气中加热,并使用镍和铁进行了温度校正。实验所用样品盘为氧化铝盘,气氛为氦气,根据实验中样品不同设置气体流速在5到40°C/min 之间。样品质量约为 10-15mg,使用软件 Pyris 9.0进行数据分析。 TG-MS 联用实验:将一根直径为0.1mm 的熔融石英传输线加热到210°C,用来直接将 TGA和PerkinElmer Clarus 600 质谱仪连接。质谱仪使 TurbMass GC/MS 软件进行数据分析。 结果讨论 在这个实验中,对乙烯醋酸乙烯酯共聚物(EVA)和逸出气体的成分进行了分析。图1显示了EVA 的热重分析谱图。 图1.EVA样品的热重分析 该热重谱图显示出两个重量损失峰,第一个峰对应着醋酸,第二个峰对应了聚合物骨架碎片。图2是MS对逸出气体的分析,图3用光谱数据进一步对醋酸进行了确定。 图2.对EVA 样品在热重分析中产生的逸出气体进行质谱分析 图 3.光谱数据进一步核实热重分析中第一阶段失重产生气体为乙酸 结论 热重分析可对材料在特定温度下的质量损失进行量化,将热重和质谱两种手段结合,能够识别在热分析中逸出的成分,为研究提高了有利证据。 PerkinElmer, Inc. 大中华区总部地址:上海张江高科园区李冰路67弄4号邮编:201203电话: (021)38769510传真: (021)38791316 www.perkinelmer.com.cn PerkinElmer ( 要获取全球办事处的完整列表,请访问 http:// www.perkinelmer.com.cn/AboutUs/ContactUs/ContactUs ) ( ◎2 009 Perkin E lme r, I n c. 保 留所有权利。P erki n Elmer 徽 标 和外观设计是P erki n Elmer的注册商标。 文中 提及的 其它非Perk in Elm er及其子公司所有的其它 商标均 为其各自所 有 者的财产。 ) ( Perkin E l m e r保留随时 更改此 文档的 权 利, 恕 不 另行 通 知。对于编辑 、 图 片或 排版错 误 概 不 承担任何责任。 ) TG-MS及 TG-GC/MS技术分析不同邻苯二甲酸含量的 PVC 引言 将热重分析仪(TGA)和质谱(MS)联用,进行逸出气分析,已成为热重分析中非常熟知的科研手段。对于复杂样品来说, TG-MS 几乎无法得到同时逸出的混合气体的数据。 而将热重和 GC/MS 联用,, 可以得到材料完整的特性,精确表征热重分析过程中产生的气体具体成份。本文将TG-MS 及 TG-GC/MS 的相对优势进行总结,如表1所示。 表1. TG-MS 和 TG-GC/MS优势比较 TG-MS TG-GC/MS 实时分析 序列分析 无分辨能力 可分析重叠事件 谱图库有限制 使用 GC谱图库提高分辨能力 氧气灵敏度 氧气灵敏度 可使用交替/复合检测器 使用简单 使用较复杂 实验部分 实验所用仪器为 Pyris1 TGA, Perkinelmer, 标准炉体,热重分析仪事先在空气中灼烧,并使用镍和铁进行了温度校正。实验所用样品盘为氧化铝盘,气氛为氦气,根据实验中样品不同设置气体流速在5到40°C/min之间。样品质量约为 10-15mg,使用软件 Pyris 9.0进行数据分析。 TG-GC/MS 联用实验中,采用 Perkinelmer Clarus 680 C GC/MS分析仪。在 TG-MS 联用中,将一根直径为0.1mm 的熔融石英传输线加热到210°C,直接和质谱仪连接。 TG-GC/MS 联用实验中,采用直径为 0.32mm 的熔融石英毛细管,注入 GC 的注射舱中。注射管与 Elite"-1ms 毛细管气相色谱柱相连。两个实验中,均使用TurbMassGC/MS软件,进行数据分析。 结果讨论 在这个例子中,聚氯乙烯(PVC)与二种不同类型的邻苯二甲酸盐进行合成。一一种是规整排列的 Disiononyl邻苯二甲酸盐(DINP), 另一种是非规整排列的邻苯二甲酸盐,为的是得到不同结构的邻苯二甲酸盐能否由于类型不同而有所差别。 图1是两种不同的聚氯乙烯样品的热重谱图,紫色线为含 DINP 的 PVC 样品的热重曲线,其中第一个失重峰对应了50.99%的重量损失。绿色线为含不规整邻苯二甲酸盐的 PVC样品热重曲线,对应了64.82%的重量损失。 图1.两种不同聚氯乙烯样品的 TGA 失重百分比曲线。,一种为含 DINP 的 PVC样品,失重50.998%(紫线);;一种含不规整邻苯二甲酸盐的 PVC 样品,失重64.825%(绿线)。 从热重曲线中可看到两种材料的明显差异,这可能是添加剂种类不同或者添加量不同所导致的 PVC 薄膜特定的物理性能的改变。 将每个样品逸出气体用MS和GC/MS分析,以确定这种方法是否可以证实规整和非规整的邻苯二甲酸盐的存在与否。图2为两种样品分析得到的 MS数据。 图2.在热重分析中产生的逸出气体进行质谱分析,顶部紫色线为含 DINP 的 PVC样品,底部的绿线为含不规整邻苯二甲酸盐的PVC样品。 在图2中,对 TGA 逸出气体的质谱分析结果差别很小,两个明显的失重峰是由于许多碎片离子同时作用生成气体得到的。由此可见, TGG- MS 联用手段对相对简单的逸出气分析是比较有用的,但这里需要用更好的分辨率来确定逸出气成分。 再次进行热重分析试验,但这次样品第一次失重产生的气体被收集和引到色谱柱里。这将对逸出气体更好的进行分辨,更好地识别特定的成分。图3显示了热重第一次失重中产生气体的色谱分析。由图可见,逸出气体成分相当复杂,许多未被识别。这样,可以区分出 TGA 逸气气体的不同,尤其值得注意的是30分钟左右出现的峰,这些峰充分反应了 m/z149--与邻苯二甲酸盐相关联的离子。进一步工作需要来确定这种方法能否定性和/或提供定量数据的分析,但很明显的, TG-GC/MS 提供的信息要比TG - MS 更加多样。 图3. TG-GC / MS收集 PVC 样品的数据,含DINP(紫色-顶部)及不规整邻苯二甲酸盐(绿色-底部)。在大约30分钟附近有明显的邻苯二甲酸盐特征的初步确定峰。 结论 TGA分析可以对材料在特定温度下的重量损失进行量化。质谱分析可以得到热分析中逸出气体的具体成分,来增强分析能力。但是,如果多种复杂气体同时逸出,在质谱数据中就很难解释了。 TG-GC/MS 联用手段增加了逸出气体的色谱分离,使气体成分得到识别,数据解释比TG-MS 联用技术更加容易。 PerkinElmer, Inc. 大中华区总部 地址:上海张江高科园区李冰路67弄4号 邮编:201203 电话:(021)38769510 传真: (021)387 91316 www.perkinelmer.com.cn PerkinElmer ( 要获取全球办事处的完整列表,请访问 http:// www.perkinelmer.com.cn/AboutUs/ContactUs/ContactUs ) ( O2 009 PerkinElme r, I n c . 保 留 所 有 权利。Pe rkinE l mer徽 标和外观设计是Pe rkin E lmer的注册商标。文中 提及 的其 它 非 Per k i nElmer及其 子 公司所有的其它商 标 均为其各 自 所 有 者的财产。 Perkin Elm e r保留随时 更改 此文档 的 权利,恕不另 行 通 知。对于编辑、图片 或 排版错误概 不 承担任何责任。 ) UV-DSC Studyon New DoubleFurnace DSC The UV curing of resins is important in materialsscience. Direct energy measurement and true isothermaloperation are essential to a successful UV curingexperiment. Since the UV curing reaction is fast, afast response DSC is needed to capture the process.The double-furnace power-controlled DSC 8000/8500 with UV accessory is the ideal tool to study the UV curing process and to characterize the material properties before and after the UV curing. Introduction The major benefit of ultraviolet (UV) curing is that it is a cure-on-demand process.The photo-sensitive material will not cure until the UV light hits it, and whenthat occurs, it takes only a short time to cure. The process is fast, solvent-free,and economical. UV curing brings many benefits to product manufacturers.Among these are ease of use, process consistency and flexibility, reducedenvironmental considerations and the availability of high performance materials.The application of UV curing material is very broad. It includes adhesive, clearprotective coatings, inks, dental material and pharmaceutical material. Cureconditions can favorably impact the performance properties of many UV-curingmaterials. However, both undercuring and overcuring should be avoided. DSC(Differential Scanning Calorimetry), together with a UV accessory can be usedeffectively to study UV curing reactions. In particular, it can be used to study curing time, curing enthalpy, the effect of light source(wavelength, intensity), photo initiator concentration, curingtemperature and purge gas (nitrogen or oxygen) etc. Thenew PerkinElmer double-furnace power-controlled DSC isthe ideal tool for the UV curing study because of its uniquefeatures compared with conventional heat flux DSC. It canperform true isothermal operation so that it can keep thesample temperature constant during the UV curing reaction.It has a fast response time so that it can capture the fastreaction of UV curing. It also measures the energy directly foraccurate enthalpy results. This note will use a UV curing resinused in removable dental appliances as an example todemonstrate this application on the new power-controlledDSC 8000/8500. Experimental details such as samplepreparation, method setup, data process and systemoptimization will be discussed. The effect of light intensityand isothermal temperature on curing will be studied. Experimental The instrument used is the new PerkinElmer powercontrolled DSC 8000/8500. The cooling accessory is theIntracooler III which is a new mechanical refrigerator for theDSC 8000/8500. It offers -100 ℃ as the lowest programtemperature and can remove heat efficiently from a UVexperiment. As a general rule, the cooling block temperatureshould be at least 30 C lower than the isothermal temperatureat which the curing is to be carried out. The UV light sourceis the OmniCure@ 2000 (Figure 1). It comes with a 200 Wmercury lamp and a bandwidth filter of 250 nm to 450 nm.For the DSC 8500/8000, the intensity range can be variedfrom approximately 2 mW/cm² (~1% iris opening) to about180 mW/cm²(~70%). The light source is connected to thecomputer through a relay box which can be triggered by thePyris software. The sample is a fiber filled dental resin. It is a translucent,pink paste (Figure 2). Another optical adhesive sample withfaster curing and higher curing energy is used for comparisonpurpose. The curing experiment is conducted under isothermalconditions. Different experiment parameters includingisothermal temperature and iris opening were used toinvestigate their effects on curing profile. The glass transitiontemperature (Tg) before and after the curing was also checked. Figure 1. Picture of DSC 8000/8500 with the OmniCure 2000 UV accessoryshowing sample and reference light guides. Figure 2. Picture of the fiber filled dental resin used for the UV curingexperiment. Results The sample weight must be optimized for each individualsample type depending on the kinetics of the curing reactionand the energy released during the curing. Basically, thegreater the energy conversion and the faster the reaction,the smaller the sample should be. So 1 mg or less isrecommended for samples like lacquers, printing inks andother fast-reacting systems with a high energy conversion.Several mg is appropriate for dental fillings or similar materials.In this experiment, about 3 mg sample was used. Since thesample is a paste, it needs to be spread as evenly as possibleover the bottom of the sample pan. The thickness of thelayer has a significant influence on the analysis results andreproducibility. Table 1. Typical UV curing samples and sizes. Sample size (mg) Sample types 1 mg or less lacquers, printing inks Several mg dental fillings The heat flow signal will be changed when the shutter isopen due to UV energy flowing to the pan. In order tominimize this effect, the heights of the sample and referencelight guides need to be adjusted to give a near zero heatflow change on irradiation. As can be seen in Figure 3, therewas a big baseline shift when the shutter opened. By usingthe thumbscrews to raise or lower the light guides, the heatflow can be brought back to the original level. Figure 3. Adjust the heat flow baseline using the thumbscrews. As a general rule, the light intensity should increase withthe opacity of the sample and the thickness of the layer.The light intensity can be adjusted by opening the iris onthe OmniCure@ 2000 system. Since the DSC 8000/8500measures energy directly, it is possible to estimate the lightintensity by using graphite disk to adsorb the light energy.For such measurement, the graphite disks are inserted intothe sample side and reference side. During irradiation,the reference side is covered with a piece of white paper.Figure 4 showed the results with the iris open 5%, 10% and15%. With the iris 15% open, the heat flow change is about6 mW. This value, divided by the surface area of the graphitedisk (approximately 0.39 cm²), gives the value of the lightintensity of 15.4 mW/cm. Because here the sample istranslucent, a relatively big iris opening (15%) was usedfor the curing experiment. Figure 4. Light intensity determination by graphite disks. For best results, two measurements under identicalconditions are recommended in order to offset the baselineshift due to the light irradiation. The first run records theUV curing reaction. The second run helps to confirm if thecuring reaction is complete (no exothermic peak observed)and establish the baseline shift due to light irradiation.Subtraction of the second run from the first run can eliminateany possible baseline shift and give an accurate calculationof curing energy (Figure 5). For all the following UV curingdata, subtraction of a second run was performed. Figure S. UV curing data process for the dental resin sample. The uncured dental material has a subambient glass transitiontemperature. The Tg was determined by running a heatingscan from -80℃ to 30℃ at 50 ℃/min. The data (Figure 6) shows a Tg at-27℃. Since the curing process will changethe Tg behavior, by comparing the Tg before and aftercuring, the effect of curing on Tg can be studied. Figure 6. Uncured dental material showing a Tg at-27 °C. Different UV curing materials may have quite different curing kinetics/energy based on their domain of application.The dental resin needs to be cured relatively fast and lowcuring energy is desirable. The UV curable optical adhesiveis designed to cure very quickly and high energy is releasedto give a tough resilient bond. UV-DSC experiments can beused easily to show the different curing behaviors. Figure 7demonstrates the different curing profile of dental resin andoptical adhesive at 30 ℃ with 15% iris opening. The opticaladhesive is cured faster than dental resin and has muchmore energy released (189 J/g vs. 44 J/g). Figure 7. UV curing data at 30°C with 15% iris, dental resin(red) vs. opticaladhesive (black) showing different peak time and energy. The curing reaction will change the Tg behavior. With theincreasing curing time, the curing degree will increase andthe original Tg of uncured material will diminish. A partialUV curing experiment was conducted on dental resin withthe curing time of 0, 0.1,0.2, 0.3, 0.5, 1, 2 and 4 min. Theoriginal Tg was checked after each UV curing period. As canbe seen in Figure 8, the Tg strongly diminished with increasingUV exposure time. After 0.5 min curing, the Tg has becomedifficult to see. Figure 8. Heating curve after partial UV curing for 0, 0.1, 0.2, 0.3,0.5,1, 2 and4 min, showing the diminishing Tg of uncured material after UV curing. After the dental resin was UV cured fully at 30℃, a heatingscan from -80℃ to 145℃ was performed (Figure 9). Thesubambient Tg of uncured resin has disappeared. The 1stheating shows a residual curing above the UV curing temperatureand finally a small Tg around 128℃ of the cured resin. The2nd heating curve indicates no residual curing and the Tg ofcured resin as expected. Figure 9. 1st and 2nd heating curves after UV curing, showing residue curing andTg after that. Two important parameters for UV curing experiments are lightintensity and isothermal temperature under which the UV curing isconducted. Their effects on curing behavior of dental resin arestudied. The effect of light intensity was studied by adjusting theiris opening from 5% to 25% (Figure 11) and three isothermal Figure 10. Effect of light intensity with iris opening at 5% (blue), 15% (black)and 25% (pink) at 30 °C on dental resin. Figure 11. Effect of isothermal temperature at 10 ℃ (green), 30C (blue),50 °C (black) on dental resin curing with 15% iris opening. temperatures 10℃, 30 ℃ and 50℃ were used to study itsinfluence on curing profile (Figure 12). Clearly both factors havea big effect on the curing profile. Increasing light intensity orisothermal temperature will shorten the UV curing time andincrease the degree of curing generally as shown by Figures 10and 11. Summary The UV curing of the dental resin can be studied on the newDSC 8000/8500 with UV accessory. Since the UV curing reactionis usually fast, a fast response DSC is needed to capture thecuring process. In addition, direct energy measurement andtrue isothermal operation are essential to a successful UVcuring experiment. The light source can be easy controlled bythe Pyris software. The double furnace power controlled DSC8000/8500 with UV accessory is the ideal tool to study theUV curing process and to characterize the material propertiesbefore and after UV curing. Appendix - control software interface A typical method is shown below (Figure 12). A key part ofthe method is to use the "trigger an external event"actions.to switch the external channel used by the OmniCure@ 2000curing system On and Off, to open and close the lamp shutter.Four switch external channel actions must be included in themethod to trigger the lamp shutter open and close at theend of the irradiation time. In the method here, a 10 minuteisothermal hold was used. During the isothermal period, thelamp shutter was opened and UV curing started at 1 minuteThe shutter was closed at 8 minutes for a 7 minute UV curingexperiment. Figure 12. A typical UV curing method window. Note the parameters set by theuser. APPLICATIONNOTE Thermogravimetric- Infrared Analysis Authors Maria Grazia GaravagliaPeng YePerkinElmer, Inc.Shelton, CT 06484 USA PlasticizerCharacterizationby TG-IR Plasticizers are additives that are added to polymeric material toincrease flexibility. For example, phthalates are usually added tohard PVC plastics to make it soft. Many properties of the polymerwill be changed by the addition of a plasticizer, such as the glasstransition temperature (Tg) which will be reduced dramatically;the hardness which will be reduced; the strength which willdecrease and the processability which will be improved. Since plasticizer is often made up of small molecules, it will migrate to the surface and evaporatefrom the polymer matrix over time or upon heating. One common example is the smell of anew car which is caused by the plasticizer evaporating from the car’s interior polymer parts.Because the plasticizer may be toxic and be harmful to human health, restrictions often applyto some types of phthalates such as in children’s toys in the United States and European Union.It may be important to know the plasticizer added to the polymer product and its content. Thermogravimetric analysis (TGA) is a common technique that is used to study the weightloss during heating. It can tell you the percentage of weight loss quantitatively and accurately.But TGA alone will not tell you anything about the chemical components of the evolved offgas. The hyphenation between TGA and FT-IR is able to identify the off gas from TGA andgive a more complete picture of material characterization. ln this note, the sample is a complex mixture of solvent, plasticizer and polymers from apaint and varnish producer who require data concerning the plasticizer and its percentage. A PerkinElmer Pyris" 1 TGA and Spectrum" 100 systemconnected by the state-of-the-art TL 8000 transfer linewas used for this analysis (Figure 1). Figure 1. The TL 8000 transfer line couples a Spectrum 100 FT-IR to a Pyris 1TGA. The advantages of this system include: Insulated heated transfer line with replaceable SilcoSteel@liner. DHPeated zero-gravity-effect 'ZGCell' gas cell for theSpectrum instrument incorporating automatic accessoryidentification, low volume, and efficient sample areapurging. · Control unit incorporating a mass flow controller, particlefilters, flow smoothing system, independent transfer lineand gas cell temperature controllers, and vacuum pumpwith exhaust line. Automatic triggering of IR data collection from the Pyrissoftware. Figure 2. TGA and its derivative curve.Red curve: sample without plasticizer; Blue curve: sample with about8% plasticizer. Figure 3. The IR spectrum at 13 minutes. Result Two samples were analyzed by TG-IR. The red TGA curve isthe sample without plasticizer; the blue TGA curve is the samesample with the addition of approximately 8% of plasticizer inFigure 2. The derivative of weight loss is also shown in orderto help identify the weight loss event. For the red curve, the first loss of weight is due to the solvents;the second loss is attributed to nitrocellulose polymer and thethird loss is due to polyurethane + polyacrylate polymers. Forthe blue curve, the first loss is from solvents; the second lossis again from nitrocellulose polymer; the third loss is supposedto be from the added plasticizer and the fourth loss is frompolyurethane + polyacrylate polymers. All components wereidentified from gaseous fragments in TG-IR. So by comparingthe red curve with the blue curve, it can be seen that the onlydifference is the weight loss due to plasticizer from the bluecurve. The content of plasticizer is determined to be 8.48%. Figure 4. Unknown plasticizer spectrum vs. reference spectrum. In order to identify the plasticizer, the IR spectrum is usedin Figure 3. The IR spectrum at 13 minutes is used becausefrom TGA curve it can be seen that the evolved gas at thispoint is from the plasticizer. By looking at this IR spectrumand comparing it to reference spectrum (Figure 4), it canbe shown that the plasticizer used here is citric acid,tributylester, acetate. Conclusion The TG-IR hyphenation technique has been widely used for thepolymer industry, in this case the identification of plasticizer inpaint. It combines the strength of TGA and FT-IR analysis andoffers a more comprehensive material characterization. ThePerkinElmer TG-IR system with the TL 8000 transfer line hasproven to be the ideal solution for this analysis. It is easy touse and its design features guarantee the highest quality andmost reliable results. www.perkinelmer.com PerkinElmer For a complete listing of our global offices, visit www.perkinelmer.com/ContactUs ( C opyright O 2010, P e rk i nEl mer , Inc . A ll rig h t s rese r ved. Perk i nElme r@ is a re gist e red tradem a rk of Pe r ki n E l m e r, Inc . All o t h er tr a demar k s a re the p roperty of t h eir respect i ve o wne r s. ) 摘要 应 用 文 章 Differential Scanning Calorimetry 作者 Wunpen Chonkaew, Peyman DehkordiKevin P. Menard,Witold Brostow,Noah MenardOsman Gencelb.e Department of Chemistry, Faculty of Science,King Mongkut's University of Technology Thonburi,Bangkok, Thailand Laboratory ofAdvanced Polymers & OptimizedMaterials (LAPOM), Department of Materials ScienceandEngineering and Center for Advanced Researchand Technology (CART), University of North Texas,Denton TX, USA e Digital Light Labs, Knoxville, TN, USA PerkinElmer, Inc., Shelton, CT USA °Department of Civil Engineering, Faculty ofEngineering, Bartin University, Turkey 在固化过程中,紫外(UV)光固化的高分子和复合材料表现出与热固化材料相似的收缩性质,随之出现产品变形的现象。本文,我们报道了关于光强度和温度对固化材料性质造成影响的研究结果。研究过程 中使用的测试方法包括紫外-差示 扫描量热((UV-DSC) 和紫外-动态热机械分析(UV-DMA)。 DMA中静态探针的位移被用于测量形变的程度。研究结果以时间-强度-转变 (TIT)图形以及强度、温度和时间的三维图形表示。采用高强度光线使样品经过凝胶点进行固化时,形变程度达到最大。采用低强度光线对样品进行固化直到样品凝胶化,然后用高强度光线完成固化过程,形变程度最小。 网络聚合物的应用非常广泛。1网络的形成被称为 ‘“交联"或者“固化”,对于天然橡胶来说也可以称为硫化”。本文将使用“固化”一词。环氧树脂2,3,4,5,6,7其他热固性聚合物以及基于热固性聚合物的复合材料8,9,10,11的固化过程需要外界提供热量,这一过程称为热固化。另外一种固化方式是光固化,或者被称为光线固化或者光学固化,共同之处是都需要使用辐射。紫外(UV)光是光固化过程中经常用的,有时候也可以使用电子束或者伽马射线12作为替代。无论是热固化还是光固化,体相材料、薄膜和涂层都可以进行固化。光引发聚合反应的优势在于:固化时间较短,挥发性有机物(VOC)含量较低,操作简单。13 光固化和热固化材料的一个共同问题是固化过程中样品的收缩。14对于航空复合材料来说,体积收缩率可以达到6%之多。收缩现象可能会显著地增加光固化材料的剩余应力和畸形部分,从而导致废品率的提高。解决这一问题需要涉及到很多因素。固化过程是时间和温度的函数,对于两种因素的影响可以用方程进行描述。15在更基本的层面上说,固化过程决定于材料的分子官能16凝胶化与玻璃化是固化过程中发生的两个明显现17,18,19对这两种现象可以分别进行测试,但是需要使用两种不同的分析技术19,即温度调制差示扫描量热(TMDSC) 和动态热机戒分析(DMA) 本文的主要研究目的是考察光固化过程中的样品收缩程度是否可以降低。研究对象是牙科中使用的一种填塞树脂材料。如前所述, DSC和DMA是表征高分子材料固化过程的常用分析技术14,19,20,21,22,因此本研究使用的也是这两种方法。测试方法的细节可以参考Lucas及其合作者23、Gedde24、本文作者之一25,26和Saiter及其合作者27的文献。 实验 本文的研究对象是用于填补龋齿的市售牙科树脂材料,由科罗拉多大学牙科学院免费提供。该材料包含甲基丙烯酸-N,N-二甲氨基乙酯和甲基丙烯酸缩水甘油酯两种成分,二者质量分数分别为60%和40%。该材料中不含硅酸盐填料。本文所用的研究对象基本代表了牙科填塞树脂材料的标准成分。 使用的差示扫描量热仪是PerkinElmer Diamond DSC,氮气吹扫,循环冷却(-20℃)。功率补补式DSC的优 势之一是能够很好地控制温度同时检测能量。通过适当调整冷却参数,功率补偿式DSC可以准确控制样品温度,而热(流)式DSC中有时会看到的温度突变在此处不会发生。改装过的DSC具有一个特殊的顶盖,使光线可以照射到所测试的样品上。DSC中使用的紫外光的能量通过石墨靶进行测量和校正。20在DSC测试前后分别称量样品的质量,结果表明测试过程中样品质量基本无变化。对于本研究中使用的光固化体系来说,样品最大失重约为0.05%。DSC测试结果用于计算固化能、固化反应的活化能、固化样品的玻璃化转变温度Tg。细节内容可以参考Gabbott的文章。28 样品的机械性质测量和形变跟踪采用PerkinElmer DMA8000,液氮冷却。如图1所示, DMA对样品形变的测量是通过跟踪探针的静态位置进行的。玻璃化转变温度Tg与样品固化进程亦用DMA进行评价。紫外光会产生热量,因此在DMA测试过程中进行冷却是必要的,以保持温度基本恒定。如果不能进行有效的冷却,温度突变会导致DMA测试结果看起来像是样品模量发生了改变。我们经过研究发现用液氮冷却可以对温度进行有效的控制,避免在DMA测试样品中出现之前提到的异常数据,也不会产生温度漂移。液氮冷却部件由DMA的固件进行控制,通过调整液氮流速来保持样品温度。在DMA测试中,施加的正弦应力o是时间t的函数: 上式中v是频率,单位为赫兹(Hz=s1)。正弦载荷的作用使应变e产生如下行为: 上述结果可以提供关于储能模量E'(代表了固体形式的弹性行为)和损耗模量E"(代表了液体形式的粘性行为)的信息。23,24,25,26有时也可使用损耗角正切tan 0=E"/E'. 样品被涂刷在纸基体上,以单悬臂模式进行测量。使用波长为365nm的LED光源 (Digital Light Labs,Knoxville,TN) 进行固化反应。光线照射的样品温度分别为25、37.5和50℃,时间从10分钟到30分钟不等,光线强度为40~110 W/cm²。DMA内部的光线强度使用辐射计进行测量,,以便对实际光线强度进行校正。关于DMA中光引发材料固化过程的更多信息可以参考相应的文献。26 图1.使用DMA测量紫外辐射下的样品形变,显示了通过DMA探针静态位置改变而检测到的样品尺寸变化。样品反应温度为25°C,紫外光波长为365 nm。 根据标准的实验设计规程,29我们使用因子设计法确定测试条件,以表征样品的固化程度与形变程度随光线强度、曝光时间和反应温度的变化。这种设计方法可以帮助我们将样品表征所需要的实验数量最小化。具体的实验条件如表1中前三列所示。图2以图形方式显示了实验条件点。测试结果采用商业软件Design-Ease (Stat-easeSoftware, Minneapolis, MN) 进行分析。 图2.因子设计的图形表示。该设计方式为?3中心化因子设计,实验条件的选择为感兴趣区域的边界点和中心点。?9 在对测试结果进行分析时,我们需要注意:绝大部分材料的固化程度不需要达达100%即可满足实现正常功能的机械强度要求。30在大多数情况下,高于临界玻璃化转变温度Tgc(材料开始呈现出高分子性质)即可获得能够满足大部分使用需求的机械强度。然而,还需要强调的一点,材料的其他物理性质并不是完全随其机械强度而变化的。31因此,固化程度与某些特定性质的关系还需要进行实际的测量。 图3和图4分别显示了典型的DSC和DMA测量数据。通过与完全固化过程的给定焓变值的比例关系,可以根据反应焓变计算样品的固化程度28,也就可知未固化材料的数量。 图3.典型的光固化实验的DSC测量结果。通过放热反应焓变值与已知的完全固化反应的总焓变值的比较,可以计算出剩余的未固化材料的比例。在本实验中,样品反应温度为25°C,紫外光波长为365 nm。 图4.典型的光固化实验的DMA测量结果(样品反应温度为25°C,紫外光波长为365 nm)。5分钟处的标记显示了紫外光开始照射的时间。这些测量结果用于计算凝胶化温度tgel、玻璃化温度tvitr和样品形变。小圆点代表储能模量E',实心方框代表损耗模量E"。 我们所采取的测试方法比热机械分析(TMA)中的体积法更加简单,可以在同一次实验中测量凝胶化温度与玻璃化温度。经过多次实验,我们发现样品的凝胶化过程随紫外光强度的不同而发生很大的变化。紫外光强度较高时,样品的形变非常明显;但是紫外光强度较低时,样品的收缩程度很小。样品的玻璃化过程也存在类似的现象,只是幅度变化更大。由于初始阶段高强度的紫外线会导致样品的迅速形变,我们认为在紫外光强度较高时凝胶化过程与玻璃化过程几乎是同时发生的。 Gilham建立了一种时间-温度-转变 (TTT)图像来表示固化过程。33依照他的做法,我们根据自己的实验结果建立了一种时间-强度-转变 (TIT)图像。理所当然,这里的强度是指固化过程中使用的紫外光的强度。 我们的最终研究目的是尽可能降低材料在固化过程中的形变,因此确定的最佳方法是:在实验初始阶段用低强度紫外光引发材料的光固化反应,然后显著提高紫外光的强度以完成材料的玻璃化过程。表1显示了相应的测量结果,所用的实验条件因子设计如图2所示。 表1.因子设计的实验条件和测试结果。(Digital Light Labs,Knoxville,TN) 温度 强度 时间 凝胶化玻璃化形变 固化程度 温度 温度 (C) (W/cm²) (min) (min)) (rmin) (mm) 25 110 30 0.1 11 0.019 95.4 50 110 30 0.1 10 0.016 96.3 25 40 30 0.4 14 0.003 89.1 50 40 30 0.4 13 0.004 90.3 50 40 10 0.4 13 0.004 90.8 25 40 10 0.5 15 0.003 90.1 25 110 10 0.1 15 0.013 96.7 50 110 10 0.1 10 0.015 97 37.5 75 20 0.3 12 0.006 94.6 首先,根据表1所示的测量结果可生成以紫外光强度表示的Gilhams-Enns图形或者TTT图形,如图5所示。该图显示了温度为25°C时紫外光强度对样品转变过程的影响。注意,在紫外光强度较高时,本研究所测试材料的凝胶化过程几乎是瞬间就发生的。 图5.温度-强度-时间图像显示了紫外光强度与反应时间对材料凝胶化过程与玻璃化过程的影响。样品反应温度为25°C,紫外光波长为365 nm, 而后,我们提出了一种固化方式,以便在合理的反应时间内尽可能降低材料的形变。最后,绘制了样品形变与反应温度和紫外光强度的关系(如图6所示)。我们发现:反应温度的影响并不显著;而紫外光强度越高,可以观察到的材料形变程度就越大。基于上述实验结果,我们尝试在反应开始阶段使用低强度紫外光使样品凝胶化,然后提高紫外光强度以完成整个固化过程,发现这种方法可以将样品形状的改变降到最低。最后,绘制了样品形变与反应温度和紫外光强度的关系(如图6所示)。对于本研究所使用的样品材料来说,整个响应曲面是平滑且规则的。 图6.响应曲面图显示了样品形变(Z轴)随紫外光强度(X轴)与反应温度(Y轴)的变化关系。相同的阴影程度代表了相似的形变值,阴影程度最深的部分说明样品的形变程度最小。 图6所示的结果说明反应温度对固化过程中样品形变的影响非常小。紫外光强度越高,可以观察到的材料形变程度就越大。基于上述实验结果,我们尝试在反应开始阶段使用低强度紫外光使样品凝胶化,然后提高紫外光强度以完成整个固化过程;此种方法可将样品形状的改变降到最低。 通过对光固化丙烯酸树脂的表征实验进行相应的因子设计,可以在同一系列的实验中完成对材料收缩程度、固化时间、凝胶化时间和玻璃化时间等性质的表征。有趣的是,样品形变的最主要影响因素是紫外光的强度,说明聚合物网络形成的初始阶段对于样品形变的控制是至关重要的。通过形式变化的Gillham图形和响应曲面,可确定最佳的实验条件,使紫外光驱动的固化过程中产品的形变最小化。 采用包括光照差示扫描量热、紫外-热机械分析和紫外-动态热机械分析等技术的新的表征方法,可发现哪些因素对丙烯酸树脂的固化过程的影响最大。我们有理由相信,本研究所获得的结果亦可广泛用于其他光固化材料的表征分析和研究。 致谢 我们衷心感谢Digital Light Labs (Knoxville,TN) 提供的紫外LED光源,感谢PerkinElmer, Inc.(Shelton,CT) 提供的DSC和DMA测试仪器,感谢科罗拉多大学丹佛牙科学院的Jeffery Stansbury博士提供的树脂材料。 ( 1 . J.E . Mark and B . Erman, in ' Performance o f Plastics', (ed. W. Brostow), Chap. 1 7; Munich/Cincinnati, OH, Hanser ( 2000). ) ( 2. B. Bilyeu, W. Brostow a nd K.P. Menard, J. Mater. E d . 21, 2 81(1999). ) ( 3 L. Bazylia k , M. Bratychak and W. B rostow, M a ter. R e s.Innovat.3,132(1999). ) ( 4. B. Bilyeu,W. Brostow and K.P. Menard,J. Mater. Ed.22, 1 07(2001). ) ( 5. B. Bilye u , W. Brostow and K .P. Menard, J. Mater. E d.23, 1 89(2002). ) 6. 1.M. Kalogeras, M. Roussos,I. Christiakis, A.Spanoudaki, D. Pietkiewicz, W. Brostow and A.Vassilikou-Dova, J. Non-Cryst. Solids 351, 2728(2005). 7. 1.M. Kalogeras, A. Vassilikou-Dova, I. Christakis, D.Pietkiewicz and W. Brostow, Macromol. Chem. & Phys.207,879(2006). 8 E. Pisanova and S. Zhandarov, in 'Performance ofplastics', (ed.W. Brostow), Chap. 19;Munich/Cincinnati,OH, Hanser (2000). 珀金埃尔默仪器(上海)有限公司 地址:上海张江高科技园区张衡路1670号邮编:201203电话:021-60645888 传真:021-60645999 www.perkinelmer.com.cn ( .9 P. Punchaipetch, V . Ambrogi,M. G i amberini, C.Carfagna, W. Brostow and N.A. D'Souza, Polymer 42,2067(2001). ) ( 10. P. Punchaipetch, A . E . Akinay, W. Brostow, N.A. D'Souzaand J . R eed, P olymer C omposites, 2 2, 32(2001). ) ( 11. K. Pingkarawat, C.H. Whang, R.J. Varley and A.P.Mouritz, J. Mater. S ci. 47, 4449 ( 2012). ) ( 12. S . Aless i , A. Parlato, C. Dispenza, M. D e Maria a n d G.S p adaro, Radn. Phys . & Chem. 7 6,1347 (2007). ) ( 13. J . Koleske, Radiation Curing of Coatings, Chap 1 , WestConshohocken, PA, A STM@, (2002). ) ( 14. B . Bilyeu, W. Brostow and K.P. Menard, P olimery 46, 799(2001). ) ( 15. W. B rostow and N.M.Gl a ss, Mater. Res. I n n ovat. 7, 1 25(2003). ) ( 16. M. Bratychak, W. Brostow, V.M. Castano, V . Donchak and H. Gargai, M ater. Res. Innovat. 6 , 1 53 (2002). ) ( 17. C. S chick,J . D obberth, M . P o tter, H . D e hne, A. He n sel,A. Wurm, A. M. G honeim a n d S. Weyer,J. ThermalAnalysis, 49, 499 (1997). ) ( 18. G. V anAssche, A . V a n Hemelrjjck, H. Rahler and B. VanMele, Thermochim. Acta 317, 041505 (1997). ) ( 19. B . Bilyeu, W. Brostow and K . P . M enard, Polymer Composites 2 3, 1111( 2 002). ) ( 20. PerkinElmer Service Bullet i n ACCY-01-022A, PerkinElmer, I nc., Shelton, CT(2005). ) ( 21. B. Bilye u , W. Brostow and K.P . Menard, J. ASTM Internat. 2(10),1 ( 2005). ) ( 22. B. B ilyeu, W. Brostow a nd K.P. M enard, M a ter. R e s. Innovat . 10, 110(2006). ) ( 23. E. F . Lucas , B.G. Soares and E . Monteiro, C aracterizacaode polimeros, R i o de J a neiro, e - Papers (2001). ) ( 24. U.W. Gedde, P o lymer P h ysics, D ordrecht-Boston,Springer -Kluver (2001). ) ( 25. K.P. Menard, in'Performance of plastics', (ed. W . Brostow), Chap. 8; Munich - C incinnati, Hanser (2000). ) ( 26. K.P. Menard, D y namic Mechanical Analysis, 2n d ed. Boca R aton, FL, CRC P r ess (2008). ) ( 27. J.-M. Saiter, M . Negahban, P . dos S antos C laro, P.Delabare and M . -R. G a rda, J. M a ter. Ed. 3 0 , 51 (2 0 08). ) Introduction APPLICATIONNOTE Differential Scanning Calorimetry Author Tiffany KangPerkinElmer, Inc.Shelton, CT USA Optical adhesives are used in many industries wheresolvents are undesirable. Semiconductors and chipmanufacturers for example can not afford solventsdepositing on components. Photo-DSC allows fast analysisof the curing profile and measurement of the energy ofthe curing reactions. Because photo-initiated reactions are fast and energetic, good temperature control and responsiveness are needed to get good data. Power compensated instruments are the best choice for these applications Experimental A specialized DSC pan with a quartz cover can be used although an openpan often is acceptable. The sample is heated or cooled to the isothermaltemperature and allowed to equilibrate. Pyris"" software allows triggering theshutter of the light source to open and close for irradiation of the sample. Datacan be collected at various intensities and times to develop the best cure cyclefor the material. Figure1. DSC 8000. The DSC's high sensitivity and excellent temperaturecontrol makes it ideally for demanding applications like photo curing studies. R hv Figure 2.UV curing materials are commonly used as adhesives. UV lightgenerates a free radical which causes the cure. Figure 3. DSC results from the UV driven cure of an adhesive. Light turned on at3 minutes (red line marked shutter open) for 30 seconds. The DSC 8000 (Figure 1) is the ideal choice for these studiesbecause the power compensated design allows the instrumentto quickly detect and respond to the optical material. Thedesign allows us to maintain a true isothermal through thecure so the sample temperature does not increase. All of therecorded energy therefore comes from the reaction shown inFigure 2. Results When the UV source is triggered, the sample is exposed tothe UV light. A curing exotherm develops as the materialundergoes polymerization. The energy in this peak can be usedto calculate the kinetics of the curing process. Figure 3 showsan example of this. When the light is applied at 3 minutesfor 30 seconds, a exothermic reaction occurs as the materialcrosslinks and forms a solid. Since the material is its ownsolvent, no volatiles are lost and contamination of the circuitboard is minimized. Looking at the thermogram, one see themaximium of the exotherm occurs very quickly after applyingthe light, emphasizing the need for fast response. The energyof the reaction is calculated from the area under the peak,which is why the ability to compensate for the heat comingfrom the UV lamp is important. Depending on the material, the exposure can be varied interms of time as well as the number of exposures. Lightfrequency and intensity can be varied using filters on theUV source. As UV sources generate heat, the DSC'stemperature control must be able to compensate for theenergy from the lamp. Conclusion Photo-DSC is a powerful tool for studying andcharacterizing optically curing materials. For moreinformation go to http://www.perkinelmer.com. Three-dimensional (3D) printing technologyhas received tremendous interests due to itscapability of generating complex-shaped structures, unparalleled high efficiency and zero residual feedstock12,3. The invention and development of low-cost desktop printershas made this technology widely acceptable for applications both in industry and home4.Normally, thermoplastic materials are utilized as the raw material of 3D printers, whilemore advanced and sophisticated prototype uses the precursor of thermoset materials(or a prepreg) as the feedstock sources. Due to the reaction nature of the precursor,various unpleasant gases would emit during the printing procedure which may includeregulation prohibited chemicals from time to time. PerkinElmer can provide effective hyphenated solutions to in-situ study the chemical natureof evolved gases during the 3D printing. At the same time, since the TGA 8000 can coverthe temperature range up to 1200 ℃, we may also count on the TG-GC/MS platform toreverse-engineer target products regardless of a fully cured product or an additiveincluded prepreg. Experimental The study utillized the TG-GC/MS hyphenated module toobtain accurate thermal decomposition data with subsequentidentification of the evolved breakdown products. The TGA 8000 was programmed for a linear temperaturerange from room temperature to 800℃ with a sweep rateof 20 C/min. High purity helium (45 mL/min) was usedto purge the whole system and to transfer the breakdownproducts to the GC/MS. The online mode and the separation mode are both appliedto monitor the molecule debris, Total Ion Chromatogram (TIC)15~500 amu with SIR at 44 amu and 94 amu. Maintain the temperature of lines and adaptors at 280℃,with a pumping rate of 30 mL/min the TL9000 sampling splitratio is 1.:1.5. Table 1. Gas Chromatograph method parameters. Online Mode GC Oven Program Clarus 680 GC GC Oven Program Set Point Hold Time Isothermal 280℃ 40 min Separation Mode GC Oven Program 280°C GC Oven Program Set Point Hold Time Initial 35°C 3 min 10°C/min 290°C 3 min Table 2. Mass Spectrometer method parameters. Mass Spectrometer: Clarus 680 GC Inlet Line Temperature 280°C Source Temperature 280°C Scan Conditions Mass Range 15-500 m/z Scan Duration 0.10 sec Run Time 30 min Results A sample of (26.264 mg) printing stock was heated as shownin Figure 1. Figure 1. Initial polymer pyrolysis. Three weight loss steps can be observed from the obtained curve.The polymer system starts to pyrolysis at 585.17℃ with a totalweight loss of around 44.268%. There are two small stepsexisting within the low temperature range which might be theorigin of the unpleasant gas during the 3D printing procedure. The initial mass spectrometry (Figure 2) of the evolved gas at29.856 min (approximately 630℃) shows the presence ofaromatic compounds with further separation by chromatographyrequired to correctly identify which aromatic compounds andto separate the aromatics from other thermal breakdowncompounds that are evolved at the same temperature. Figure 2. Total spectra at 29.856 minutes. In order to understand the rough distribution of the evolved mixinggas debris, the online TGA-MS mode is applied firstly. As shown inFigure 3, the primary MS signals reach peaks at 315℃ and 605℃respectively. Based on this fact, we will focus our attention onthese two points using the separation mode. Figure 3. MS data in relation to the thermal program demonstrating the evolved components. In order to qualitatively study the unpleasant gas evolved duringthe 3D printing procedure, we've collected 80~100 pL of evolvedgas at 315℃ and injected it into the GC column to fully studyits components using the method described in Table 1. As canbe seen in the obtained chromatogram (Figure 4), there aremany degradation components that can be identified to discernthe polymer engineering. Analysis of the peaks evolved at 315℃ tentatively identified thepeaks to consist of linear hydrocarbons terminated with a triplebonded nitrogen atom such as Figure 5. Figure 5. Linear hydrocarbon breakdown product generated at 315 ℃. A similar 80~100 pL evolved gas at 605℃ was injected andanalysed in the same manner with the chromatogram shownin Figure 6. Figure 6. Separation of evolved components at 605 ℃. Analysis of the evolved gases at 605℃ identified many aromaticstructures such as shown in Figures 7 and 8. Figure 7. Evolved product ofthermal degradation at a retention time of 17.74 minutes. Figure 8.Evolved product of thermal degradation at a retention time of 24.50 minutes. Conclusion The 3D-printed polymer starts to degrade at 585.17℃ underhelium atmosphere. It gives us a hint that this polymer shouldbelong to the high performance engineering polymer category; The primary pyrolytic products are phenol, biphenyl derivative andother aromatic derivatives, this is the characteristic fingerprints ofaramid group polymers (such as Kevlar or Nomex); The evolved "unpleasant gas" during the 3D printing procedureare mostly azoic compounds as revealed by the TG-GC/MS data,and they are most likely used as the initiator of the chainextension reaction. References 1. Mohammad Vaezi, Hermann Seitz, Shoufeng Yang, A reviewon 3D micro-additive manufacturing technologies, Int. J. Adv.Matuf. Technol., 2013, 67: 1721. 2. Brent Stephens, Parham Azimi, Zeineb El Orch, TiffanieRamos, Ultrafine particle emissions from desktop 3D printers,Atmos. Environ., 2013, 79:334. 3. J.M. Taboas, R.D. Maddox, P.H. Krebsbach, S.J. Hollister,Indirect solid free form fabrication of local and global porous,biomimetic and composite 3D polymer-ceramic scaffolds,Biomater., 2003,24:181. 4. Matt Zarek, Michael Layani, Ido Cooperstein, Ela Sachyani,Daniel Cohn, Shlomo Magdassi, 3D printing of shapememory polymers for flexible electronic devices, Adv. Mater.,2015, 28:4449. PerkinElmer, Inc.940 Winter StreetWaltham, MA 02451 USAP: (800) 762-4000 or(+1)203-925-4602 Www.perkinelmer.com PerkinElmer For a complete listing of our global offices, visit www.perkinelmer.com/ContactUs Copyright @2016-2017, PerkinElmer, Inc. All rights reserved. PerkinElmer is a registered trademark of PerkinElmer, Inc. All other trademarks are the property of their respective owners. Introduction Producing consistently highquality gloves with minimumcost has always been the topmission for glove manufacturers. The quality of gloves is associated with the raw materials used and its manufacturingprocesses. For this reason, understanding the various rubber additives and rawmaterials used and its application advantages has becoming very important. Glove manufacturing processes begin by mixing latex with latex compoundingingredients which include sulfur, zinc oxide, accelerators, pigments, stabilizers,dewebbing agent and antioxidant. The mixture is then leave to cure,before itundergoes glove dipping, vulcanization, and leaching process that producestretchable gloves. One of the additives commonly used in glove manufacturing isdispersing agent, which keep solid particles in latex dispersionfrom agglomerating or joining with other particles to form acluster1. In this study, two glove samples formulated with andwithout dispersing agent are analyzed to see if a difference canbe seen. Figure 1. TG-GC/MS (Clarus SQ8 GC/MS, TL8500, TGA 8000). Experimental The experiment was conducted using PerkinElmer TGA 8000hyphenated with Clarus SQ 8 GC/MS. The hyphenation transferline system used is TL-8500. A survey run was performed usingTGA system to characterize the thermal degradation ofdispersing agent. The percent weight loss (TG) and derivative percent weightloss (DTG) curves of dispersing agent were plotted againsttemperature in Figure 2. As sample is in liquid form, the weightloss plot has shown immediate weight loss due to the drying orvaporization of volatile content of about 30% between roomtemperature to 200°C. From the TG-DTG curves, it wasdetermined that dispersing agent has shown greatestdecomposition rate at approximately 455℃, 28%/min. Therefore, in subsequent runs, the evolved gas from each glovesamples were analyzed at the same temperature region usingTG-GC/MS hyphenation system. The setting of the experiment isshown in Table 1. Figure 2. Dispersing agent survey run - Percent weight loss (in red) and derivativeweight loss (in blue) curves versus temperature. Table 1. Hyphenation system experimental setup. TGA Program TGA 8000 Purge gas Helium at 40 ml/min lemperature Heat from 30 to 650℃ at 50°C/min profile Sample size 10~ 15 mg Transfer Line Program TL 8500 TL Temperature 280℃ Pump rate 70 mL/min GC/MS Program Clarus 680 GC GC column Elite-5 MS, 30 m *0.25 mm *0.25 um SQ8 MS Temperatureprofile 50℃ for 1 min, 10℃/min to 300℃, hold for 10 min scan range 40-300 amu, SIR 44, SIR 54 lonization mode El, 70eV lon source Temp 230°C Results Glove samples A and B, one formulated with dispersing agent,another one without are analyzed. Figure 3 (a) and (b) showedthe weight loss profile of both samples, with very similar trend atthe temperature region of interest. A more sensitive instrumentis in need to differentiate the two. The evolved gas from each sample was analyzed by GC/MS todetermine if hyphenation technique would confirm the presenceor absence of trace amount of dispersing agent in glove samples.Figure 4 demonstrates the MS data obtained from the analysisof each sample. Figure 3. Weight loss profile of (a) Glove Aand (b) Glove B. It can be seen that the gas evolved are very complex, withmajor compounds detected at Retention Time (RT) betweentwo to four minutes for both glove samples. However, it is notcomparable to those eluted out from dispersive agent. This isbecause the major compounds detected in glove samples aremainly contributed by the decomposition of latex. As thecontent of dispersing agent used is very low, it becomeschallenging to resolve the peaks coming from dispersingagent from those of latex gloves. Hence,two other peaks detected between RT between11 to 12 minutes in the TIC diagram of dispersing agent (Figure 5)were identified and used for further interpretation. Figure 6 demonstrated three major mass to ion charge ratio(m/z) detected at RT 11.205 minute and 11.563 minute whichare being monitored. Profile searching via MS software, hasshown evidence of low levels of dispersing agent detected inGlove B, that is not seen in Glove A, refer to Figure 7. Figure 4. Comparison of GC/MS TIC Diagram of the evolved gas of Glove A, Glove B and dispersing agent injected at 450℃. Figure 6. Dispersive Agent -Mass spectrum of selected peaks at RT 11.205 min and 11.563 min. TGA is a useful tool when it comes to compositional analysis asit allows quantification of weight loss of a material at targetedtemperature region. By hyphenating TGA to a GC/MS system,further identification of evolved gases can be carried out. In this case, TG-GC/MS hyphenation system successfully detecttrace amount of additive used in glove manufacturing process.With minimum sample preparation, the TG-GC/MS serves as a much faster approach when it comes to sample differentiation,at the same time allowing a more complete thermalcharacterization of material. 1. Vanderbilt Chemicals Product Information, Latex Glossary. www.perkinelmer.com PerkinElmer For a complete listing of our global offices, visit www.perkinelmer.com/ContactUs 013317_01 PKI 超高灵敏度逸出气分析方法:医药中溶剂重结晶的研究 TG - MS 的典型应用包括: 样品中水分/溶剂的损失检测(如药物冻干或 脱水过程) 热稳定性(降解)过程 研究化学反应(如聚合反应) 分析样品中挥发物(如挥发性有机化合物 (VOC)的检测) 热重分析 (TGA)通常用来测量样品在加热或等温过程中的重量损失。在制药领域,_由于溶剂/水的存在、去溶剂作用或者样品的分解,样品经常表现出失重现象,而这些信息往往用来评价样品的纯度、稳定性以及适用性。 需要对这些信息完整鉴别和分析时,热重分析仅仅能够定量得出样品的失重情况,却不能定性的得出失重物质的特性。 将质谱仪(MS)和热重分析仪进行联用,可用来分析热重逸出的气体,得到更加有价值的信息。 仪器介绍 PerkinElmer 提供的所有热重分析仪 (Pyris1TGA、 STA 6000 和 TGA 4000)都可以方便地连接到MS 系统。用户可以选择 PerkinElmer Clarus@ MS 或者Hiden 公司的质谱分析仪与热重分析仪联用。本文中,采用Pyris 1 TGA与 Hiden 公司 HPR-20型质谱相联。 图 1. Pyris 1 TGA与 HPR-20 MS (左)及 Clarus 600 MS (右)的联用系统 HPR-20 型质谱仪优化分析热重分析仪所产生的气体,具有以下优点: 可根据灵敏度水平的不同需要,使用法拉第杯或二次电子倍增器(SEM)等探测器。SEM能够检测到非常低分压下(低至10-8bar)的逸出气体, 可鉴别一些低含量污染物,并且可以在空气中进行实验,不够成样品的改变。 可选Foreline 真空泵和绕行(Bypass)真空泵有效的抽入氦气。氦气作为最常用的吹扫气体,本身不产生任何干扰离子。 ● 与热重分析仪相连接的传输线具有加热功能,质轻柔韧,在移动使用过程中不会损坏,使系统变得非常灵活强大。气体传输采用大口径熔融石英毛细管柱,以16ml/min流向质谱仪实现更高的灵敏度。 加入防堵塞(Anti-Blockage)过滤器用来截住大分子量的物质,防止其堵塞毛细管柱,可预防数小时的停机时间和清洗无真空损失的质谱仪。 软电离(Soft Ionization)功能对系统进行优化,以减少离子分裂导致简单谱图分析。 实验部分 下面的研究开,将 Pyris 1 TGA 热重分析仪与 HPR-20 MS 相连接。净化气体为氦气,气体吹扫速率30ml/min,样品质量为6.1374mg,,以 10°C/min 的速率加热到200°C。 此药物样品在一段时间后会出现不常见的重结晶行为,通常怀疑这和样品中的溶剂失重相关。因此需要一种方法来确定样品生产过程中使用的溶剂是否的确是引起这种结晶行为的原因。 ( 将6.1374毫克的样品放在热重分析仪器中进行实验, HPR-20型质谱仪用高灵敏度的 二 次电子倍增器(SEM)运用多离子检测(MID)模式进行检测,确定溶剂为 49amu(原子质量单位)的二氯甲烷。 ) 图2.样品中溶剂挥发引起的失重谱图 图2中的样品的热重曲线中,可看出仅为1.2微克(0.026%)的极少量失重,从中显示出Pyris 1 TGA 的极佳的表现。 图3.10bar区域内的失重曲线和质量为49的二氯甲烷 对这个极少量的失重产生气体进行了分析,如图3所示。质量为49的背景分压为 2x10-11bar,失重区域出现了一个轻微的高峰,分压为5×10-11bar。尽管挥发物量很少,引起相应的小分压增加也不大,但用质谱仪依然能很清晰的检测到这种很小的变化。谱图上可清楚看出二氯甲烷在样品中的失重损失,正如猜想的那样。此研究也显示出联用技术能够很好的识别极少量污染物残留的样品。 TG-MS 对于低含量污染物立应用,是TG-IR所不能检测到的。欲了解更多信息,请联系相关销售代表。 PerkinElmer, Inc. 大中华区总部地址:上海张江高科园区李冰路67弄4号邮编:201203电话:(021)3876 9510传真: (021)38791316 www.perkinelmer.com.cn ( 要获取全球办事处的完整列表,请访问y www.perkinelmer.com.cn/Con t actUs ) ( C2 009 P e r k inEl mer, I n c .保留 所有权利。Per k i nElm e r徽标和外 观设 计 是Per ki nE lmer 的 注册商标。文中提 及的 其 它非Perki nElmer及其 子 公 司 所有的 其 它商标 均为其 各自 所有 者 的财 产。 ) PerkinElmer保留随时更改此文档的权利,恕不另行通知。对于编辑、图片或排版错误概不承担任何责任。 Polymorphism inAcetaminophenStudied bySimultaneousDSC and RamanSpectroscopy Differential scanning calorimetry (DSC) and Raman spectroscopy arecomplementary techniques that are often applied to the same problems,principally to study phase transitions in solids. Simultaneous Ramanand DSC measurements add a qualitative dimension to DSC data whichsimply measure heat flow. A typical example is the identification ofpolymorphs. Acetaminophen has several polymorphic forms which caninterconvert with thermal treatment. A single Raman spectrum canidentify a polymorph, while DSC uses a temperature scan to observethe relationship between forms that are not all stable at ambienttemperatures. Simultaneous measurements are necessary to ensurethat the Raman data correspond to the different stages identified by DSC. Coupling thermal and spectroscopic techniques raises the question of how the methods affect each other.In this case, the main issue is the potential of the laser energy to perturb the temperature of the sample.By exploiting the double-furnace design of PerkinElmer@'s DSC to assure accurate temperature controlon the bulk of the sample and the fast response of this design to compensate for the heat induced bythe Raman laser, the effects of the Raman on the sample can be minimized. Similarly, the ability of thePerkinElmer RamanStation"" to apply laser only while spectra are being collected also helps maintain sampletemperature. This allows accurate measurements with minimal induced artifacts. Experimental The system used here combines a PerkinElmer DSC 8500with a PerkinElmer RamanStation connected by a fiber opticprobe. The probe fits into the lid of the DSC with anadditional lens to focus the laser onto the sample panand collect the Raman scatter. Spectra are measured withan open sample pan or through a quartz lid. For the datashown here, the heating rates were 10 or 20 K/min withspectra typically obtained at 1 or 2 degree intervals. Thepower of the laser used to generate the Raman spectraaffects the DSC, but the rapid response of the dual-furnacedesign of the DSC 8500 minimizes any perturbation of thesample temperature. Changes in the Raman spectra recordedduring the temperature cycle can generate a curve for directcomparison with the DSC heat-flow curve, confirming thatthe two techniques are responding to the same changes.Thermal transitions appear as peaks in the DSC heat-flowcurve but they appear as steps when generated from bandintensities in the Raman spectra (Figure 1). Results Raman spectra of the various forms are seen in Figure 2.Although the spectra of Forms l and IlI appear very similar,there are significant band shifts, while the spectrum of Form Ilis clearly different. The spectra of the melt and the amorphoussolid are extremely similar to each other with much broaderbands than the crystalline forms. Figure 1. Thermograms from DSC and Raman spectra. DSC is needed to understand the relationship between thedifferent forms. Commercial products contain Form I whichis the thermodynamically most-stable polymorph. However,cooling from the melt normally produces an amorphousglass. Figure 3 shows a thermogram and spectra obtainedby heating the amorphous material from 30 to 200℃. Theglass crystallizes at about 80℃ to Form III. At about 130℃,this is transformed into Form Il which melts at about 160℃. When the amorphous glass is allowed to crystallize at roomtemperature, it can convert to Form II. Although Form Ilmelts at 160℃ as in Figure 3, it may convert to Form Iwhen heated from ambient temperature. Figure 4 showsa Raman thermogram and spectra obtained by heating asample of Form ll from 20 to 200℃, cooling to 20℃ andheating to 200℃ again. Conversion to Form I occurs atabout 120℃ with subsequent melting at 170℃. Aftercooling, the amorphous glass undergoes the expectedtransitions to Form Ill and then to Form ll. The conversionfrom Form II to Form I is not always seen. The amorphous glass crystallizes very slowly unless heated.However, the presence of small particles to act as nuclei canpromote crystallization. A sample of acetaminophen containinga small concentration of zinc oxide crystallizes at around 100℃on cooling from the melt at 10 K/min. Spectra from beforeand after the transition in Figure 5 (Page 3) show that, inthis case, crystallization results in Form ⅢI. Figure 3. Raman spectra (1700-1100 cm") from a DSC run. Summary Acetaminophen exhibits a number of transitions betweendifferent forms and the behavior is not always reproducible.Simultaneous DSC and Raman measurements can identifyunambiguously which forms are involved in any transition. Figure S. Spectra before and after crystallization on cooling. PerkinElmer, Inc.940 Winter StreetWaltham, MA 02451 USAP: (800) 762-4000 or(+1) 203-925-4602www.perkinelmer.com For a complete listing of our global offices, visit www.perkinelmer.com/ContactUs 逸出气分析:采用热重-质谱联用技术,分析样品中的残留溶剂 概论 热重分析仪(TGA)通常用于检测材料在升温或等温时的失重特性。在医药领域,很多材料的失重归因于水分或溶剂的挥发、脱溶、分解等现象,这些失重讯息常用于进一步揭示药品的纯度、稳定性以及适用范围。TGA 对于样品的失重提供了卓越的定量检测,但是不能对样品的逸出或者分解物进行定性判断。而 TGA逸出物的定性判断对于研发工作是十分重要的检测内容。 热重分析仪与质谱(TGA-MS)联用技术正是为了测试分析逸出气的定性研究,为样品测试提供完整的逸出气讯息。 仪器配置: PerkinElmer所有的TGA仪器(包括Pyris 1 TGA, TGA4000, STA6000)都可以方便的与MS仪器联用,如图1所示,图示联用的MS是Hiden Analytical的四级杆质谱仪HPR-20。另外, PerkinElmer 的Pyris 1 TGA可与本公司的GCMS进行联用测试,如图2所示。 实验部分: 在下面的实例中,联用仪器采用的是PerkinElmerPyris 1 TGA与Hiden HPR-20质谱仪,该质谱仪的质量范围为200 amu(原子质量单位)。由于绝大多数的药品溶剂质核比小于100,所以200amu对于药品溶剂检测而言已经足够。TGA的载气总流量通常采用20至30ml/min。 般而言,样品的离子数不可知。在此例中,常用方法是在质谱范围内做一次扫描,得到样品逸出物的质核比;然后针对我们感兴趣的核质比,采用MID(多离子数检测)进行第二次测试分析。MID对于选定离子检测而言,由于其针对性检测而非宽质量范围检测,所以可得到更佳的测试结果,而且测试更高效。 大家常常关心样品中的逸出挥发物、残余溶剂的类别以及在结晶过程中是否与溶剂有键合作用。在下面的实例中,样品从室温开始失重、到140度失重结束,总的失重比例大约6%。 很多材料都含水,但是,相应的失重过程是否完全归因于水分的脱离,这就是问题所在。对于该样品而言,乙醇和丙酮在生产过程中可能残余于样品中,所以也同时进行检测。水的核质数18 amu, 乙醇和丙酮通过软件谱图库初步选择的核质数分别为31和43。另外,谱图库显示乙醇还具有核质数43,所以此核质数不能对丙酮进行定性判断;根据以上推论,我们也选择丙酮另外的核质数58。 将样品放入TGA中,采用常规升温程序测试;在热分析软件中添加了按钮控制MS的启动和停止,从而可以得到两个测试系统的同步结果。在测试过程中,可同时监测到两个软件系统各自采集的数据。MS的数据可以传输到Pyris软件中、以时间或者温度为坐标显示。 测试结果 如图3所示,从质量数18可推断水分的存在,其分压在10-7数量级,相应的TGA曲线如图4所示。另外,可以看出,其它核质数的浓度明显低得多,在10-8数量级。图5是MS的水峰和热重曲线的合成图谱。 图1-HPR-20 MS 与 STA6000联用 图2-PerkinElmer Clarus 600 GCMS 与 Pyris 1 TGA 联用 质量数31清晰的确定样品中乙醇的存在,通过质量数43和质量数56的确证(如图6所示)证明样品中也存在丙酮。这是因为,质量数43的浓度明显高于质量数31的浓度,从而可以确定丙酮的存在。如果质量数43完全归因于乙醇,那么其测试的含量应该低得多。在这个实例中,质核数43有一小部分含量是归因于乙醇的第二质核离子。 图4样品从室温到140度的宽范围失重 图3 初步扫描确定深入分析的核质数 图5失重曲线和质量数18的水峰比较 图6失重曲线与MS质量数(10数量级)谱图 PerkinElmer, Inc. 大中华区总部地址:上海张江高科园区李冰路67弄4号邮编:201203电话:(021)3876 9510传真: (021)38791316 www.perkinelmer.com.cn ( 要获取全球办事处的完整列表,请访问y www.perkinelmer.com.cn/Con t actUs ) ( C2 009 P e r k inEl mer, I n c .保留 所有权利。Per k i nElm e r徽标和外 观设 计 是Per ki nE lmer 的 注册商标。文中提 及的 其 它非Perki nElmer及其 子 公 司 所有的 其 它商标 均为其 各自 所有 者 的财 产。 ) PerkinElmer保留随时更改此文档的权利,恕不另行通知。对于编辑、图片或排版错误概不承担任何责任。 APPLICATIONNOTE Hyphenation Authors: Kathryn Lawson-WoodIan RobertsonPerkinElmer, Inc.Seer Green, England Study ofthe Decomposition ofCalcium Oxalate Monohydrate usinga Hyphenated ThermogravimetricAnalyser - FT-IR System (TG-IR) IntroductionHyphenation is thecombination of differentinstruments to gainanalytical insights whichwould previously notbe observed by either instrument on their own. The combination of a Thermogravimetric Analyser (TGA) with anInfrared Spectrometer (TG-IR) is the most common type of evolved gas analysis. TGA accuratelymeasures the percentage weight loss of a sample as a function of temperature, but will notprovide any information regarding the chemical composition of the evolved gases. Interfacinga TGA with an FT-IR Spectrometer allows identification of the gases evolved, thus morecomprehensive studies of the processes which occur in thermal analysis may be conducted. TG-IR is suited to a variety of applications which require identification of evolved gases uponsample heating. Such applications include residual solvents in pharmaceuticals, and polymerand plastic decomposition1. In this application, the thermal decomposition of calcium oxalatemonohydrate (CaC204.HO) has been studied. Figure 1. PerkinElmer TGA 8000, Frontier FT-IR Spectrometer and TL8000 massflow controller. Decomposition of Calcium Oxalate Monohydrates Calcium oxalate monohydrate(CaC,0.H,O), also known aswhewellite, is a main component in kidney stones and is anindustrially useful compound used to make oxalic acid and organicoxalates. CaCz04.H,0 is commonly used as a standard to testTGA performance due to its well-known decomposition stepsand products?. When heated, CaC,0.H,O decomposes in three well definedsteps as shown below with the overall reaction equation. Step 1involves loss of water of crystallisation to form anhydrous calciumoxalate. Calcium oxalate then thermally decomposes to calciumcarbonate in step 2 with the loss of carbon monoxide. The finalstep involves thermal decomposition of calcium carbonate tocalcium oxide with the loss of carbon dioxide?. The theoreticalstoichiometric percent weight loss of each step, calculated usingthe molar masses of each compound, is shown in Table 1. Overall Reaction: CaC,0.H,0→ Ca0+H,0+CO + CO, Table 1. Theoretical stoichiometric weight loss for each TGA step. Step Theoretical stoichiometric weight loss (%) 1 12.3 2 19.2 3 30.1 Experimental CaC,0.H,0 (Puratronic@, 99.9985 % (metals basis)) was obtainedfrom Alfa Aesar. Thermal decomposition and evolved gas analysisof CaC,0.H,O was performed on the PerkinElmer TG-IRhyphenated system. The IR background scan was taken after zeroing the ceramic pan inthe nitrogen gas flow. CaC,0.H,O,6.8170 mg (typically between5-25 mg), was placed in the pan and analysis performed accordingto the conditions shown in Table 2. The final hold for five minutesin air at 950℃ was implemented to clean the crucible. The IRspectrometer parameters were set to collect a co-added scanevery 20 seconds. TGA Parameters Temperature Program 1. Hold for 1min at 30°C 2. Heat from 30°C to 950℃ at 20 °C/min 3. Hold for 5 min at 950C Pan Used Ceramic Balance Purge 50 ml/min N, 30 ml/min for Step 1 to 2 Sample Purge Air, 30 ml/min for Step 3 Sample Quantity 6.8170 mg Transfer Line 270°C FT-IR Parameters Scan Range 4000-450 cm1 Resolution 4 cm1 Co-added Scans 4 Results and Discussion The TGA thermogram for the decomposition of CaC,0.H,Ois shown in Figure 2, which illustrates the occurrence of threeweight loss steps. After the third step, the weight stabilized at38%. Using Pyris software, the percent change in weight, onsettemperature, and inflection point were calculated as shown inFigure 2. The measured percent weight losses of each step wereclose to the theoretical stoichiometric values (Table 3). Theinflection point is the point at which the greatest rate of change onthe weight loss curve occurs. The extrapolated onset temperatureis a reproducible calculation for further characterisation of a sampleand is the temperature at which the weight loss initiates. Figure 2. CaC,O.H,O thermogram. Table 3. Theoretical stoichiometric weight loss for each TGA step. Step Theoretical Stoichiometric Measured Weight Loss (%) Weight Loss (%) 1 12.3 11.9 2 19.2 19.0 3 30.1 30.2 Evolved gas analysis by FT-IR was carried out to provideconfirmation of the identity of gases evolved. The FT-IR generateda Gram-Schmidt profile of absorbance versus temperature, shownin Figure 3 overlaid with the TGA weightloss curve. The peaks inthe Gram-Schmidt profile correlate directly with the steps in theTGA weightloss curve. Figure 3. CaC,O,H,O Weight loss curve (blue) and Gram-Schmidt profile (red). Figure 4 shows the IR spectra at each of the three weight losssteps. At temperatures ranging 100-200 ℃, a first weight lossof 11.9% was observed, corresponding to the loss of water ofcrystallization. The IR spectrum of the evolved gas at 186℃confirmed the weight loss to be due to water vapour beingevolved from the sample. Figure 4. IR spectra from top to bottom; Spectrum at 186°℃, 504C and 789℃. PerkinElmer, Inc.940 Winter StreetWaltham, MA 02451 USAP:(800) 762-4000 or(+1)203-925-4602www.perkinelmer.com At temperatures ranging 400 - 530℃, a second weight loss of19.1% was observed, corresponding to the decomposition ofanhydrous calcium oxalate, with the loss of carbon monoxide.The IR spectrum at 504℃ provided confirmation of evolvedCO with the two peaks centered around 2100 cm1. However,peaks at 667 cm1 and 2350 cm1indicated that CO, was alsoproduced during the second step. Carbon dioxide forms as aresult of the disproportionation reaction of CO to CO, andcarbon (Equation 1). Equation 1: Disproportionation reaction of CO The third and final weight loss, at temperatures ranging 600 -810℃, was determined to be 30.2%, corresponding to thedecomposition of calcium carbonate to calcium oxide with theloss of carbon dioxide. The peaks at 667 cm and 2350 cm-1 inthe IR spectrum at 789℃ provide confirmation of evolved CO,. Conclusion Calcium oxalate monohydrate showed three decomposition stepswith obtained weight losses matching the theoretical values.Hyphenating IR analysis to the TGA provided confirmation of theidentity of the evolved gases and insights into data which wouldotherwise not be observed in TGA alone. The PerkinElmer TG-IRsystem is fully optimised to obtain the highest quality data fromthe TGA, the FT-IR and the hyphenation of both techniques. References 1. Nishikida, K., Nishio, E., and Hannah, R.(1995)"SelectedApplications of Modern FT-IR Techniques", Kodansha. 2. Haines, P.J., (2002) "Principles of Thermal Analysis andCalorimetry", The Royal Society of Chemistry. 3. Nair, C. and Ninan, K. (1978)"Thermal decomposition studies:Part X. Thermal decomposition kinetics of calcium oxalatemonohydrate - correlations with heating rate and samplesmass" Elsevier, Volume 23, Issue 1. For a complete listing of our global offices, visit www.perkinelmer.com/ContactUs ( C opyrig h t 2 0 16,Pe r ki n Elmer, In c. A ll r ights rese r ved. PerkinE l m er is a re g ist e red t ra d emark of PerkinEl m er, Inc. All o ther tr a demarks are the pr o perty of their re s pe c tive owners. ) 013078_01 PKI APPLICATIONBRIEF TG-GC/MSTechnology-Enabling theAnalysis ofComplex Matricesin Coffee Beans The combination of a thermogravimetricanalyzer (TGA) with a mass spectrometer(MS) to analyze the gases evolved duringa TGA analysis is a fairly well-known tech-nique. In cases of complex samples, TG-MSoften results in data in which it is nearlyimpossible to differentiate gases that evolvesimultaneously. Combining TGA with gas chromatographymass spectrometry (GC/MS) allows for amore complete characterization of thematerial under analysis and preciselydetermines the products from the TGA. This analysis was performed on a PerkinElmer@ Pyris"1 TGAusing alumina pans and the standard furnace. The instrumentwas calibrated with nickel and iron and all samples were rununder helium purge. Heating rates varied from 5 to 40 C/min,depending on the sample under test. The furnace was burnedoff between runs in air. Samples were approximately 10-15 mg.Data analysis was performed using Pyris 9.0 Software. During the TG-GC/MS analysis, the PerkinElmer Clarus@ 680 CGC/MS was used. A 0.32 mm l.D. deactivated fused-silicatransfer line was connected to the GC injector port. Thetransfer line was heated to 210 °C and connected to theElite -1ms capillary GC column. In both cases, data analysiswas performed using TurboMass GC/MS Software. Results In this TG-GC/MS application, coffee beans were analyzed.The TGA resulted in a complex thermogram with manydifferent transitions (Figure 1). Figure 1. Resultant thermogram from the analysis of coffee beans. The bluecurve is unroasted beans from Africa; the red curve is unroasted beans fromSumatra. The weight loss and the first derivative are shown. Figure 2. The GC/MS data resultant from the TGA of African coffee beans. Complex data was expected as coffee beans are knownto contain many different compounds. As a result, it wasdetermined that the evolved gas would likely be too complexfor TG-MS, thus TG-GC/MS was determined to be a betterapproach for this matrix. The goal of the analysis was to search the complex data fortwo compounds that would be expected in a coffee sample,caffeine (m/z 194) and phthalates (m/z 149). The caffeineis obviously present in coffee, while the phthalates were apossibility as a result of storage in and contact with plastics.The resultant GC/MS data is shown in Figure 2 (Page 2),demonstrating a very complex chromatogram. A search for significant peaks resulted in a spectral matchfor a phthalate (56 minutes), while a search for m/z 194resulted in a spectral match for caffeine at 60 minutes.As expected, the TGA of coffee beans results in thesimultaneous evolution of a large number of gases-TG-GC/MS is able to resolve many of these compoundsenabling deeper investigation. TGA analysis allows quantification of the weight loss of amaterial at specific temperatures. MS increases the power ofthe technique by providing the ability to identify the speciesevolved during thermal analysis.TG-GC/MS adds theadditional capability of chromatographic separation ofco-evolved gases. While not realtime, the improved separationby the GC/MS makes data interpretation easier than TG-MS.This allows the separation of fairly complex mixtures withminimal sample preparation by using the TGA to volatilizecomponents. 用热重分析仪研究老化处理的碳纳米管 介绍 消费品和工业产品中使用碳纳米管的领域越来越多,使得科学家需要回答碳纳米管对我们的环境究竟存在什么样影响的问题。在许多最终产品的应用方面,聚合物复合材料、药物释放体系、涂料和薄膜、军事用品、电子、美容品、卫生保 健等都包含其中。碳纳米管由于它们的高比表面积而适合于很多应用场合。与碳纤维相比,碳纳米管轻质量、高弹性,高表面积使其作为特殊使用时的化学相互作用增强。热重分析仪作为一种简便的分析技术经常被用于表征用纳米管。 Pyris 1 TGA由于其小质量的 炉体,快捷地提供准确的结果。Pyris 1 TGA的小质量炉体具有精确的温度控制和快速的冷却能力,因此,样品测试效率更高。 碳纳米材料有多种类型,例如单壁碳纳米管(SWCNT)或多壁碳纳米管 (MWCNT)。单壁碳纳米管是具有一定长度的单根管,它的管壁拥有六边形的中空几何结构,形状上与富勒烯相似。多壁碳纳米管是一个管内有一个或多个管。富勒烯,也就是众所周知的巴基球,是中空的球。石墨烯是只有一个原子厚的碳的平片,也具有与碳纳米管相同的六边形几何结构。碳纳米管是由石墨烯卷曲成圆筒状而得。碳纳米管的规格可以用它们的直径和长度,以及关于碳纳米管中心线的点阵取向来描述。有三种点阵取向,即椅式、锯齿形和手性。这些种类的碳纳米管之间的区别取决于它们卷曲的斜度或角度。 图.1碳纳米管的种类,椅式(n,n)、锯齿形(n, 0) 和手性(Ch)。(n,m)命名纳米管的示意图,可以看作是用在一个无限的石墨烯片上的一个矢量(Ch) 来描述石墨烯片如何卷曲形成纳米管。T表示管的轴,a1和a2表示在真实空间里石墨烯的单位矢量。此图来自维基百科提供的免费使用图4。 使用的材料 我们使用的样品是市售商品化的高纯度多壁碳纳米管。用ICP分析酸洗过的样品,结果显示低于1%的微量元素。 图2.上图所示的是碳纳米管的透射电子显微镜(TEM)照片,碳纳米管有着约20nm的外径,长度大于200nm。 表1所示的是样品在紫外线老化处理之前生产厂家对产品的描述。最右边一列解释了纳米材料的一个主要特征,就是它们的高表面积与质量的关系。1克B型碳纳米管的表面积大于200平方米(>200平方米/克)。生产厂家的碳纳米管的外径用透射电镜照片验证,见图2。 表1多壁碳纳米管的特性 类型 纯度 外径 长度 比表面积 A型 >95% 8-15纳米 约50微米 >233平方米/克 B型 >95% 10-20纳米 10-30微米 >200平方米/克 C型 >95% >50纳米 10-20微米 >40平方米/克 在碳纳米管的生命周期中:在合成、最终产品的形成、最终使用和产品的寿命终点这几个阶段,碳纳米管都有可能进入环境。 图3这个碳纳米管的生命周期图描述了碳纳米管的合成、最终产品的形成过程、产品的寿命终点这些过程中,废物如何进入环境。进入环境可能是散发进入空气,或者排放进入河流,或者是产品生命终结进入垃圾填埋场。此外,环境健康与安全(EHS)工作人员揭露的情况也需要考虑:皮肤暴露、吸入物和摄入3。 图4 Pyrisl热重分析仪(TGA) 定义:热重分析(TGA) 也叫热重法,是一种将材料置于程序控制温度和控制气氛下监测材料的质量变化的技术。 方法通常的方法如下: 仪器: Pyris 1 热重分析仪 样品规格: 大于1毫克,通常3毫克到50毫克 样品皿: 陶瓷 测试温度范围: 30℃到800℃ 扫描速率: 10℃/分钟或者更快 样品吹扫气和气体流量:空气,20毫升/分钟 天平保护气和气体流量: 氮气,至少10毫升/分钟或者比样品吹扫气流量高。 用TGA表征纳米管 比较紫外线下暴露时间对碳纳米管的作用,热重分析是首选的分析技术。TGA是一种非常简单但仍然是非常精确的分析技术,能够快速提供实验结果。有用TGA研究富勒烯C60的氧化的报道5.7。TGA的高灵敏度,可以达到每分钟0.1微克的量级,使得在给定加热速率下,在一个短时间内 又不消耗太多的材料,就能够确定失重量。在一个大气压的空气气氛下用TGA测试每种不同壁厚的碳纳米管样品的氧化率,具有其独特性。图5显示在相同加热速率下样品的分解温度(例如氧化),变化可以多达±40℃,主要取决于碳纳米管的特性。 图5碳纳米管的热重分析显示失重。样品重量约10毫克,氧气流量为20毫升/分钟。样品A,B,C壁厚不同。规格见表1。 碳纳米管的测试老化 在实验室环境中,我们分析了三种没有特殊卷曲的高纯度多壁碳纳米管样品。它们有几乎相同的重量,而且来自同一个生产批次。它们被放置于同一个紫外光源下。用紫外光的目的是以可控的方式模拟太阳光。 图5所示的是三个"A型"样品,它们暴露在紫外线下的时间不同 ·一个暴露9小时 ·一个暴露5.5小时 。一个暴露4小时 这个实验结果显示在碳纳米管中无定形碳的分解在结构碳分解之前。在氧化环境中,达到900℃之前所有碳都将分解。 图6X轴为温度:观察热重分析仪的失重对温度曲线时,上面所示的失重曲线显示暴露于紫外光下9小时的碳纳米管与其他两种暴露时间短的样品相比,在较低的温度分解。 图7X轴为时间:为对结果有更好的理解,相同的数据文件显示在时间为X轴的图上。每个失重曲线的一阶微分曲线也显示在图中。一阶微分也是用来表述TGA的失重曲线的一种广泛应用的工具,像失重曲线一样,一阶微分曲线是也重复性非常好的。在检查上图所示的一阶微分曲线时,暴露于紫外线下时间最长的样品的分解时间比其他两种暴露时间短的样品早5分钟多。 基于Pyris1TGA收集的数据,紫外线对碳纳米管有改性作用。由本研究结果可知,碳纳米管在紫外线下暴露的时间越长,加热到高温时碳纳米管的分解越迅速。 进一步的研究 由于本文的结果在整个系列碳纳米管的分析实验中还处于早期阶段,还需要做更多的TGA实验。下一步最好做一系列的等温实验。实验中应包括更长的紫外线暴露时间和与本实验相似的暴露条件。基于所得扫描升温的数据,等温实验建议在500℃, 550℃,600℃和650℃进行。这些进一步的等温实验有助于检查水中、土壤中或空气中的碳纳米管的实验方案的确定。 结论 用Pyris 1 TGA热重分析仪是一种简单便捷的分析技术,经常用于表征碳纳米管。由于其小炉体质量, Pyris 1TGA可以快速提供精确结果。Pyris 1 TGA的小质量炉体具有精确的温度控制和快速冷却性能,因此,样品测试效率更高。 PerkinElmer, Inc. 珀金埃尔默仪器(上海)有限公司 地址:上海张江高科科区李冰路67弄4号邮编:201203电话:8008205046或 021-38769510 传真:021-50791316 www.perkinelmer.com.cn PerkinElmer° ( 要获取全球办事处的完整列表,请访问http:// www.perkinelmer.com.cn/AboutUs/ContactUs/ContactUs ) 版权所有 ◎2012, PerkinElmer, Inc. 保留所有权利。PerkinElmer 是PerkinElmer, Inc. 的注册商标。其它所有商标均为其各自持有者或所有者的财产。 ( 参考文献 ) ( 1 . Mansfield, E., Kar, A., Hooker, S.A., 热重分析在单壁碳 纳米管的质量控制中的应用, Analyti c al and BioanalyticalChemistry 分析和生物分析化学, Vol. 36 9 , N u mber 3, 1071-1077.2009. ) ( 2. Ozin, G .A., Arsenault, A.C., a nd C a demartiri, L., 纳 米化学-一种化学方法制备纳米材料, Royal Society o f Chemistry, C ambridge, U . K., 2009. P a ge 209. ) ( 3.国家纳米技术方案-人类健康专题讨论会, November 2009, Washington D.C., US. ) ( 4. 维 基百科,碳纳米管, Nov. 2010, h ttp://en.wikipedia.org/ wiki/Carbon_nanotube#Structural ) ( 5. Pang L.S.K. , Saxby, J.D., and Chatfield, S .P., 碳纳米管 和纳米颗粒的热重分析, J. Physical Chemistry, 97, 27, 1993. ) ( 6. Saxby , J.D., Chatfield, S.P., et al, 空气中巴克明斯特富勒烯及相关材料的热重分析, J. Phys. Chem. 19 9 2, 96,17- 18. ) ( 7. Joshi, A., Nimmagadda , R . , and Herringt o n, J., 热重分析 研究钻石、石墨和化学蒸汽沉积钻石薄膜的氧化动力学, J. Vac. Sci. Technol. A 8(3), May/June, 1 990. ) 更多的阅读 铂金埃尔默,纳米技术和纳米材料工程PerkinElmer,Nanotechnology and Engineered Nanomaterials-入门 A Primer, www.perkinelmer.com/nano 铂金埃尔默,纳米材料参考文献图书馆PerkinElmer, Nanomaterials Reference Library www.perkinelmer.com/nano 致谢Acknowledgement 特别感谢美国环保署的萨勒德梅西和A赵A. Zhao2011年提供TGA数据。这些热重数据取自正在进行的碳纳米管对环境的影响研究课题。 热分析和光谱联用技术代在表征纳米粒子和有机污染物相互作用中的应用 功能化修饰纳米粒子(ENP)应用非常广泛,已被用于服装、化妆品、电子信息、生物医药、化工、能源、环保、食品、材料和光学产品等诸多领域。ENP对环境和人类健康的作用很大程度上依赖于它们极高的比表面积和特殊的表面特性。虽然针对天然胶体对环境的影响已有很多详尽的报道,但人们对于ENP的寿命、传输机理、毒理特性和与污染物间的相互作用还知之甚少。因此急需开发新的表征手段来研究这类相互作用。 污染物与胶体间的相互作用 许多悬浮在天然水中的纳米粒子都会与污染物或者蛋白质材料发生相互作用。而ENP的物理化学特性大大地影响着它的独特性和表现性,包括较高的比表面积、较高的界面能和较高的表面电荷密度比。 毒性有机化合物(HOC)的相分布和分配比可显著影响水生系统和水生微生物系统中污染物的寿命和生物利用率。许多有机和无机污染物都与HOC在颗粒中的相分配有关。这种分配与HOC溶解性的对数和颗粒浓度的对数呈反比。纳米粒子中水的分配对其动态分配有很大影响,因此,了解持久性有机污染物,例如多环芳烃,多氯联苯的的寿命,传输和病理学特征是相当重要的。水生环境中有机污染物的寿命很大程度上取决于它们在纳米粒子和胶体中的分配行为。 图1.多环芳香烃及其衍生物的悬浮固体有机碳分配系数对Kow的曲线(Karickhoff et. al., Water Res.,241 (1979).(从下到上分别是:苯,萘,2-甲基萘,菲,蒽,9-甲基蒽,甲氧氯,芘,四苯,六氯联苯) 吸附在功能化上纳米粒子的污染物 污染物在有机相、水相和固体悬浮物三相之间的分配系数会使水相中的污染物在吸附于纳米颗粒表面。 辛醇-水溶液分配系数(Kow)。 该系数是指化合物在辛醇(非极性溶剂)中的溶解度与它在水(极性溶剂)中溶解度之比。Kow值越大,化合物的非极性越强。Kd是吸附于颗粒上的污染物浓度与其在水相中的浓度之比。 这里Co, Cw'和Cp分别指非极性有机相中的有机污染物浓度,在等量水中的有机污染物浓度和吸附于每单位质量颗粒上的污染物浓度。在理想情况下,这些系数代表了污染物在有机相、水溶相和颗粒相之间的平衡分配情况。 图2.悬浮纳米粒子对疏水性有机污染物在辛醇-水相分配系数的影响 环境中表现为疏水性的有机化合物的物理、化学性质主要是受水中溶解度和辛醇-水分配系数影响。水溶性Sw是指溶解物在水和溶质之间的分配平衡。换句话说,是指溶解物在溶液中可以达到的最大平衡浓度,该浓度指标在某些浓度控制步骤中可以(如动力学过程)起到限制作用。辛醇-水分配系数是化合物在辛醇和水中平衡时的浓度之比。辛醇是一种有机溶剂,可以作为天然有机物的替代品。在许多环境研究中常用此参数来确定化学物的寿命,例如预测渔业中污染物在生物体内的累积程度。辛醇-水分配系数与水中溶解度有关;因此,可以用一个物质在水中的溶解度来估计其辛醇-水溶液分配系数。而纳米粒子的存在会影响疏水性有机污染物的辛醇-水溶液分配系数。 测量技术 我们选择小分子量的多环芳香烃 (PAHs)作为研究对象,包括蒽、萘和菲作为探针分子研究疏水性有机污染物在纳米粒子水溶液中的寿命和运输机理。实验步骤为:向含有不同浓度(0-20mg/L)纳米粒子的去离子水(900mL)的锥形瓶中中加入200mL含0-20mg/L多环芳香烃(PAHs) 的辛醇。搅拌5天后,将混合物静置3小时,等待水相和辛醇相完全分离。悬浮液被分为三部分。一部分可以用等体积的二氯甲烷(MC)和己烷萃取。混合物经离心分离得到上层有机相,再将其注入到PerkinElmer公司产的Clarus 600 GC气相色谱仪中。用气相色谱仪可测定二氯甲烷、己烷和水中的多环芳烃(PAHs)的浓度。第二部分在每分钟10,000转的速率下离心30分钟。倾析混合物,然后将得到的纳米粒子放入i埚在在箱中,在105℃下干燥8小时。采用热重分析(PerkinElmer)和傅里叶变换红外光谱或总有机碳仪分析干燥的颗粒所吸附的有机物质量分数。 图3.配备有自加热传输线的PerkinElmer TGA-GC-MS联用仪示意图 图4.PerkinElmer TGA-GC-MS联用仪图片(细节) 图6.吸附了菲的TiTO,纳米粒子的热重曲线, PH=10(曲线A)和PH=6.6(曲线B) 图7.TGA-GC-MS曲线和扫描电镜(SEM) 图像 总结: 。TGA-GC-MS是一种研究纳米粒子对多环芳烃吸附和分配影响,的高效分析手段。 ·纳米-TiO,的加入提高了多环芳烃向水相中的分配系数。 。纳米粒子会使PAHs分配系数增加,比在水-辛醇平衡条件下高出6-10倍。 ·虽然萘和菲溶解性很低,但是仍有不同的分配系数。 ·PH越高,分配系数影响越大。 ·无光条件会使纳米粒子的亲水性减弱,而其在有机相中的分布增强。 ·研究表明纳米粒子(NP)的环境风险应该包括其转化和在转移过程中对其他污染物的影响。 Additional Reading 1. PerkinElmer, Inc. Nanotechnology and EngineeredNanomaterials -A Primer, www.perkinelmer.com/nano 2. PerkinElmer, Inc. Nanomaterials Reference Library www.perkinelmer.com/nano References ( 1. Bom, D ., Andrews, R., J acques, D ., Anthony,J . , C hen, B., Meier, M.S., Selegue, J . P. , Thermogravimetric Analysis of the Oxidation of Multiwalled Carbon Nanotubes: Evidencefor the R ol e o f Def ects Sit es i n C a rbon N an otubeC hemis try, NanoLetters, 2002, 2 ,6,6 1 5-619. ) 2. Pinault, M., Mayne-L'Hermite, M., Reynaud, C.,Beynaud, C., Beyssac, O., Rouzaud, J.N., Clinard, C.,Carbon nanotube produced by aerosol pyrolysis: growthmechanisms and post-annealing effects, (2004) 13,1266-1269. 3. Penn, S.G., He, L. andNatan, M.J.,Nanoparticles forbioanalysis. Current Opinion in Chemical Biology 2003, 7,609-615. PerkinElmer, Inc. 珀金埃尔默仪器(上海)有限公司 地址:上海张江高科技技区张衡路1670号邮编:201203电话:021-60645888 传真:021-60645999 www.perkinelmer.com.cn ( 要获取全球办事处的完整列表,请访问http:// www.perkinelmer.com.cn/AboutUs/ContactUs/ContactUs ) 版权所有 ◎2012, PerkinElmer, Inc.保留所有权利。PerkinElmer@ 是PerkinElmer, Inc. 的注册商标。其它所有商标均为其各自持有者或所有者的财产。010327_01 _CN 简介 实验室经常需要分析未知混合物确定其主要成分、获取其中的添加剂或污染物种类以及含量等信息。这些信息在某些应用场合是至关重要的,例如,剖析竞争对手产品配方或者评价产品的指标是否遵循行业规范等等。光谱分析技术在研究预分离纯组分的样品方面已经建立了大量较为成熟的方法,分离和离析过程可以借助热重分析仪、傅立叶变换红外光谱仪和气相色谱仪等完成。而对于复杂混合物样品体系,将这些常规技术进行联用则是更为有效的检测分析手段。珀金埃尔默公司可提供全套成熟的联用解决方案,在本案例中,通过使用TL-9000型传输管线有效的将热重-红外-气相色谱/质谱分析仪器进行联用,可用于分析复杂样品体系。三联机解决方案如图1所示。 图1自左向右:珀金埃尔默Clarus6000型气相色谱/质谱,珀金埃尔默Frontier傅立叶变换红外光谱仪, Pyrisl热重分析仪和TL9000温度控制模块。黑色的传输管线是TL9000型连接系统的传输管路部分 本文选取了近期典型的案例:分析实验室对一组染色的水性样品进行了系统分析。 由于水对光谱分析有强烈干扰,所以样品均在在室温预先进行干燥处理。当干燥过程完成后,将所得到的薄膜从烘干盘上剥下,然后置于干燥空气流中进行短暂加热。从所得薄膜上取部分样品放入与红外光谱仪联机的热重分析仪当中。样品重量为20毫克,在氮气气氛下以20C/min的速度从20度加热到850度。在加热过程中,样品所释放的气体通过TL-8000型加热传输管线和接口被导入红外光谱仪的气体样品池。因此,在热重分析过程中,可以同时对样品所释放出的气体进行实时红外光谱分析。图2所示为热失重与温度的关系曲线。 图2从室温到850℃的样品失重(红色线)和失重速率(蓝色线)对温度的曲线 在20℃到150℃之间对应样品中残余水分1.38%的失重过程。在200°℃到410℃之间,存在一个归属于挥发性组分挥发的显著失重台阶,在该温度区间同时还伴随着聚合物的初始分解过程。聚合物部分主要分解过程发生在410℃到510℃的温度范围内。 在热重分析仪的热分离过程中,样品所释放的气体被实时输送到傅立叶变换红外光谱仪中进行红外数据采集。热重-红外数据包含了每间隔约8秒采集一次所得到的一系列的谱图。标准的红外数据显示格式为吸收率对波数曲线,样品逸出气体的红外光谱图采集密度大约为每升温2度采集一组谱图。热重-红外联用的Time-Base软件还可以辅助绘制三维坐标图谱,可同时显示叠加的红外曲线随时间或者温度以及波数的关系,用户可以非常直观的了解样品在整个温度平台中的热重-红外数据变化情况(如图3示)。这有助于阐述样品分解过程的动力学,确定选取哪个温度区间展开精细分析。此外,分析人员还可以查看任何特定波长对应的吸收与时间的谱图,以跟踪所关心的分解产物浓度对时间,乃至温度的关系。 图3Time-Base软件输出的谱图效果汇总,有助于阐述样品分解过程。对于经验丰富操作人员,通过观测三维叠加谱图(右上角所示),可轻易的发现任何可能影响产品性能的微量组分所对应的“未预料到的峰区域” 通过观察图3的数据,作者观察到逸出气体中包含一种未知物质,在280℃处该物质的逸出速率达到最大。选择该温度下的谱图进行数据库比对分析。从这个数据库搜索发现这种未知物质属于三乙二醇二苯甲酸酯-或者结构类似的物质。图4显示的是未知样的红外谱图以及搜索到的最匹配物质的红外谱图。图5列出了其他匹配物质,一起列出的还有每个匹配物的相关统计匹配程度。 图4采用珀金埃尔默图谱搜索软件得到的最佳匹配图谱。 然后, TL-9000接口被用来进行后续分析,以证实样品中的未知物质的鉴定准确度。选取该物质红外吸收浓度达最大值时进行分析,将红外气体池中的气体样品送到气相色谱/质谱仪中。气相色谱数据如图6所示。 图6气相色谱图,吸收强度对时间轴(分钟为单位) 280°C时从热重分析仪逸出的物质,进一步用气相色谱解析,然后用质谱分析仪评估,由此未知分子结构被打碎成为组分离子,根据它们在磁场中飞行响应的不同加以鉴别。结果与已建质谱数据库的数据作比较。 国家科学技术研究院(NIST)的质谱数据库搜索未知物质形成的输出结果如图7示。 图7TurboMass软件输出显示质谱谱图结果和NIST质谱数据库搜索结果。 未知物质经证实为二乙二醇二苯甲酸酯,化学结构与红外分析确定的物质非常相似,这两种物质红外谱图不能进行有效鉴别。 在文献中搜索二乙二醇二苯甲酸酯的化学特性显示该物质属于一种化学性质稳定、具有较高沸点的清澈液体。该物质微溶于水,与聚合物材料相容性较好。尤其是与聚乙烯醇和聚氯乙烯能够极好的相容,因此常被用于聚乙烯醇均聚物和共聚物乳液的增塑剂。此外,它也被用做聚氯乙烯涂层、食品包装粘结剂和涂料,以及化妆品工业的增塑剂等等。由于在老鼠活体实验中显示该物质具有表观毒性,因此将其作为增塑剂使用和如何妥善处理含有这种物质的废弃物时需要法规加以监管。 热重-红外的进一步分析显示在300到400°C之间样品中的聚合物分解释放出醋酸,如下图示;因此,样品中的聚合物极有可能是聚醋酸乙烯酯: 图8测试聚合物薄膜样品第一阶段最大失重速率(下半部分图)处的红外谱图(上半部分图)。 小结 将多套分离分析仪器联机进行测试的勺的"联用技术",如热重-红外和热重-气相色谱-质谱联用技术,配合强大的搜索软件以及完善的谱图数据库,赋予分析人员能够对未知水性混合物进行有效全面的分析,其中添加的各种组分得以鉴别。 PerkinElmer, Inc. 珀金埃尔默仪器(上海)有限公司地址:上海张江高科科技区张衡路1670号邮编:201203电话:021-60645888传真:021-60645999 www.perkinelmer.com.cn 要获取全球办事处的完整列表,请访问http://www.perkinelmer.com.cn/AboutUs/ContactUs/ContactUs 版权所有 ◎2012, PerkinElmer, Inc.保留所有权利。PerkinElmer@ 是PerkinElmer, Inc. 的注册商标。其它所有商标均为其各自持有者或所有者的财产。010313_01_CN TG-IR联用技术用来分析土壤污染物 介绍 碳氢化合物进入土壤,使土壤受到污染可有几种途径,如燃料通过储存罐或者传输线泄露,雨水径流洗车地方只是两个例子。因此,测试土壤污染在环境监测或土地复垦中尤为重要。通过溶剂萃取法和红外光谱法测试总石油烃(碳氢化合物)(TPH)是一个灵敏的方法,但样品制备非常麻烦。而气相色谱分析提取物能提供更高的灵敏度和更详细的成分信息,但分析所需时间过长。 热重分析和红外光谱(TG-IR) 联用技术可以提供关于污染物数量和性质的详细信息,而且无需样品制备。本文将介绍热重和红外(TG-IR)联用技术得到的数据及分析结果。 实验方法 将一份土壤样品和浓度大约度 10%m/m 的柴油混合,土壤样品为17毫克,放入 PerkinElmer TGA 4000 热重分析仪的埚中。TGA 4000 通过 TL8000 传输线和 10-cm气体池与 PerkinElmer SpectrumM 100型红外光谱仪联接。传输线和气体池温度为280℃,以避免任何重有机化合物的凝结。热重的反应气体为氮气,流速为20mL/min,天平吹扫气流速为40 mL/min, 共以60 mL/min 流速通过传输线和气体池。以20°C/min 的恒定速率从30°C加热到为800℃。红外光谱范围为4000-600cm-1,分辨率为8 cm-1,每12秒采集一次数据(每个频谱合加4次干涉扫描)。Pyris软件用来控制和分析热重数据, TimeBase TM软件用来收集和分析同步的时间分辨红外数据。 结果讨论 该土壤样品的失重曲线如图1所示,总体来说,有三次显着的失重现象:第一次从略高于室温开始,第二次开始于100℃左右,并一直持续到250℃,第三次开始于250℃左右,一直到600℃左右。在700℃,约65%的土壤仍然是未燃烧状态,这可被假定主要为无机材料。 图1、被污染的土壤样品失重曲线(红色实线)和失重微分曲线(蓝色色线) 红外吸收的平均强度由Gram-Schmidt 热像图和失重曲线及失重的微分曲线图,如图2所示。红外检测到的逸出气体的瞬时吸收浓度和重量损失率成正比(除其他因素外),因此可推断Gram-Schmidt 热像图和失重的微分曲线图之类似。 图2、被污染的土壤样品失重曲线(红色)、失重微分曲线(绿色)和 Gram-Schmidt热像图(黑色) 图3显示了选定的红外波数区域的结果,并提供了分析过程中丰富的信息。在温度略高于室温时,可看到水蒸气的增加,表明土壤样品不是完全干燥的。热重曲线上第一段失重率大概占5%。Gram-Schmidt 热像图中的第一个高峰发生在约230℃,和第二次失重有关。由光谱图推断(图4),这主要是水蒸汽,脂肪烃,波数约为 1745cm°的酯的混合物。这表明污染物可能是柴油燃料和很大一部分生物柴油(脂肪酸甲酯)。 图3.受污染土壤样品Temperature-based 吸收剖面图。红色: Gram-Schmidt t热像图显示整体吸收强度;深绿色:2933cm附近对应C-H吸收峰,对应脂肪烃(柴油和生物柴油);蓝色:3015 cm-1附近的烯烃C-H吸收峰,对应生物柴油中的不饱和物质;黑色: 3800-3700 cm ;之间水的吸收峰;浅绿色:2370cm附近二氧化碳的吸收峰。 图4、受污染土壤样品TG-IR分析的几个选择光谱 酯的吸收高峰和水蒸汽的有所重叠,但在约3015cm处还有另一个生物柴油选择性吸收峰,对应于烯烃不饱和脂肪酸链的C-H伸缩振动。将峰值强度和温度的关系作图(如图3所示),结果显示高峰出现有一点后移,大约在240℃左右。这一温度范围有10%的重量损失,这与已知的柴油浓度相符合,表明该热重红外联用技术可对污染物的数量以及详细的组成信息有一个大概的测试。 在更高的温度,逸出的主要气体是二氧化碳和水,,由土壤中有机物燃烧而来,为最终的失重部分。TimeBase 软件还绘制出叠加的三维谱图,如图5所示。可以一目了然的看到吸收特征随时间演变的一个完整的数据 图5.受污染土壤样品的三维红外谱图. 在同样条件下,通过 TG-IR 联用分析了土壤样品中添加参照柴油/生物柴油的混合样品作为对比,结果如图6和图7所示。到300℃为止,整个样品已经挥发完毕,在图7中,可以清楚地看到,生物柴油蒸发滞后于化石柴油。由于标准柴油样品中没有水,所以羰基随后直接被吸收。这些数据为证实目前的土壤污染中含有生物柴油/柴油混合物提供了强有力的证据。 图6.生物柴油混合标准样品的失重曲线(红色实线)和失重微分曲线(蓝色虚线) Tomporature(*C) 图7.生物柴油混合标准样品吸收强度随实现谱图。红线: Gram-Schmidt 热像图;蓝线:2933cm-1附近C-H吸收峰;绿线:1745 cm-1附近羰基吸收峰. 结论 热重分析可对样品定量分析提供了有价值的信息,但对物质识别能力有限。而红外光谱具有定性分析逸出气体的能力。本文揭示了 TG-IR联用技术,不仅可确定土壤中存在的柴油数量,还可检测到存在的小部分生物柴油燃料。在土壤分析领域, TG-IR 联用技术一个关键的优势是不用进行样品制备或溶剂萃取,分析速度更快捷,分析方法更方便。 PerkinElmer, Inc.大中华区总部地址:上海张江高科园区李冰路67弄4号邮编:201203电话: (021)38769510传真:(021)38791316 www.perkinelmer.com.cn ( 要获取全球办事处的完整列表,请访问 http:// www.perkinelmer.com.cn/AboutUs/ContactUs/ContactUs ) ( ◎2 009 PerkinElme r , I n c . 保 留所有权利。Pe r k inElm e r徽标 和外 观 设计是P erkinElm e r的注 册 商标 。 文中提 及的其它非Perk inE l me r 及 其 子 公 司所有的 其示 商标均 为 其各自所有者 的 财产。 Perkin Elmer保留随时更改 此 文 档的 权利 ,恕 不另行通 知 。对 于编辑、图片或 排 版错误概不承担任 何 责 任 。 ) 珀金埃尔默企业管理(上海)有限公司地址:上海张江高科技园区张衡路1670号邮编:201203电话:021-60645888传真:021-60645999 www.perkinelmer.com.cn PerkinElmer° 要获取我们全球办公室的完整列表,请访问 www.perkinelmer.com/ContactUs 联用技术应用文章合辑 PerkinElmerFor the Better PerkinElmer 联用技术解决方案是将两种或两种以上的仪器连接使用,最大程度地提高单次实验的分析能力和获取的数据信息并节省操作时间。PerkinElmer TGA 8000TM 或STA 系统与FTIR,MS 和(或者)GC/MS 相连,代表了行业最完整和先进的联用技术平台,可应用于聚合物材料表征,制药,化工,石油,橡胶和食品等领域。其应用包括检测土壤中的有害化学物质,定量测定聚合物中的成分,确定产品包装中是否有可能污染产品的溢出物质,检测PVC 样品中的邻苯二甲酸酯。我们了解客户和市场独特和多样化的需求,我们是行业内唯一一家能够提供全套联用系统的生产,技术支持和售后服务的公司,简化从样品的处理到结果分析、传递的整个过程并使其更加流畅。PerkinElmer 的联用技术将为您的实验室提供创新和科学探索的新途径。
关闭-
1/84

-
2/84
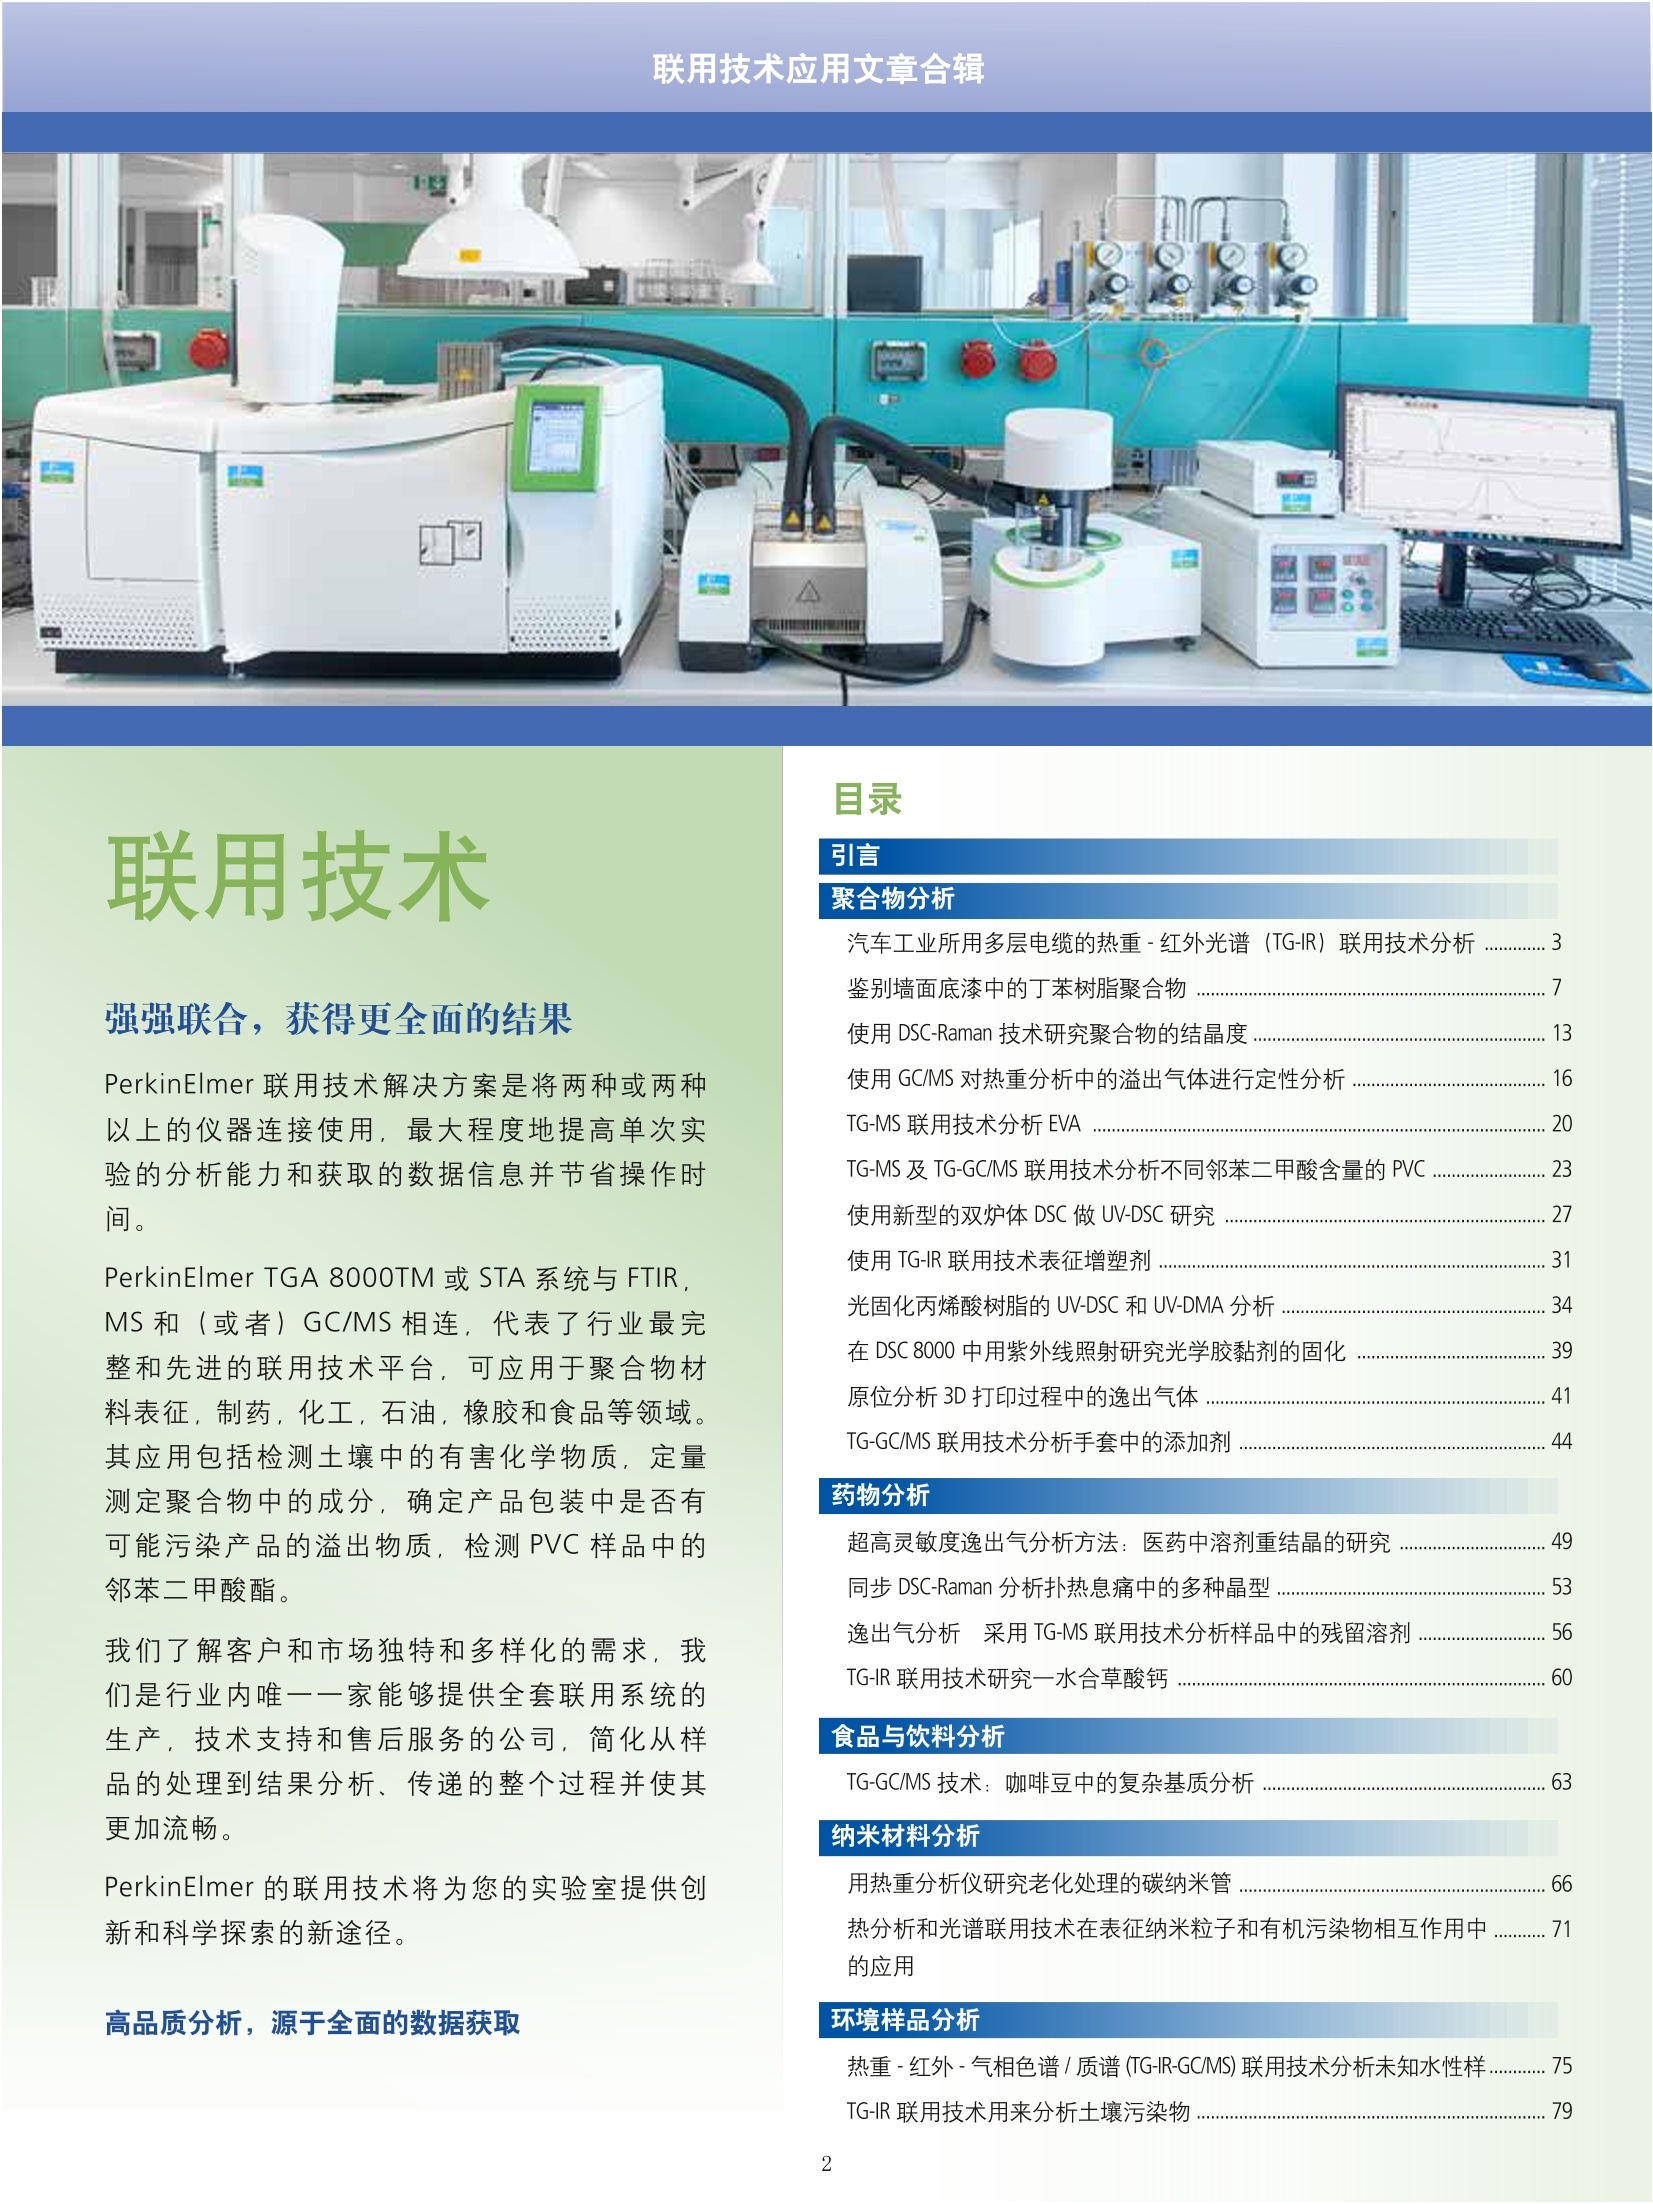
还剩82页未读,是否继续阅读?
继续免费阅读全文产品配置单
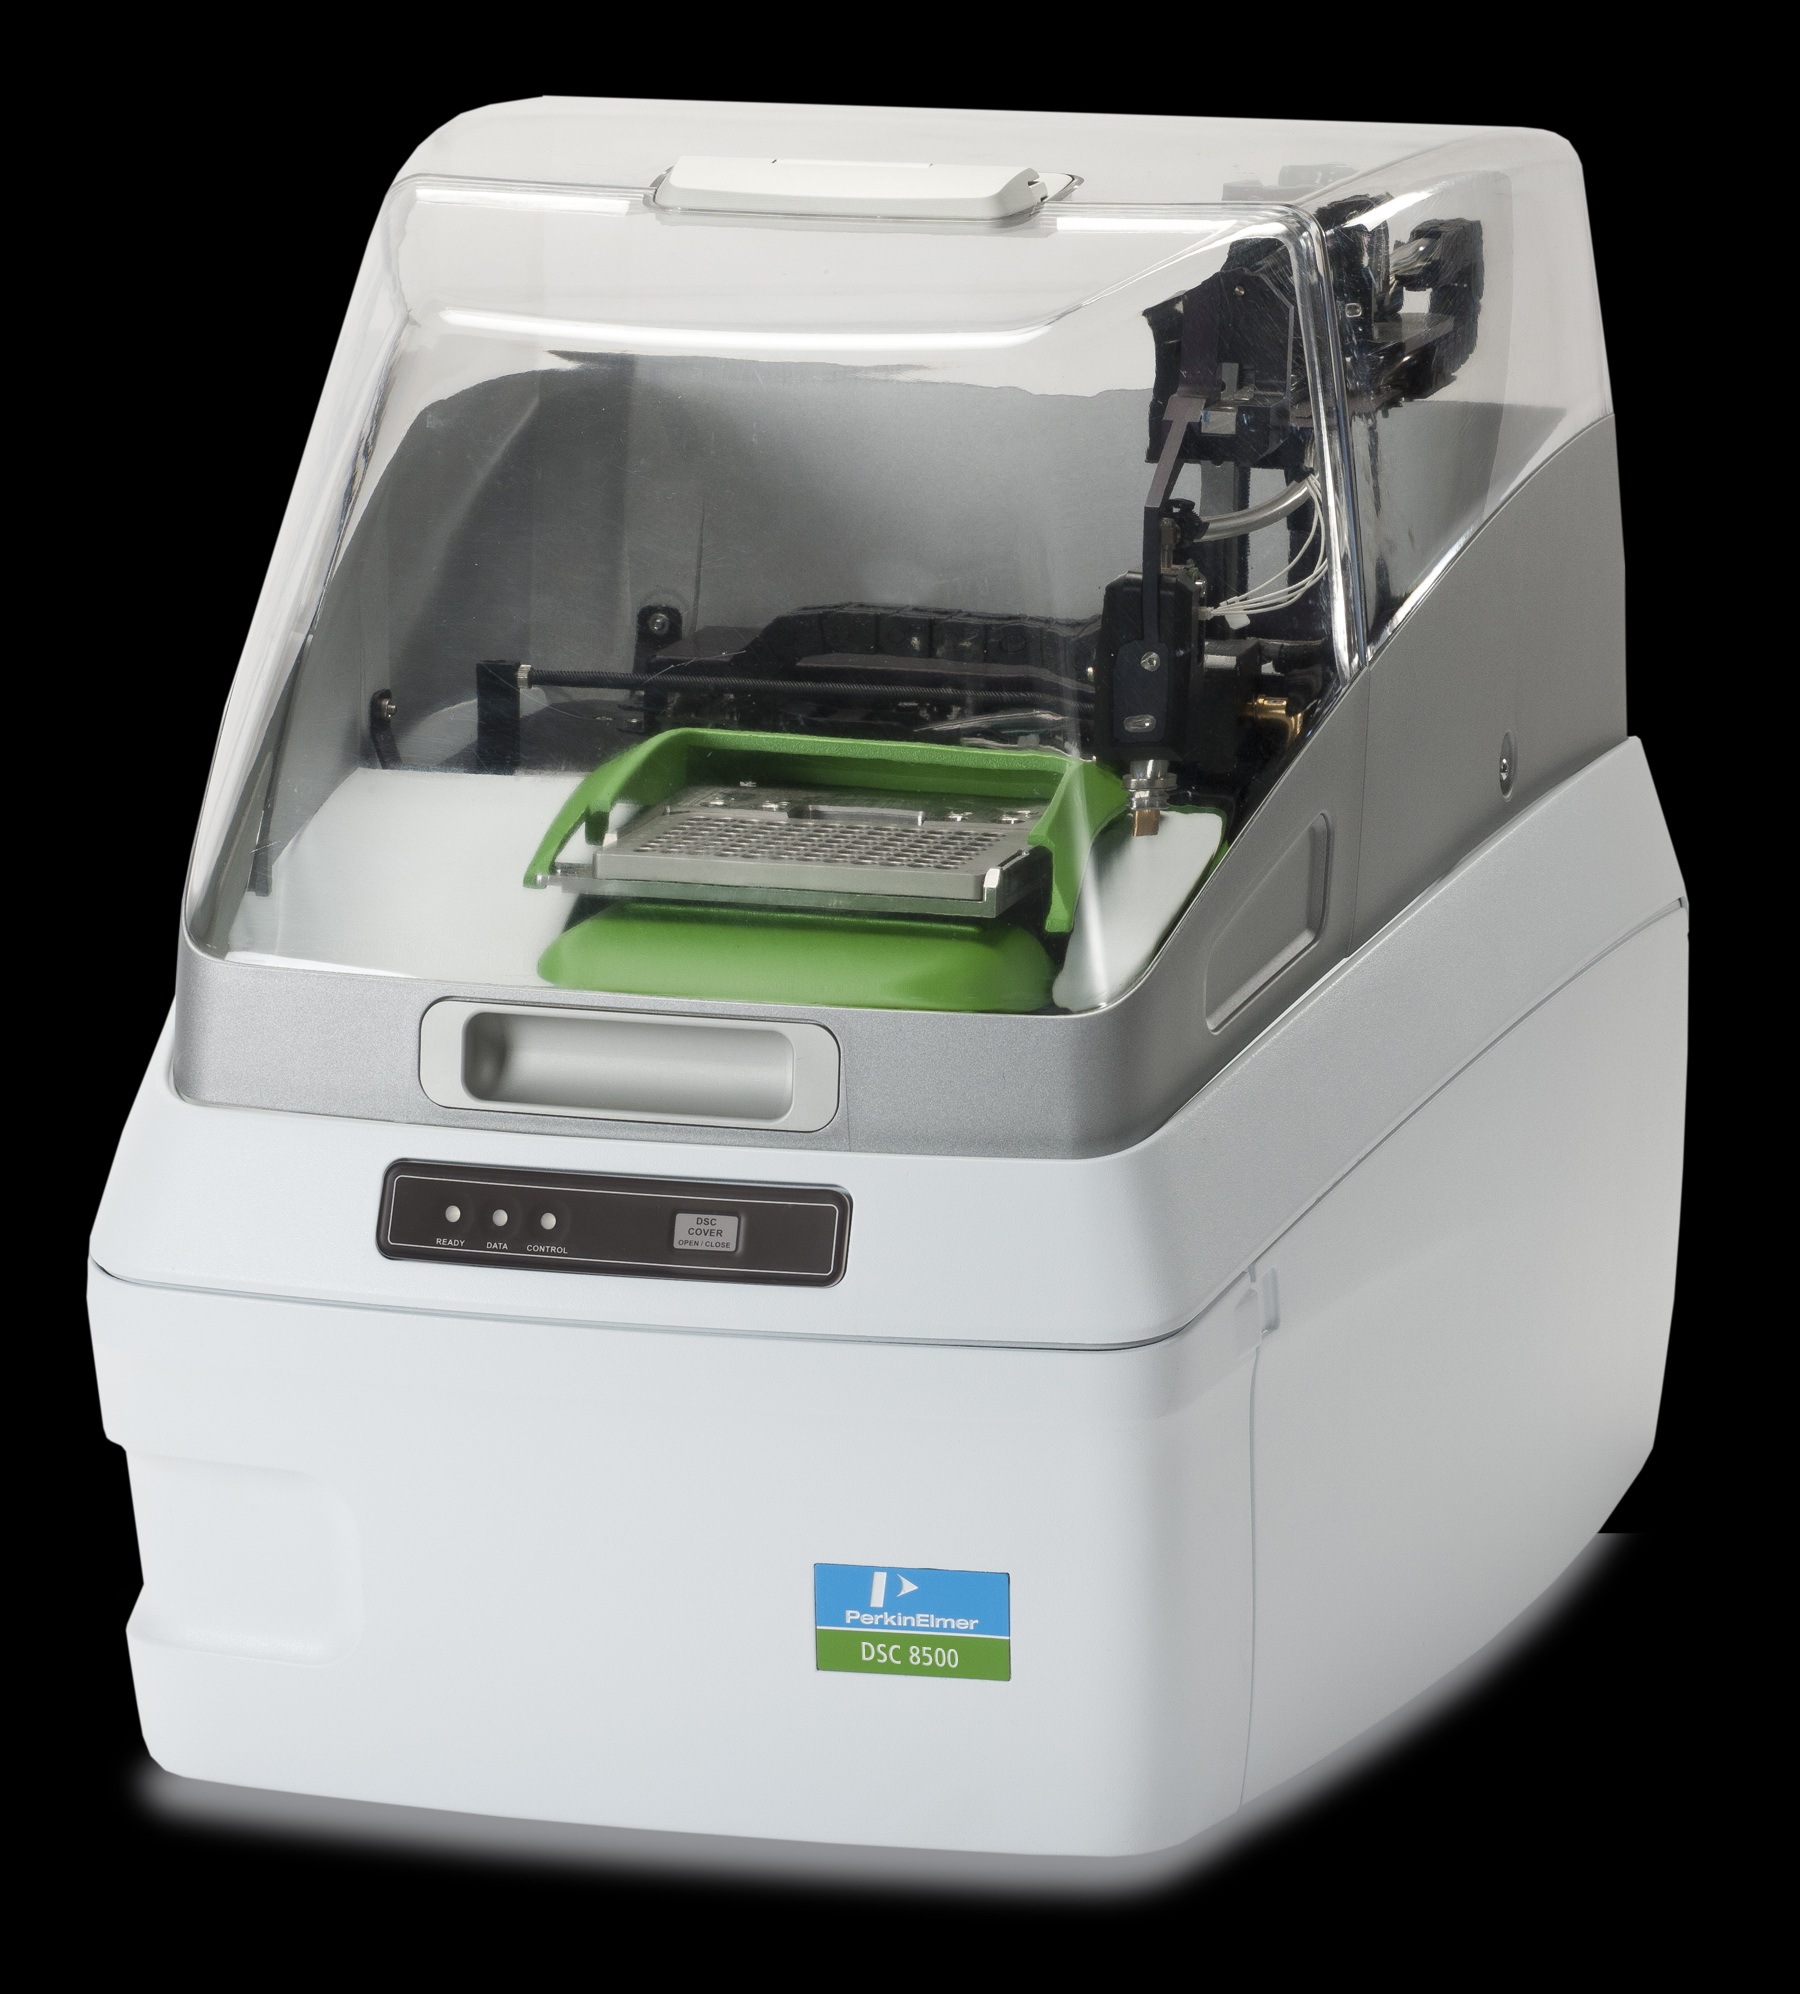
珀金埃尔默企业管理(上海)有限公司为您提供《纳米粒子中有机污染物检测方案(气质联用仪)》,该方案主要用于其他中有机污染物检测,参考标准《暂无》,《纳米粒子中有机污染物检测方案(气质联用仪)》用到的仪器有气相色谱质谱仪PerkinElmer Clarus SQ8 、热重分析仪PerkinElmer TGA 8000 、差示扫描量热仪PerkinElmer DSC8500 。
我要纠错
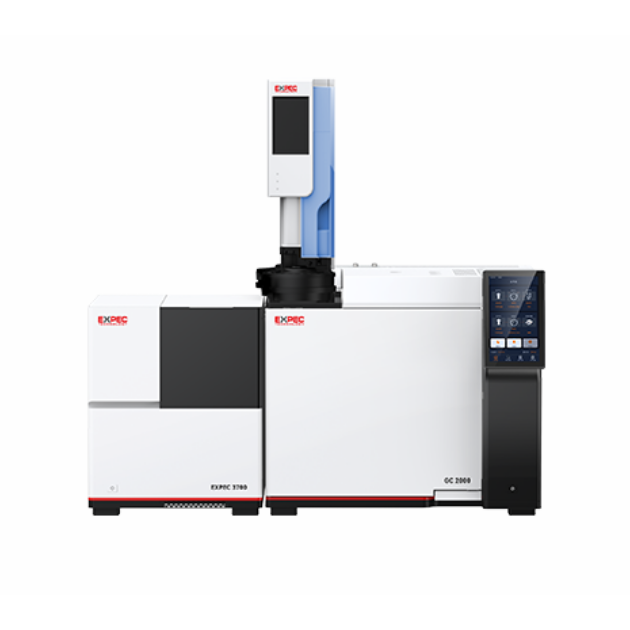
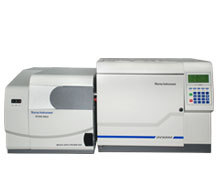
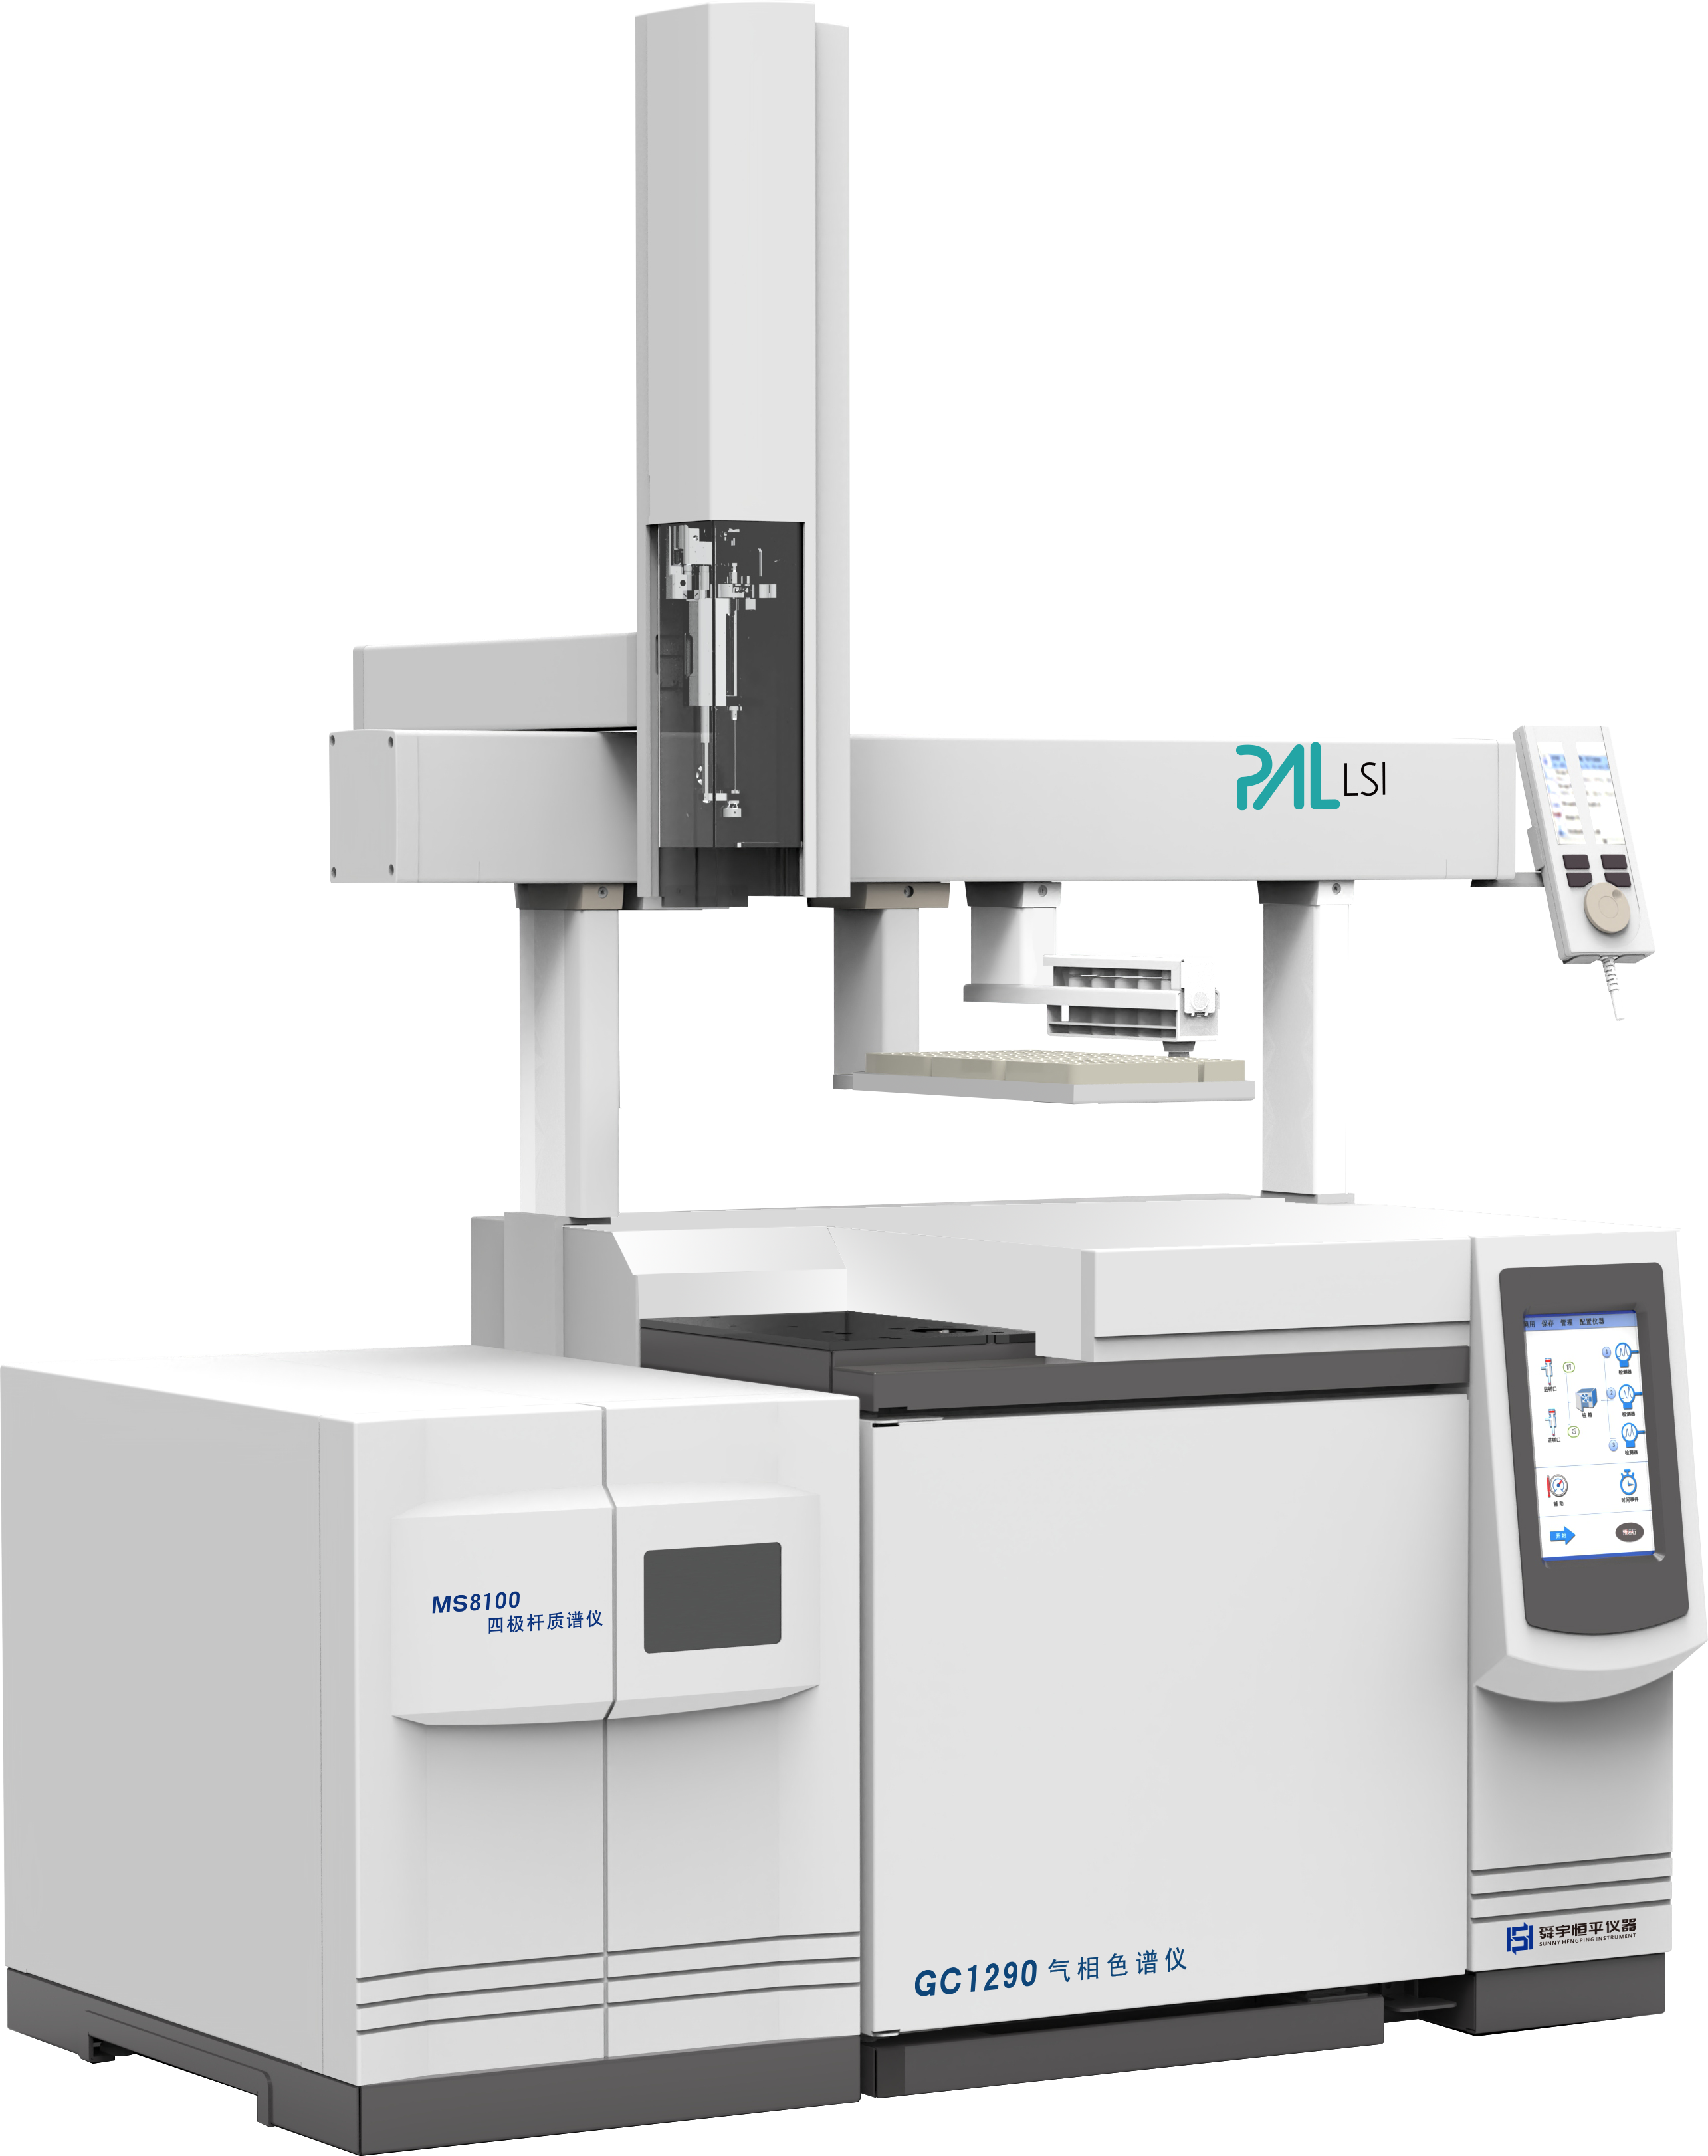
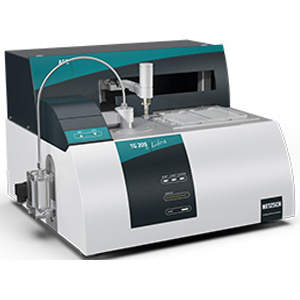
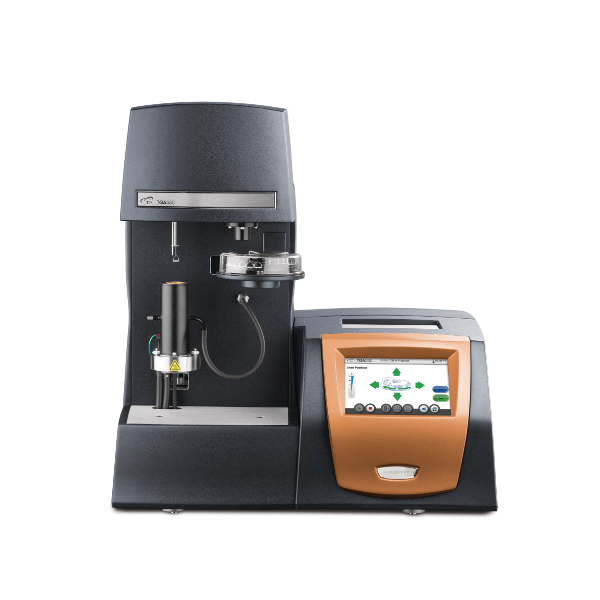
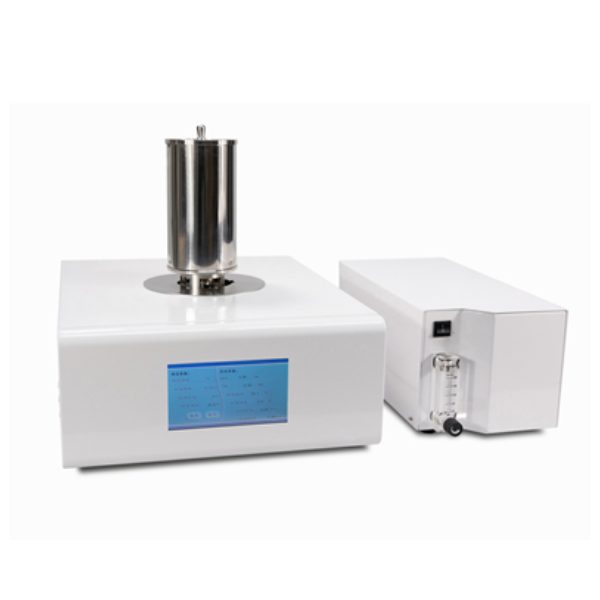
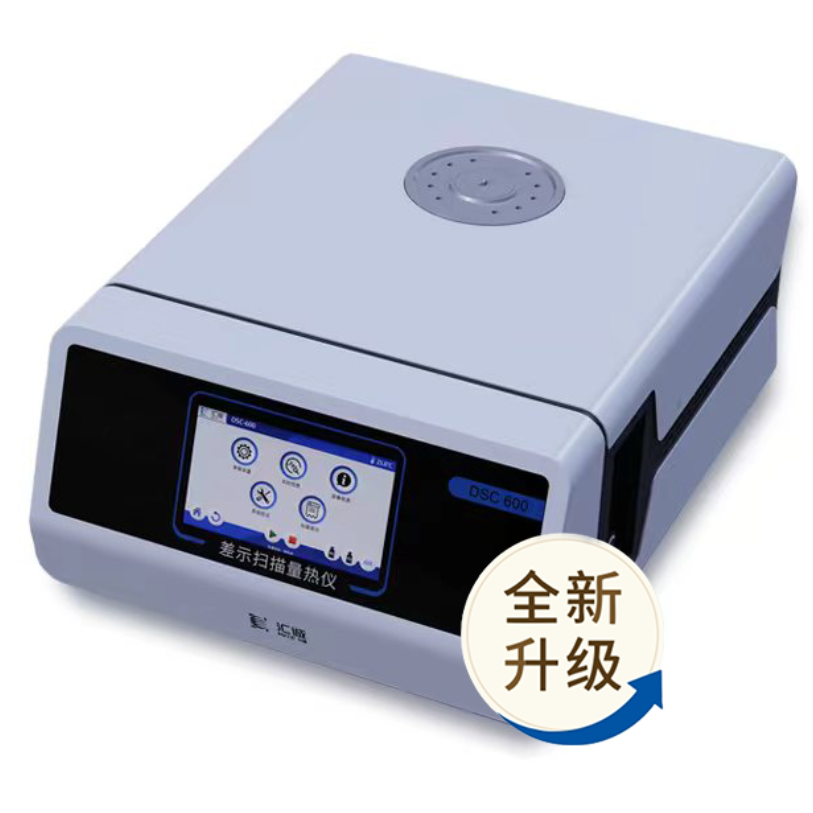
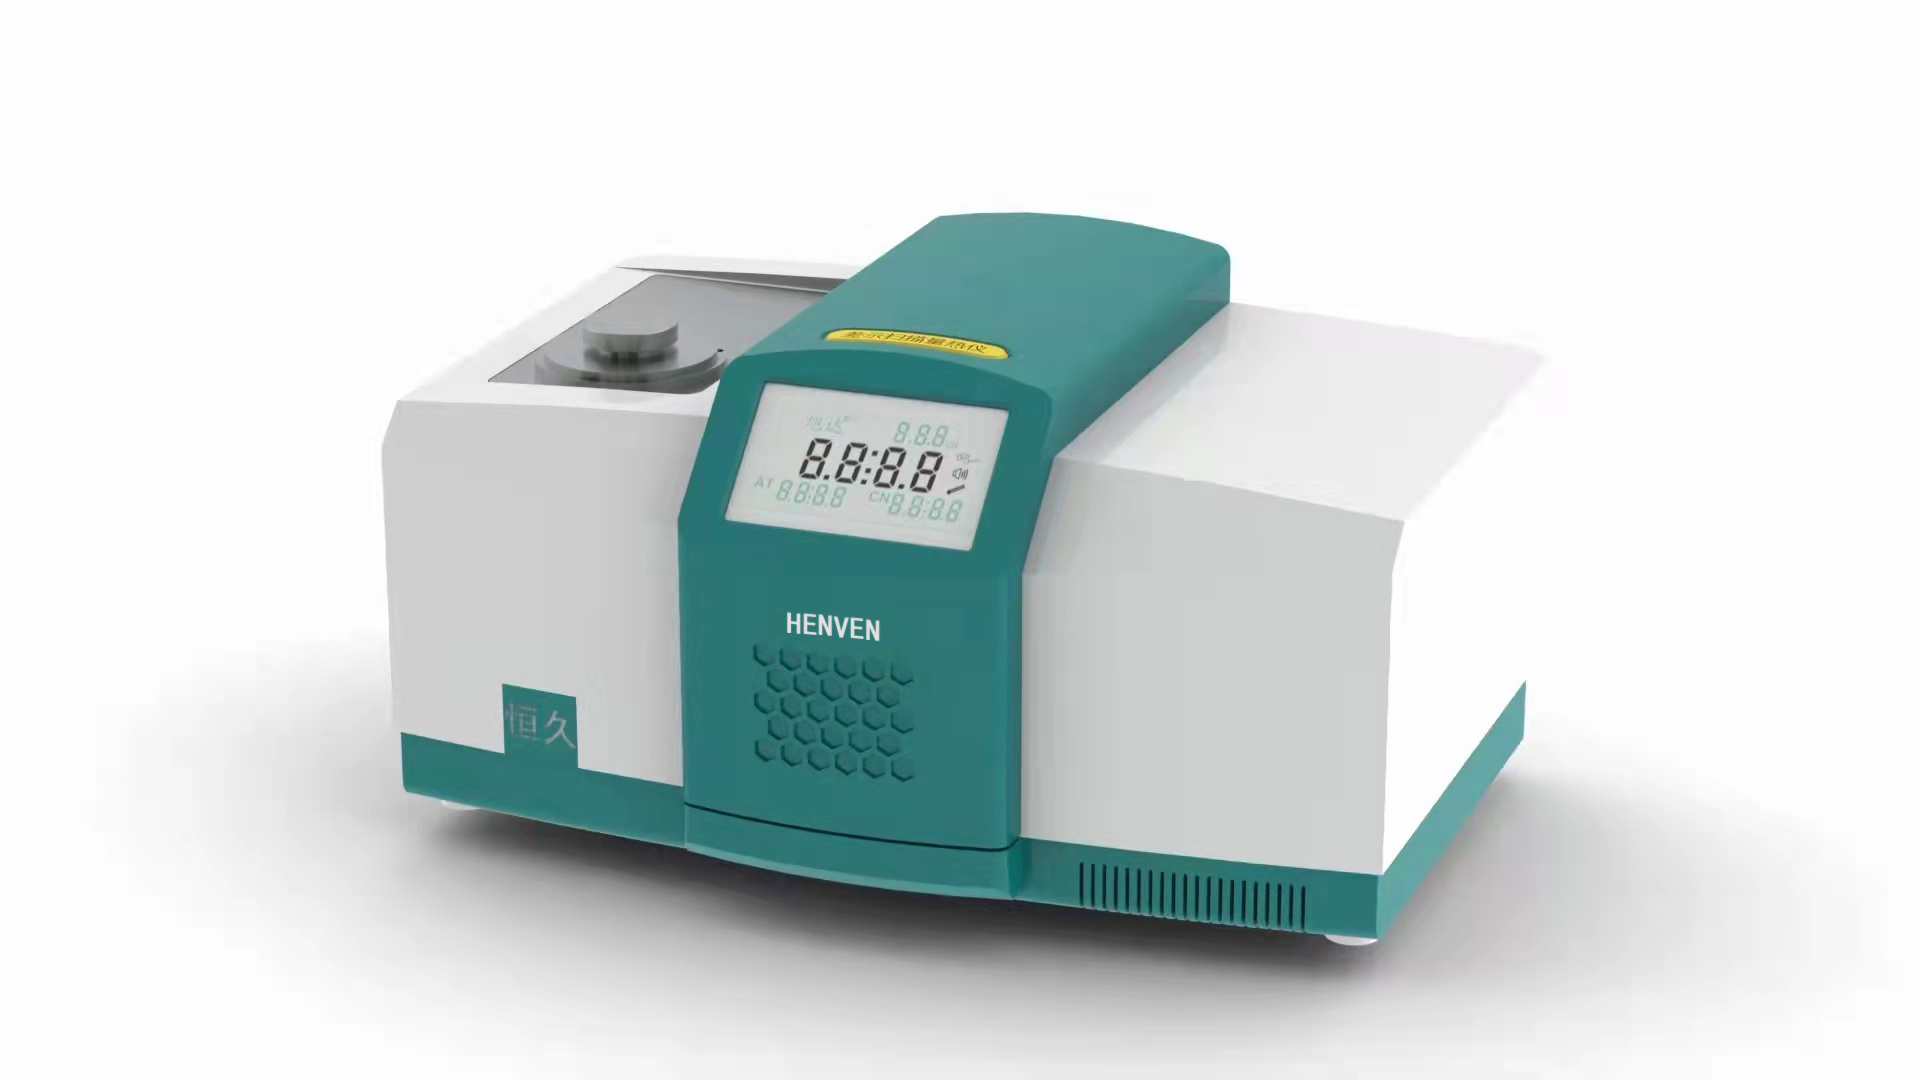
相关方案
 咨询
咨询