

方案详情文
智能文字提取功能测试中
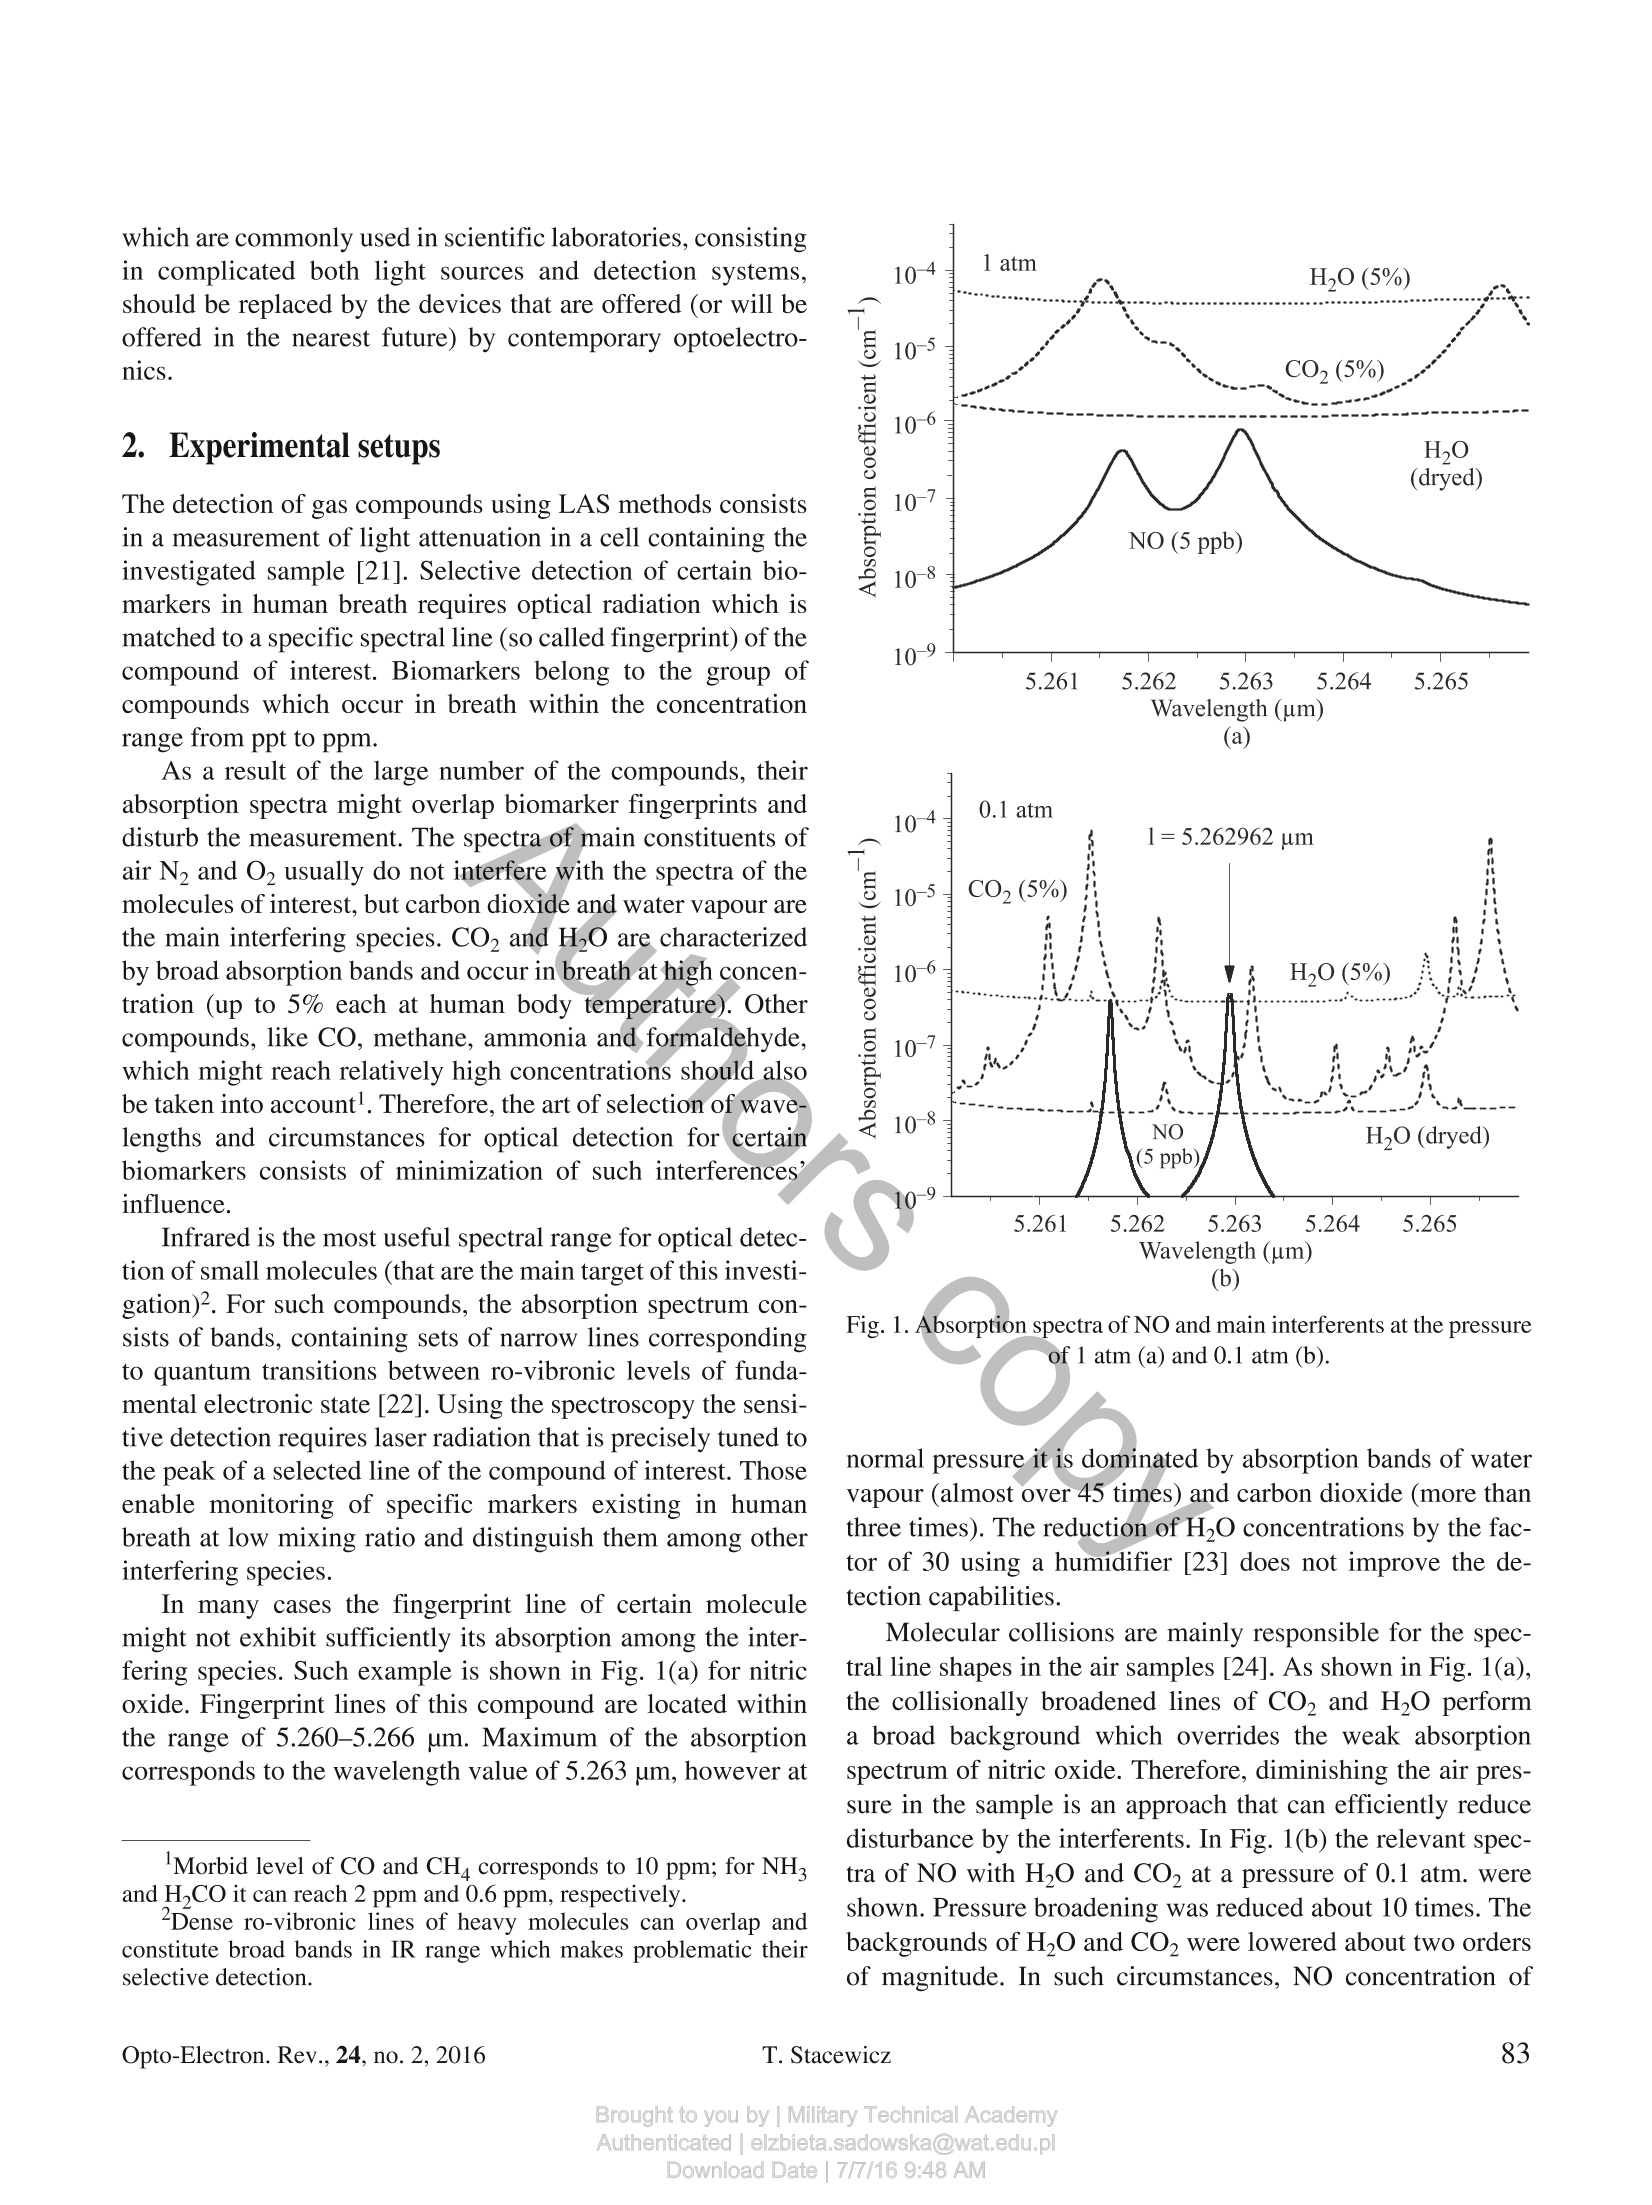
OPTO-ELECTRONICS REVIEW 24(2), 82-94DOI: 10.1515/oere-2016-0011 Detection of disease markers in human breath with laser absorption spectroscopy Detection of disease markers in human breath with laser absorptionspectroscopy T. STACEWICZ*1, Z. BIELECKI, J. WOJTAS2, P. MAGRYTA1, J. MIKOLAJCZYK2,and D. SZABRA- Institute of Experimental Physics, Physics Faculty, University of Warsaw, ul. Pasteura 5, 02-093 Warsaw, Poland2Military University of Technology, ul. Gen. Kaliskiego 2, 00-908 Warsaw, Poland Number oftrace compounds (called biomarkers), which occur in human breath, provide an information about individual featureof the body, as well as on the state ofits health. In this paper we present the results ofexperiments about detection of certainbiomarkers using laser absorption spectroscopy methods ofhigh sensitivity. For NO, OCS, C2H6, NH, CH4, CO and CO(CH3)2an analysis ofthe absorption spectra was performed. The influence ofinterferents contained in exhaled air was considered. Opti-mal wavelengths ofthe detection were found and the solutions ofthe sensors, as well as the obtained results were presented. Formajority of the compounds mentioned above the detection limits applicable for medicine were achieved. The experiments showedthat the selected optoelectronic techniques can be applied for screening devices providing early diseases detection. Keywords: absorption spectroscopy, laser spectroscopy, detection of disease markers. 1. Introduction In air exhaled from human lungs, beside the main gases (N0,Co,HO), about 2000 various compounds were alreadydetected [1,2]. Breath composition depends on individual pa-tient feature, as well as on the state of his health. An excess ofseveral compounds (called biomarkers) is related to certaindiseases. Fast progress in development of breath analysis methods isobserved recently. This activity is motivated by the greatpotential of disease diagnosis or therapy monitoring. In manycases the determination of biomarkers concentration providesopportunity of disease diagnosis at early state, which makesthese methods useful for screening. Moreover, such medicalinvestigation is simple, painless, distressful and non-invasive[3,4]. There is a variety of gas sensing techniques that are usefulfor this application. Gas chromatography combined with massspectrometry and ion mobility spectrometry belong to themost versatile methods of breath composition investigation[5-9]. Other techniques like chemiluminescence [1], fiber op-toelectronic sensing [10], proton transfer reaction mass spec-trometry [11], selected ion flow tube mass spectrometry[12-18], and electrochemical sensing or the electronic noses[19,20] are also widely used for this purpose. Nevertheless, there is still a need to look for a cheap, sensitive and an accu-rate technique which leads to the use of small, affordable,easy-to-use equipment for medical screening. The techniquesmentioned above are not applicable for these purposes. Forinstance, the treatment of a single sample with gas chromatog-raphy is time consuming (about 30-60 min.) and requiresexpensive equipment maintained by specialized staff. Appli-cation of optical methods, e.g., laser absorption spectroscopy(LAS) provides opportunity for fast and sensitive detection ofcertain compounds in a breath. Progress in optoelectronictechnologies opens new capabilities of a trace matter detectionin gases. It also leads to development of the efficient methodsof breath investigation. Moreover, continuous development inoptoelectronics causes miniaturization of optical apparatuswhich leads to the construction of desktop systems. In this paper we present results of our investigations onoptical detection of biomarkers in breath. The main goal wasto achieve substantial progress in early diagnosis of diseasesdue to application of a low cost and simple in maintenanceequipment for the fast medical investigation. Their final goalwill be the design of instrument for test screening in internalmedicine doctors’ cabinets, clinics and in consulting-rooms.Such instruments can be implemented to the clinical practiceas the early-warning, simple and low cost table top systemsfor disease detection in a real time. Simultaneously the instru-ments should be characterized by the sensitivity required formedical application. Therefore, the expensive solutions, which are commonly used in scientific laboratories, consistingin complicated both light sources and detection systems,should be replaced by the devices that are offered (or will beoffered in the nearest future) by contemporary optoelectro-nics. 2.Experimental setups The detection of gas compounds using LAS methods consistsin a measurement of light attenuation in a cell containing theinvestigated sample [21]. Selective detection of certain bio-markers in human breath requires optical radiation which ismatched to a specific spectral line (so called fingerprint) of thecompound of interest. Biomarkers belong to the group ofcompounds which occur in breath within the concentrationrange from ppt to ppm. As a result of the large number of the compounds, theirabsorption spectra might overlap biomarker fingerprints anddisturb the measurement. The spectra of main constituents ofair N2 andO2 usually do not interfere with the spectra of themolecules of interest, but carbon dioxide and water vapour arethe main interfering species. CO2 and H2O are characterizedby broad absorption bands and occur in breath at high concen-tration (up to 5% each at human body temperature). Othercompounds, like CO, methane, ammonia and formaldehyde,which might reach relatively high concentrations should alsobe taken into account. Therefore, the art of selection of wave-lengths and circumstances for optical detection for certainbiomarkers consists of minimization of such interferences’influence. Infrared is the most useful spectral range for optical detec-tion of small molecules (that are the main target of this investi-gation)2. For such compounds, the absorption spectrum con-sists of bands, containing sets of narrow lines correspondingto quantum transitions between ro-vibronic levels of funda-mental electronic state [22]. Using the spectroscopy the sensi-tive detection requires laser radiation that is precisely tuned tothe peak of a selected line of the compound of interest. Thoseenable monitoring of specific markers existing in humanbreath at low mixing ratio and distinguish them among otherinterfering species. In many cases the fingerprint line of certain moleculemight not exhibit sufficiently its absorption among the inter-fering species. Such example is shown in Fig. 1(a) for nitricoxide. Fingerprint lines of this compound are located withinthe range of 5.260-5.266 um. Maximum of the absorptioncorresponds to the wavelength value of 5.263 um, however at ( Morbid level of CO and CH c o rresponds to 1 0 ppm; f or NH and H , CO it can reach 2 ppm and 0.6 ppm,re s pectively. ) ( Dense r o -vibronic lines of heavy m olecules c an overlap a nd constitute broad bands in IR range which makes p r oblematic their selective detection. ) Fig. 1. Absorption spectra of NO and main interferents at the pressureof 1 atm (a) and 0.1 atm (b). normal pressure it is dominated by absorption bands of watervapour (almost over 45 times) and carbon dioxide (more thanthree times). The reduction of H20 concentrations by the fac-tor of 30 using a humidifier [23] does not improve the de-tection capabilities. Molecular collisions are mainly responsible for the spec-tral line shapes in the air samples [24]. As shown in Fig. 1(a),the collisionally broadened lines of CO, and H2O performa broad background which overrides the weak absorptionspectrum of nitric oxide. Therefore, diminishing the air pres-sure in the sample is an approach that can efficiently reducedisturbance by the interferents. In Fig. 1(b) the relevant spec-tra of NO with H,O and CO, at a pressure of 0.1 atm. wereshown. Pressure broadening was reduced about 10 times. Thebackgrounds of H20 and CO2 were lowered about two ordersof magnitude. In such circumstances, NO concentration of Fig. 2. Simplified schemes of optoelectronic biomarker sensors based on: (a) CRDS, (b) MUPASS. 5 ppb at the wavelength of 5.262961 um might be detected.Subsequent reduction of H2O concentration using Nafion hu-midifierprovides the opportunity to measure NO concentra-tion with precision of 0.2 ppb, i.e., to monitor this compoundin breath of healthy man. As far as the breath compounds are usually characterizedby a low absorption coefficient, the most sensitive techniquesof absorption measurement are applied for the detection.Multipass spectroscopy (MUPASS), cavity ring down spec-troscopy (CRDS) and wavelength modulation spectroscopy(WMS) are the most useful for these applications. Schemes ofsuch experimental systems are presented in Fig. 2. Their oper-ation idea was described in details in the publications [25,26]Moreover, photoacoustics spectroscopy (PAS) and its modifi-cation - quartz enhanced photoacoustic spectroscopy(QEPAS)- are applied. Briefly, CRDS [Fig. 2(a)] exploits the experimental cell inthe form of optical resonator (cavity) built with mirrors ofvery high reflectivity [28-30]. The measurement of absorp-tion coefficient of the sample contained inside consists indetermination of the resonator quality (Q-factor) using laserradiation tuned to spectral line of the compound of interest.The Q-factor is found due to the analysis of a photoreceiversignal by the acquisition system. Then, the quality is com-pared with the case when the resonator is filled with a refer-ence gas (without the absorber). The absorption coefficientbelow 10-9 cm-can be observed. The measurement of the -factor is usually carried outwithin two-step process. First, the decay time To of lasers’radiation in the cavity without the absorber is found. Then, thecavity is filled with investigated air sample and the respectivedecay time t is determined. The absorption coefficient is cal-culated using the formula ( Drying o f a i r s a mple m i ght be pe r formed wit h thi n Na f ionmembranes (Perma P u re L L C),however their influence on certain biomarker contains is a matter of investigation. ) where c denotes the light speed. Concentration of the absorberis found due to the relation: NA=a/o A, where o is the ab-sorption cross section. Several modifications of CRDS were developed. The bestresult might be achieved with continuous wave single modelasers while they can be precisely matched with the peaks ofnarrowband absorption lines. This technique, so called, CW--CRDS uses cw laser with beam externally AM modulatedwith frequency of tens of kilohertz [31,32]. Signal to noiseratio of the system might be increased many times when thecavity mode is precisely matched to laser frequency [33, 34].However such technique leads to system complexity. In thiscase the Q-factor is often determined due to analysis of a pha-se shift which occurs between input and output signals of thecavity. The phase shift Ap is caused by the radiation storage inthe cavity. Its relation to the photon lifetime in the resonator isexpressed by the formula: tg(Ap)=2nft, where fdenotes themodulation frequency. Then, the absorber concentration canbe determined using Eq. (1). Other solutions, like off-axis arrangement of the resonator,Integrated Cavity Output Spectroscopy (ICOS) or Cavity En-hanced Absorption Spectroscopy (CEAS) enable solving theproblems related to cavity and laser frequency matching [35,361. In multipass spectroscopy [MUPASS -Fig. 2(b)] the highsensitivity is achieved due to light path lengthening in theexperimental cell containing the investigated gas sample. Thecell is ended with two concave mirrors with broadband coat-ings. Laser beam is introduced through a small hole in onemirror and then multiplies reflects among the mirrors. Due tothat solution the light path might be lengthened tens or everhundreds times inside the sample in comparison with commonsingle-pass spectroscopy. Then, the beam leaves the cellthrough the same or the other hole in the mirror and reaches the photodetector. The absorption coefficient is found fromLambert -Beer absorption law. Simultaneously the technique, called wavelength modula-tion spectroscopy (WMS), is usually applied. The laser wave-length is periodically varied within the absorption line profile.Such wavelength modulation induces the amplitude modula-tion of the light beam passing through the cell with the ab-sorber. The relevant periodical changes occur in the pho-todetector output signal which is then demodulated witha lock-in amplifier. The signal amplitude is proportional to theabsorption coefficient. Wavelength modulation spectroscopyimproves the selectivity and enlarges the immunity of detec-tion process to noises and interferences. Using both MUPASSand WMS the absorption sensitivities of 10-7 cm- (and evenbetter) are available. 3.5.MNeasurements of selected biomarkersconcentrations 3.1. Nitric oxide (NO) Nitric oxide is a biomarker of diseases like asthma, hyperten-sion, rhinitis and various air way inflammations [37-43]. Itsconcentration in healthy people breath does not exceed thelevel of 50 ppb for adults and 35 ppb for children, according toAmerican Thoracic Society(ATS) and European RespiratorySociety (ERS) recommendation [44,45]. As it is shown inFig. 1, NO has a strong absorption band around wavelengthsof 5.26 um. Using this spectral range nitric oxide has beenalready detected with sensitivity up to the ppb levels. Thetechniques as MUPASS - WMS [46-48], ICOS [49,50], andCALOS [51] were demonstrated. Our experiment with nitric oxide detection in the N2 wasperformed using CEAS technique. The optical cavity wasbuilt of two concave dielectric mirrors with CEAS procedure. Fig. 3. Calibration of NO sensor. The detection limit of 5 ppb can be assumed. Therefore, thesensor might be used for monitoring of NO in the air aftera calibration and for the statement of dangerous cases inbreath. Further improvement of the sensor performances is pre-dicted. Higher power QCL with very narrow emission linewill be applied as the light source. Matching of its wavelengthto the absorption peak at 5.262961 um [Fig. 1(b)] and reduc-ing the air pressure (to about 0.1 atm) would significantlyimprove the detection limit. 3.2. Carbonyl Sulfide (OCS) Carbonyl sulfide occurs in breath of healthy individuals withconcentration values from 3 ppt to 30 ppb. For an unhealthyman, however, these values might reach the level about tens oreven hundreds times higher [52]. This compound is known asa biomarker for cystic fibrosis, liver failure and acute rejectionof transplanted lungs [53,54].OCS molecule has absorptionpeaks within the spectral range of 3.3-5.5 um. The detectionlimits of 0.5 ppb in breath [55] and 7 ppt in ambient air [56]wwere already published. In Fig. 4 the spectrum of OCS together with spectra of themain interferents contained in human breath are presentednear the wavelength of 4.875 um. At the concentration of30 ppb the absorption coefficient of carbonyl sulfide domi-nates here over the interferents’spectra. As one can see, usingthe laser tuned to the peak of OCS line, the precision of themeasurement better than 15 ppb can be obtained. Further anal-ysis of HITRAN database [22] shows, that10-times reductionof sample pressure would provide the detection limit of0.5 ppb due to the narrowing of spectral lines. In this case thewavelength shift of the absorption line also takes place and theprecise laser tuning to the wavelength to 4.877716 um shouldbe applied. Fig. 4. Absorption spectrum ofOCS near 4.875 um together with spec-tra of main interferents in breath. Fig. 5.Results of measurement ofOCS concentration in reference gas Our approach to OCS detection in the N2 was performedusing the similar experimental setup as the described in previ-ous chapter. Optical cavity equipped with mirrors of ~0.9998reflectivity (CRD Optics Inc., Mountain View, CA, USA) andthe pulsed parametric oscillator PG711-DFG-SH from theEkspla Company (Vilnius, Lithuania) was used. The experi-ment was performed in pure air. The results are presented inFig. 5. Nice linearity between the assumed concentration andthe absorption coefficient was received. The detection limitmight be evaluated as better than 1 ppb,however the measuree-ment range was limited by the precision of the gas generator. The spectrum analysis and the experiment have shown thateven using a relatively simple system the sensitivity sufficientfor the statement of dangerous concentration (> 30 ppb) inhuman breath can be achieved. More advanced setup withreduced pressure and with single mode QC lasers tuned to thepeak of the absorption line would provide the opportunity tomonitor OCS in breath with the detection limit better than1ppb. 3.3. Ethane (C,H) Ethane is an inflammatory marker in the exhaled air. It mightbe also used as an indicator of vitamin E deficiency, as well asfor identification of chronic respiratory diseases [57], cellsoxidative stress [58] or an indication of scleroderma and cys-tic fibrosis [59-62]. Its concentration in a normal human bre-ath is about 0.12 ppb, while in unhealthy case it reaches therange of 3.5 ppb [63]. The detection limit of 100 ppt wasreported at the spectral range of 2.6-4.0 um [63-65]. . Absorption spectrum of ethane is presented in Fig. 6, to-gether with spectra of the main interferents in breath. The pre-sented ethane line corresponds to maximal absorption in thewavelength range of 3-4 um. Water vapour and CO are themost interfering compounds. 10-3 1 atm Fig. 6. Absorption spectra of ethane and main interferents for the pres-sure of 1 atm (a) and 0.1 atm (b). Both preclude observation of C2H6 at atmospheric pres-sure [Fig. 6(a)]. The peak of ethane absorption coefficient(a=3.34816 um) is dominated by these interferents. More-over, the measurement may be also disturbed by formalde-hyde which might occur in breath of healthy men with theconcentration even of 0.6 ppm. Successful measurement of ethane concentration in humanbreath requires reduction of sample pressure [0.1 atm,Fig. 6(b)]. In this case a significant separation of absorptionlines takes place due to reduction of their collisional broaden-ing. Absorption coefficient of C2H6 dominates even in the in-terferents presence. Preliminary drying of the sample withNafion membranes, which reduce water vapor amount about30 times, further minimizes H O interference. Due to that theobservation of the ethane concentration of 3.5 ppb is possibleusing the laser tuned to 3.348151 um. The detection limit ofhundreds of ppt is available, even in the case of relatively highformaldehyde concentration. Fig. 7. Results of measurement of ethane concentration in referencegas. Ethane is characterized by a relatively low absorption co-efficient. Therefore, for its detection the most sensitive me-thod- CEAS-must be used. The test of our measuring systemwas performed using the reference gas samples prepared with491M type KIN-TEK gas generator. CRDS setup with theoptical cavity described earlier was applied. PuIsed parametricgenerator PG711-DFG-SH tuned to 3,348 um was used asa light source. The test results are presented in Fig. 7. Simii-larly as in previous case, a good linearity between assumedconcentration values and data obtained using CEAS wasachieved. 3.4. Ammonia (NH) Normal concentration of ammonia in human breath is in therange of 0.25-2.9 ppm [66]. However, the excessive concen-tration might suggest renal failure, Helicobacter Pyroli andoral cavity disease [67-68]. The highest sensitivities of am-monia detection using LAS setup can be achieved in10-11 um range, because of the largest values of the absorp-tion cross section. The detection limits reaching the values oftens and single ppb’s were already achieved by several groups[69,70], with MUPASS - WMS. In this spectral range theammonia spectra are interfered by Co, and H,O and sampledrying and pressure reduction are necessary. The experiment with ammonia was performed using PASsetup at the Rice University Laser Science Group Laboratorywith contribution of one of the authors (J.W.) of this paper [71].The measurement was carried out with EC-QCL laser system(Daylight Solution) tuned to 10.3587 um absorption line.Wavelength modulation and 2f detection was used. The setupprovided detection limit of ~3 ppb at a pressure of 600 Torr. In Fig. 8 the shape of ammonia line registered using thisPAS system is presented. Lower gas pressure ensured nar- Fig. 8. Example of normalized PAS signals for 1 ppm NH3 at differentpressures. rower gas absorption lines, but also lower PAS signal. It wasbecause the energy transfer from excited molecules by meansof a non-radiative processes is more efficient at higher pres-sures and leads to a stronger acoustic wave. Detection of biomarkers at the shorter wavelengths is morecomfortable because of a large variety of available lasersources, optical elements, and photodetectors. The measure-ments of ammonia around 1.51 um, were demonstrated usingCEAS technique [72]. The detection limit of 18 ppb in a refer-ence gas was obtained. We found, that suitable wavelengths for ammonia detec-tion are also the lines at 1.5270005 um and 1.5270409 um.The NH absorption coefficient (at 2 ppm)reaches here about3.5x10-5cm-and the experimental techniques like MUPASS-WMS can be effectively used. In this range water vapour andcarbon dioxide interferences are about 50 times weaker; there-fore, the detection limit of hundreds of ppb is available. Sam-ple drying or pressure reduction are not necessary to use, thenthe sensor construction and maintaining is cheaper and sim-pler than in mid-infrared (MIR) range. Our ammonia sensor worked at the lines presented inFig. 9. The detection was performed with MUPASS - WMSsystem described in Chapter 2 [Fig. 2(b)]. Single mode diodelaser (Toptica, model DL100, 20 mW) was used as a lightsource. The laser wavelength was modulated at a right wing ofNH line within the wavelengths of 1.5270-1.5271 um anda frequency of about 1 kHz. Precise AGF3102 digital genera-tor (Tektronix) was used for this purpose in order to achievegood repeatability of the data. Laser beam intensities weremeasured at both input and output of the multipass systemwith PDA10DT photodetectors (InGaAs-Thorlabs) and col-lected with SRS 830 lock-in voltmeters. The data were ave-raged over 1 min. Fig. 9. Absorption spectra of ammonia, H2O and CO2 around1.527 um. Mixtures of ammonia in air were prepared with the systembuild of flow mass controllers (BetaErg). The system was sup-plied from a bottle of water free ammonia of the highest purityand from a bottle with filtered air. Concentrations of the mix-tures were calculated using flow controllers settings, becauseany independent system of the mixtures characterization wasnot available. In order to achieve NH concentration of severalppm and lower two step dilution of pure ammonia was neces-sary. The measurement was performed at the atmosphericpressure. In order to avoid the measurement disturbing byNH molecules adsorbed on the walls (and then desorbed), thesensor was kept at the temperature of 50°C. The results are presented in Fig. 10. The sensor providesproper results for NH concentrations up to about 1 ppm. Forlower values the deviation from linear characteristics is ob- Fig.10. Results of ammonia measurement with MUPASS -WMSsystem. served. This is probably a result of poor regulation of refer-ence concentration inside the sensor due to (mentioned above)NH deposit on the walls of the system. That causes a system-atic error of the measured data. Nevertheless, our multipasssensor is suitable for rough monitoring of this compound inthe exhaled air and for detection of morbid states (>2.9 ppm). 3.5. Carbon monoxide (CO) Carbon monoxide is a biomarker of hyperbilirubina, oxidativestress, respiratory infections, and asthma [73-77]. It is alsoused to monitor bilirubin production in smoking cessation andaccess the lung diffusion capacity. Its concentration in healthyman breath should not exceed the value of 10 ppm, neverthe-less in some cases (for smokers) it can reach 20 ppm [78]. Thebest detection limits of CO in human breath (reaching hun-dreds and tens of ppb) were demonstrated in the spectral rangeof 4.6-5 um using MUPASS-WMS approach [79]. Although the MIR spectroscopic systems of CO detectionare characterized by the best detection limit, these solutionsrequire the use of quantum cascade lasers, specialized pho-todetectors and optical materials. Looking for cheap solutions,suitable for screening investigation, it is reasonable to con-struct the sensors working in near-infrared (NIR) range. Onecan expect lower sensitivity but still enough for effectivemonitoring of CO in human breath, where the morbid levelreaches 10 ppm. A profit consists in easily available and rela-tively cheap diode lasers, photodetectors (photodiodes, muchmore sensitive than for MIR spectral range) and standardoptics. The measurement with the sensitivity of 900 ppb at thewavelength of 1.564 um was already reported [80]. The analysis of HITRAN database [22] shows however,that CO absorption lines in 1.56-1.57 um range are weak andstrongly affected by H20 and CO2. More efficient detectioncan be performed in the spectral range of 2.33 um (Fig. 11). Fig. 11. Absorption spectrum of carbon oxide around 2.3337 um. The absorption line of 2.33372 um is the best candidate: itsabsorption coefficient at 10 ppm reaches the value of 4.4x10⁻⁶cm-, i.e., about 50 times higher than at 1.56 um. High valueof the absorption provides opportunity using MUPASS -WMS system.The interference by water vapour is about 200times weaker and for CO this effect is negligible. The detec-tion limit might be reduced only in the case of methane pres-ence in the sample, but even at morbid level of CH4 (10 ppm)its interference is about 30 times weaker than the absorptionof CO. Figure 12 presents the results of our CO sensor investiga-tion. The mixtures were prepared with the system constructedof flow mass controllers that was described in previous chap-ter. Good linear correlation between data supplied by the gasmixing system and the sensor was observed within the con-centration range of 0.4-100 ppm4. That is sufficient for COmonitoring in human breath for both morbid case and healthyman case. 3.6. Methane (CH) Mean methane concentration in ambient air is about 1.7 ppm.Its concentration in exhaled air is about 3-8 ppm, but theupper limit for healthy man can reach 10 ppm. The excess ofCHconcentration has been identified as a biomarker of co-lonic fermentation and intestinal problems [81]. Methane can be observed in NIR and MIR spectral ranges.Sensitive detection was already performed near wavelengthsof 7.8 um and the range of 3.3-3,5 um with WMS and singlepass spectrophotometry [80]. The detection limit of 0.5 ppmwas achieved. It is sufficient to monitor CH4 in human breath.In near infrared (1.63 um) the obtained limit was 6 ppm using0.3 mW laser and photoacoustic system [82]. We found that the range of 2.25 um is much more profit-able than the 1.63 um one (Fig.13). Although the absorptioncoefficient of methane for both cases is similar (~1.2×10-cm-1 at the concentration of 10 ppm), the region of shorterwavelengths is strongly affected by carbon dioxide band (0≈0.9×10⁻⁶cm-l)[22]. Such interference is much weaker for the line of2.25366 um, since the absorption coefficients by CO andHO are more than three orders of magnitude lower. Ammo-nia, which could occur in breath, might reduce the detectionlimit of methane to parts of ppm. Our observation of CO in inair was performed in the MUPASS - WMS system describedabove. As a light source, cw single mode DFB-diode laser was ( “A gap that occurs i n F i g. 12 b e tween tw o ser i es of the experi- mental points (i.e., for the concentrations ≤4 ppm and the concentra- tions ≥ 6 ppm) follows from a systematic error b y gas supplyingsystem. Large c o ncentrations are produced due to a single step dilu- tion o f C O in carrier gas (a i r it h i s c a se), w h ile fo r sm a ll concentra-tions the two-step dilution was required. ) Fig. 12. Results of CO sensor test. used. Triangle shaped modulation of diode current enabledperiodic scanning of laser wavelength over CH4 absorptionline. The observation was performed for two cases: with thescanning from the line peak to its right wing, (i.e., within therange of 2.25366-2.2537 um) or with modulation across theline (i.e., the wavelengths from 2.2536 to 2.2537 um). Theregistration was made at the first or the second harmonic,respectively. Laser tuning signal was produced by digital ge-nerator (Tektronix). Mixtures of the gases were prepared with the system buildof f1low mass controllers which was described above. Themeasurements were performed at the atmospheric pressure. Inorder to check the sensor capabilities below the level limitedby amount of methane in atmosphere, CH the mixtures wereprepared with spectrally pure argon as carrier gas. Investigation results of the multipass methane sensor arepresented in Fig. 14. Good linear characteristics was observed Fig. 13. Absorption spectrum of methane around 2.25366 um. Fig. 14. Results of methane sensor test. for both low and high concentrations. The precision of mea-surement was better than 0.1 ppm. As it was mentioned above,the concentration of methane in breath of a healthy manshould not exceed 10 ppm. Therefore, such simple optical sys-tem fulfils well the requirement of precise sensor for monitor-ing of CH4 in the exhaled air. 3.7. Acetone (CO(CH,)2) Acetone can occur in the exhaled air of healthy man witha concentration of 0.39 to 0.85 ppm [66, 83-85]. The concen-tration exceeding the value of 1.4 ppm might suggest diabetes,but it also occurs in breath of children who are on a high-fatdiet for the treatment of epilepsy [86]. This compound canalso serve as an indicator of congestive heart failure and car-diac index [87,88]. Acetone may be detected using 0.266 um radiation(Fig. 15) [89], however the observations at NIR spectral re-gion were reported, as well. CRDS is the best technique forthis purpose due to a weak absorption coefficient (about1.7×10-6 cm-l) in the UV spectral range at the limit of a mor-bid level. Such system was already demonstrated by Wang etal. [89-91]. Spectral fingerprints of acetone in the deep UVdown to 115 nm were also reported [92]. Acetone may be detected using 0.266 um radiation(Fig. 15) [89], however the observations at NIR spectralregion was reported, as well. CRDS is the best technique forthis purpose due to a weak absorption coefficient (about1.7×10-6cm-) in the UV spectral range at the limit of morbidlevel. Such system was already demonstrated by Wang et al.[89-91]. Spectral fingerprints of acetone in the deep UV downto 115 nm were also reported [92]. Fig. 15.UV extinction spectra of acetone,CO2 and Rayleigh scatteringin air. The wavelength of 0.266 um seems to be very suitable foracetone detection. Relatively cheap, pulsed or cw diode pum-ped solid state lasers (IV harmonic of YAG) are commerciallyavailable for this wavelength. No precise tuning to the broadabsorption spectrum of acetone is necessary. Light detectionmight be performed with low noise solar blind photomulti-pliers. Neither water vapour nor carbon monoxide affect theCO(CH3)2 spectrum (Fig. 15). That simplifies sensor con-struction and makes it relatively cheap. However, despite ofthese advantages, the achievement of low detection limit findsthe obstacles here.Rayleigh scattering in air is the main inter-fering phenomenon. The scattering at 0.266 um dominates theabsorption coefficient of acetone while it reaches the value of2×10-6 cm-[93]. As far as both CRDS and multipass spec-troscopy provide the extinction coefficient of the sample, theradiation seattering cannot be distinguished from the absor-ption using these methods. The achievement of a low detection limit using CRDS isalso problematic at 0.266 um. Reflection coefficient of themirrors that are commonly available on the market does notexceed the value of R=0.993. Then, the photon lifetime ina typical cavity of L= 0.5 m length: t= L/c(1-R)= 0.33 us.In such circumstances after the analysis of Eq. (1) one achie-ves the sensitivity limit of about 10-6 cm-l only, assuming 1%- precision of photon lifetime determination. These problems were the main reason of poor resultsachieved with our CRDS sensor for acetone detection(Fig. 16). The measurement was done with a pulsed Nd:YAGlaser generating at the fourth harmonics. The parameters ofthe cavity corresponded to the ones considered in the aboveparagraph. The gas mixing system with flow controllers, thatwas described above, was used again to prepare air - acetonemixture. In this case the system was supplied from a 5 1 cham-ber containing saturated vapour of this compound in air. The Fig. 16. Results of acetone concentration measurement with CRDSsystem at 0.266 um. vapour was generated with liquid acetone evaporated at roomtemperature [94]. Unprecise work of the gas mixing system(20%) increased the experimental error in this case. The obstacles presented above, especially Rayleigh scat-tering, do not provide to imagine that such system of acetonedetection in breath could be significantly improved. A reduc-tion of the air pressure in the sample does not lead to workaround this problem. In opposite to IR spectra, the absorptionband in UV occurs due to the transition to a higher electronicstate. This band consists of a large number of overlappinglines. Therefore, the reduction of the sample pressure wouldlead to a diminution of both, Rayleigh scattering efficiencyand acetone absorption coefficient. Quartz enhanced photoacoustic spectroscopy seems to bethe most promising system for acetone detection at 0.266 um.The photoacoustic sensors, which principle of operation con-sists in converting the light energy to the acoustic signal, aresensitive for absorbed radiation only; therefore the problem ofRayleigh scattering would be automatically eliminated. Goodimmunity for the external acoustic noises of quartz enhancedapproach, its capability to analyse small gas samples, down to3 mm’in volume, would guarantee a high detection limit[27,95]. 4. CConclusions Our investigation of optoelectronic laboratory setups for de-tection of biomarkers in human breath shows that there is anopportunity to build relatively cheap, table-top systems des-ignated for monitoring of selected compounds using laserspectroscopy techniques. CEAS and MULTIPASS -WMStechniques are especially suitable for such constructions.The compounds that occur in the exhaled air at relatively high concentrations (ppm) resulting in relatively high ab-sorption coefficients (~10-6 cm-l) are mainly predestinatedfor such detection. For the sensors of such biomarkers a sim-ple multipass cell of effective light path length of tens ofmeters is sufficient. Acknowledgements This work was supported by the National Science Centrefunds due to DEC-2011/03/B/ST7/02544 decision. References 1. A. Ulanowska, T. Ligor, M. Michel, and B. Buszewski,“Hy-phenated and unconventional methods for searching volatilecancer biomarkers”, Ecol. Chem.Eng. 17(1),9-23(2010). 2. T. Ligor, Analityka wydychanego powietrza z zastosowaniemsprzeionych technik chromatograficznych zprzeznaczeniem dobadan przesiewowych chorob ptuc, Wydawnictwo NaukoweUniwersytetu Mikolaja Kopernika, Torun, 2011. (IN POLISH) 3. T. Ligor,“Analytical methods for breath investigation” Crit.Rev. Anal. Chem. 39, 2-12(2009) 4. B. Buszewski,M. Kesy, T. Ligor, and A. Amann,“Human ex-haled air analytics: biomarkers of diseases”, Biomed. Chro-matogr. 21, 553-566 (2007). 5. W. Mueller, J. Schubert, A. Benzing,and K. Geiger, “Methodfor analysis of exhaled air by microwave energy desorptioncoupled with gas chromatography-flame ionization detection--mass spectrometry”,J. Chromatogr. B 716,27-38(1998). 6. P.J. Mazzone,“Exhaled breath volatile organic compound bio-markers in lung cancer”, J. Breath Res. 6, 027106(2012). 7.A. Ulanowska, E. Trawinska, P. Sawrycki, and B. Buszewski,“Chemotherapy control by breath profile with application ofSPME-GC/MS method”,J. Sep. Sci. 35, 2908-2913 (2012). 8. A.W.Boots,J.J.B.N. Van Berkel, J.W. Dallinga, A. Smolinska,E.F. Wouters, and F.J.Van Schoten,“The versatile use of ex-haled volatile organic compounds in human health and dis-ease", J. Breath Res. 6, 027108(2012). 9. W. Miekisch, J.Herbig, and J.K. Schubert,“Data interpretationin breath biomarker research: pitfalls and directions”,J. BreathRes. 6, 1-10 (2012). 10. I.B. Silva, A.C. Freitas, T.A.P. Rocha-Santos, M.E. Pereira,and A.C. Duarte, “Breath analysis by optical fiber sensor forthe determination of exhaled organic compounds with a view todiagnostics”, Talanta 83, 1586-1594 (2011). 11. F.S.Cikach Jr. and R.A. Dweik,“Cardiovascular biomarkers inexhaled breath”, Prog. Cardiovasc.Dis. 55, 34-43 (2012). 12. S. Kumar, J. Huang, J.R. Cushnir, P. Spanel, D. Smith, andG.B. Hanna,“Selected ion flow tubems analysis of headspacevapour from gastric content for the diagnosis ofgastro-esopha-geal cancer”,Anal. Chem. 84, 9550-9557 (2012). 13. D. Smith and P. Spanel,“The challenge of breath analysis forclinical diagnosis and therapeutic monitoring”, Analyst 132(5),390-396 (2007). 14. P.R. Boshier, J.R. Cushnir, and V. Mistry,“Online, real timemonitoring of exhaled trace gases by SIFT-MS in the perio- perative setting: a feasibility study”, Analyst 136, 3233-3237(2011). 15. W. Tianshu, P. Andriy, D. Kseniya, S. Patrik, and S. David,“Analysis of breath, exhaled via the mouth and nose, and the airin the oral cavity”, J. Breath Res. 2, 037013 (2008). ( 16. P. Cap, K. Dryahina, F. Pehal, and P. Spanel, “Selected ion flow tube mass s pectrometry o f exhaled breath condensateheadspace” , Rapid Commun. Mass S p ectrom. 22, 2844-2850(2008). ) 17. T.H. Risby and S.F. Solga, “Current status of clinical breathanalysis”, Appl. Phys. B 85, 421-426 (2006). 18. S. Kumar, J. Huang, J.R. Cushnir, P. Spanel, D. Smith, andG.B. Hanna,“Selected ion flow tube-ms analysis of headspacevaper from gastric content for the diagnosis of gastro-esopha-geal cancer". Anal Chem. 84,9550-7(2012). 19. F.Di Francesco, R. Fuoco, M.G.Trivella, and A. Ceccarini,“Breath analysis: trends in techniques and clinical applica-tions”,Microchem.J. 79, 405-410 (2005). ( 20. R.F. Machado, D. Laskowski, O . Deffenderfer, T . Burch, S . Zheng, P . J. M azzone, T. Me k hail,C. Jenn i ngs, J.K. Stol l er, J.Pyle,J. Duncan,R.A. Dweik, and S.C. Erzurum,“Detection of lung cancer b y s e nsor array analyses of exhaled bre a th" Am. J. Respir. Crit . Care Med. 171, 1286-1291 ( 2005). ) ( 21. B. Buszewski, D . G r zywinski,T. Lig o r, T. S tacewicz, z. Bie-lecki, and J. Wojtas,“Detection of volatile organic compoundsas biomarkers i n breath analysis by different a nalytical tech- niques”, Bioanalysis 5, 2287-2306(2013). ) ( 22. L.S. Rothman, I .E. Gordon, Y. Babikov, A. Barbe, D.C. Ben-ner, P.F. Bernath, M. Birk, L. Bizzocchi, V. Boudon, L.R. Brown, A. Campargue,K. Chance, E.A. Cohen, L.H. Coudert,V.M. Devi, B.J. D rouin, A . F ayt, J .M. F laud, R .R. G amache, J.J. Harrison, J.M. Hartmann, C. H i ll, J .T. H odges, D . Jac- quemart, A . J olly, J. Lamouroux, R .J. L eRoy, G . L i , D . A.Long, O. Lyulin, C.Mackie, S.T. Massie, S. Mikhailenko, H.S.Muller, O. Naumenko, A. Nikitin,J. Orphal, V . I. P erevalov, A. Perrin, E.R. Polovtseva, C. Richard, M.A.H. Smith, E . S t ari- kova, K. S ung, S . T ashkun, J. Tennyson, G.C. T o on, V 1 .G.Tyuterev , an d G . Wagner , “The HITRAN 2012 molecularspectroscopic database” , J. Quant Spectr. Radiation Transfer 130,4-50(2013). ) 23. https://www.google.pl/search?q=nafion+humidifier&ie=utf-8.&oe=utf-8&gws_rd=cr&ei=QrR_Vr-GCsXVyAOgso7wDQ. 24. G. Peach,“Theory of the pressure broadening and shift of spec-tral lines”, Adv. in Phys. 30 (3): 367-474 (1981). 25.J. Wojtas, Z. Bielecki, T. Stacewicz, J. Mikolajczyk, and M.Nowakowski,“Ultrasensitive laser spectroscopy for breath ana-lysis”, Opt. Electron. Rev. 20, 77-90 (2012). 26. T.Stacewicz, J. Wojtas,Z. Bielecki, M. Nowakowski, J. Miko-lajczyk,R. Medrzycki, and B. Rutecka,“Cavity ring downspectroscopy: Detection of trace amounts of matter”, Opt. Elec-tron. Rev.20, 34-41(2012). ( 27. P. P atimisco, G. S camarcio, F . K. T i ttel, a nd V . Spagnolo, “Quartz-Enhanced Photoacoustic S pectroscopy: a R eview”, Sensors 14, 6165-6206 (2014). ) ( 28. A.O’ K eefe and D . A.G. Deacon,“Ca v ity ring-down opti c al spectrometer f or absorption measurements using pulsed l a sersources”, Rev. Sci. Instrum. 59,2544-2551( 1 988). ) ( 29. K .W. Busch a n d M.A. Bu s ch, Cavity-ringdown Spe c troscopy,an Ultratrace-Absorption Measurement Technique, ACS Sym-posium series, American Chemical Society, Washington DC, 1999. ) 30. G. Berden and R. Engeln, Cavity Ring-Down Spectroscopy:Techniques and Applications,Edition, Wiley-Blackwell,2009 31. D. Romanini, A.A. Kachanov, N. Sadeghi, and F. Stoeckel,“CW-cavity ring down spectroscopy”, Chem. Phys. Lett. 264,316-322(1997). 32. J. Ye, L.S. Ma, and J.L. Hall, “Ultrastable optical frequencyreference at 064 um using a C2HD molecular overtone transi-tion”, IEEE T. Instrumentation and Measurement 46, 178-182(1997). ( 33. A . Cygan,D. Lisak, P. Maslowski, K. Bie l ska, S. Wojtewicz, J.Domystawska, R . T r awinski, R . Ciurylo, H . Abe, an d J. T .Hodges,“ P ound-Drever-Hall-locked, frequency-stabilized ca- vity ring-down spectrometer”, Rev. Sci. Instrum.82,063107-1- 063107-12(2011). ) ( 34. A. C ygan, S. Wojtewicz, J. Domystawska, P. Maslowski, K.Bielska, M. Piwinski, K. Stec, R. Trawinski, F. Ozimek, C. Radzewicz, H. Abe, T. Ido, J . T. Hodges, D . L isak, R. and Ciurylo, “ S pectral l i ne-shapes i n vestigation with P o und-Dre-ver-Hall-locked f requency-stabilized cavity r i ng-down sp e c-troscopy”, Eur. P hys. J. Spec. T op. 2 22, 211 9 -2142 (2013). ) ( 35. R. Engeln, G . B erden, R . Peeters, and G. M eier, “ Cavity en- hanced absorption and cavity enhanced m a gnetic rotation s p ec- troscopy", Rev. Sci. Instrum. 69,3763-3769 (1998). ) ( 36. J.D.Ayers, R.L. Apodaca, W.R. Simpson, and D.S. Baer, “ Off--axis cavity ringdown spectroscopy: application to atmospheric nitrate radical detection”, Appl. Opt. 44, 7239-7242 (2005). ) ( 3 7. S .A. Kharitonov and P. J . Barnes,“Nitric oxide, ni t rotyrosine, a nd nitric oxide modulators in asthma and chronic obstructive p ulmonary d i sease”, C urr. A llergy Asthma Rep. 3, 1 2 1-129 ( 2003). ) ( 38. S.A. K haritonov, A.U.Wells, B.J. O ' Connor, P.J. Cole, D.M. Hansell,R.B. Logan-Sinclair, and P.J. Barnes,“Elevated levelsof e xhaled nitric oxide i n bronchiectasis", Am. J. Re s pir. Crit. Care Med.1 5 1, 1889-1893 (1995). ) ( 39. J. Schilling, P . Holzer, M.Guggenbach, D . G yurech, K. Ma- rathia, and S. Geroulanos,“Reduced endogenous nitr i c oxide inthe exhaled air o f smokers a n d hypertensives”,Eur . Res p ir. J. 7, 467-471(1994). ) 40. U. Martin, K. Bryden, M. Devoy, and P. Howarth, “Increasedlevels ofexhaled nitric oxide during nasal and oral breathing insubjects with seasonal rhinitis” J. Allergy Clin. Immunol 97,768-772(1996). ( 41. S .A. Kharitonov and P.J. Barnes,“N i tric oxide in exhaled air is a new marker of a irway inflammation”,Monaldi. Ar c h. Ch e stDis. 51, 533-537 ( 1 996). ) ( 42. K .McCluskie, M.A. Bir r ell, S. Wong, and M.G. Belv i si, “Ni-tric oxide as a noninvasive biomarker of lipopolysaccharide-in-duced airway i n flammation: possible role in lung neutrophilia",J. Pharmacol. Exp. T her. 311, 625-633 ( 2004). ) ( 43. M.A. Birrell, K. McCluskie, E . H ardaker, R. Knowles, and M .G. B e lvisi,“Utility of exhaled nitric oxide as a noninvasivebiomarker of lung inflammation i n a d i sease m o del". Eur.Respir. J. 28, 1236-1244 (2006). ) 44. http://www.thoracic.org/about/overview.php 45. http://www.ersnet.org/images/stories/pdf/ERS_Annual_re-port_1314.pdf 46. C. Roller, K. Namjou, J.D. Jeffers, M. Camp, A. Mock, P.J.McCann, and J. Grego, “Nitric oxide breath testing by tun-able-diode laser absorption spectroscopy: application in moni-toring respiratory inflammation”, Appl. Opt. 41, 6018-6029(2002). 47. K. Namjou, C.B. Roller, and G. McMillen,“Breath analysis us-ing mid infrared tunable laser spectroscopy”, Proc. of the 6thAnnual IEEE Conf. on Sensors, Atlanta, GA, USA, pp.1337-1340,2007. 48. Y.A. Bakhirkin, A.A. Kosterev, C. Roller, R.F. Curl, and F.KTittel,.“Mid-infrared quantum cascade laser based off-axis in-tegrated cavity output spectroscopy for biogenic nitric oxidedetection”, Appl.Opt. 43,2257-2266(2004). 49. M.R. McCurdy, Y. Bakhirkin, G. Wysocki, and F.K. Tittel,“Performance of an exhaled nitric oxide and carbon dioxidesensor using quantum cascade laser-based integrated cavityoutput spectroscopy",J. Biomed.Opt. 12,034034:1-034034:9(2007). 50. A.A. Kosterev, A.L. Malinovsky, F.K. Tittel, C. Gmachl, F.Capasso, D.L. Sivco, J.N. Baillargeon, A.L. Hutchinson, andA.Y. Cho, “Cavity ringdown spectroscopic detection of nitricoxide with a continuous-wave quantum-cascade laser, Appl.Opt. 40, 5522-5529(2001). 51. K. Heinrich, T. Fritsch, P. Hering, and M. Murtz,“Infrared la-ser-spectroscopic analysis of 14NO and 15NO in humanbreath".Appl. Phys. B: Lasers Opt. 95,281-286(2009). 52. L. Ciaffoni, R. P. a. G. A. D. R. (2011). “Laser spectroscopyonvolatile sulfur compounds: possibilites for breath analysis”, J.Breath Research 5, 024002 (2011). 53. G. Neri, A. Bonavita, S. Ipsale, G. Micali,G. Rizzo, and N.Donato,“Carbonyl Sulphide (COS) monitoring on MOS sen-sors for biomedical applications”. ISIE 2007, pp. 2776-2781(2007). ( 54. L. Bennett, L. Ciaffoni, W. Denzer, G. Hancock, A.D. Lunn, R. Peverall, S . Praun, and G.A.D . Ritchie,“A chemometric studyon h uman b r eath m a ss spectra f o r biomarker i d entification incystic f ibrosis”, J. Breath Res. 3, 1-7 (2009). ) 55. D. Halmer, G. von Basum, P. Hering,and M. Murtz,"Mid-in-frared cavity leak-out spectroscopy for ultrasensitive detectionof carbonyl sulfide”,Opt. Lett. 30, 2314-2316 (2005). 56. C. Fischer and M.W. Sigrist,“Trace gas sensing in the 3.3 umregion using a diode based difference frequency laser pho-toacoustic system", Appl. Phys. B: Lasers Opt. 75, 305-310(2002). 57. S.R. Svedahl, K. Svendsen, E. Tufvesson, P.R. Romundstad,A.K Sjaastad, T. Qvenild, and B. Hilt,“Inflammatory markersin blood and exhaled air after short-term exposure to cookingfumes”, The Annals of Occupational Hygiene 57, 230-239(2012). ( 58. R. Matthew Y.B. McCurdy,G. Wysocki, R. Lew i cki, a nd F.K . Tittle. “Recent advances of l a ser-spectroscopy-based techni-ques f or applications in breath a n alysis”, J. B reath R e s. 1, 014001(2007). ) 59. M. Refat, T.J. Moore, M. Kazui,T.H. Risby, J.A. Perman, andK.B. Schwarz,“Utility of breath ethane as a noninvasive bio-marker of vitamin E status in children”, Pediatr. Res. 30,396-403(1991). 60. C.A. Riely, G. Cohen, and M. Lieberman,“Ethane evolution:a new index of lipid peroxidation”, Science 183, 208-210(1974). 61. G.D. Lawrence and G. Cohen,“Ethane exhalation as an indexof in vivo lipid peroxidation: concentrating ethane froma breath collection chamber”, Anal. Biochem. 122, 283-290(1982). 62. P. Paredi, S.A. Kharitonov, and P.J. Barnes,“Elevation of ex-haled ethane concentration in asthma”, Am. J. Respir. Crit.Care Med. 162,1450-1454(2000). 63. C.S. Patterson, L.C. McMillan,K. Stevenson, K. Radhakri-shnan,P.G. Shiels, M.J. Padgett, and K.D. Skeldon,“Dynamicstudy of oxidative stress in renal dialysis patients based onbreath ethane measured by optical spectroscopy”, J. BreathRes. 1(2),026005:1-026005:8(2007). 64. C. Wang, P. Sahay,“Breath analysis using laser spectroscopictechniques: breath biomarkers, spectral fingerprints, and detec-tion limits”, Sensors 9,8230-8262(2009). 65. D. Halmer, S. Thelen, P. Hering, and M. Mirtz, “Online moni-toring of ethane traces in exhaled breath with a difference fre-quency generation spectrometer", Appl. Phys. B: Lasers Opt.85,437-443(2006). 66. C.J. Wang, S.T. Scherrer, and D. Hossain, “Measurements ofcavity ringdown spectroscopy of acetone in the ultraviolet andnearinfraredspectralregions: Potential for developmentt ofa breath analyzer”, Appl. Spectroscopy58, 784-791 (2004). 67. D.J. Kearney, T. Hubbard, and D. Putnam,“Breath ammoniameasurement in Helicobacter pylori infection”, Dig. Dis. Sci.47,2523-2530(2002). 68. D. Smith, T. Wang, A. Pysanenko, and P. Spanel, “A selectedion flow tube mass spectrometry study of ammonia in mouth-and nose-exhaled breath and in the oral cavity”, Rapid Com-mun. Mass Spectrom. 22,783-789 (2008). 69. J. Manne, O. Sukhorukov, W. Jager, and J. Tulip, “Pulsedquantum cascade laser-based cavity ring-down spectroscopyfor ammonia detection in breath”, Appl. Opt. 45, 9230-9237(2006). 70. J. Manne, W. Jager, and J. Tulip,“Sensitive detection of am-monia and ethylene with a pulsed quantum cascade laser usingintra and interpulse spectroscopic techniques”, Appl. Phys. B:Lasers Opt. 94, 337-344 (2009). 71. J. Wojtas, F.K. Tittel, T. Stacewicz, Z. Bielecki, R. Lewicki, J.Mikolajczyk, M. Nowakowski, D. Szabra, P. Stefanski, and J.Tarka, “Cavity enhanced absorption spectroscopy and photo-acoustic spectroscopy for human breath analysis”, Int. J. Ther-mophysics 35, 2215-2225 (2014). 72. M.J. Thorpe, D. Balslev-Clausen, M.S. Kirchner, and J. Ye,“Cavity-enhanced optical frequency comb spectroscopy: appli-cation to human breath analysis”, Opt. Express 16, 2387-2397(2008). 73. H.J. Vreman, J.J. Mahoney, and D.K. Stevenson,“Carbon mo-noxide and carboxyhemoglobin”, Adv. Pediatr. 42, 330-334(1995). 74. D.K.Stevenson and H.J. Vreman,“Carbon monoxide and bili-rubin production in neonates”, Pediatr. Rev. 100, 252-259(1997). ( 75. L.A. A pplegate, P . L uscher, a nd R.M. T y rrell,“ I nduction o f heme o x ygenase: a g e n eral re s ponse to oxidant str e ss in cu l - tured mammalian cells”, Cancer Res. 51,974-978 (1991). ) ( 76. M. Y a m aya, K. S e kizawa, S. I s hizuka, M. M o nma, K. Mizuta,and H . S asaki,“I ncreased c arbon m on oxide i n ex ha led air of su bjects with upper respiratory tract infections” Am . J. Respir.Crit. Care Med.158,311-314(1998). ) 77. K. Zayasu, K. Sekizawa, S. Okinaga, M. Yamaya, T. Ohrui,and H. Sasaki, “Increased carbon monoxide in exhaled air ofasthmatic patients”, Am. J. Respir. Crit. Care Med. 156,1140-1143 (1997). 78. M.J. Thorpe, K.D. Moll, J.R. Jones, B. Safdi, and J. Ye,“Broadband cavity ringdown spectroscopy for sensitive andrapid molecular detection”Science 311, 1595-1599 (2006). 79. B.W. Moeskops, S.M. Cristescu, and F.J. Harren,“Sub-part--per-billion monitoring of nitric oxide by use of wavelengthmodulation spectroscopy in combination with a thermoelectri-cally cooled, continuous-wave quantum cascade laser”, Opt.Lett. 31,823-825(2006). 80. K.L. Moskalenko, A.I. Nadezhdinskii, and I.A. Adamovskaya,“Human breath trace gas content study by tunable diode laserspectroscopy technique”,Infrared Phys. Tech. 37, 181-192(1996). 81. L. Le Marchand, L.R. Wilkens, P. Harwood, and R.V. Cooney,“Use of breath hydrogen and methane as markers of colonicfermentation in epidemiologic studies: circadian patterns of ex-cretion”, Environ. Health Perspect. 98, 199-202 (1992). 82. M. Scotoni, A. Rossi, D. Bassi,R. Buffa, S. Iannotta, and ABoschetti,“Simultaneous detection of ammonia, methane andethylene at 1.63 um with diode laser photoacoustic spectroscopy”,Appl. Phys. B: Lasers Opt. 82, 495-500 (2006). 83. J.C. Anderson, W.J.E. Lamm, and M.P. Hlasatala,“Measuringairway exchange of endogenous acetone using a single-exhala-tion breathing maneuver”, J. Appl. Physiol. 100, 880-889(2005). 84. C. Turner, P. Spanel, and D. Smith, “A longitudinal study ofammonia, acetone and propanol in the exhaled breath of 30subjects using selected ion flow tube mass spectrometrySIFT-MS”, Physiol. Meas. 27, 321-337(2006). 85. K. Namjou, C.B. Roller, T.E. Reich, J.D. Jeffers, G.L.McMillen, P.J. McCann, and M.A. Camp,“Determination ofexhaled nitric oxide distributions in a diverse sample popula-tion using tunablediode laser absorption spectroscopy”, Appl.Phys. B: Lasers Opt. 85, 427-435 (2006). 86. K. Musa-Veloso, S.S. Likhodii, E. Rarama, S. Benoit, Y.M.C.Liu, D. Chartrand, R. Curtis, L. Carmant, A. Lortie, F.J.E.Comeau, and S.C. Cunnane, “Breath acetone predicts plasmaketone bodies in children with epilepsy on a ketogenic diet",Nutrition 22, 1-8(2006). 87. F. Pabst, W. Miekisch, P. Fuchs, S. Kischkel, and J.K. Schu-bert, “Monitoring of oxidative and metabolic stress during car-diac surgery by means of breath biomarkers: an observationalstudy”, J. Cardiothorac. Surg. 2,37 (2007). 88. M. Kupari, J. Lommi, M. Ventila, and U.Karjalainen,“Breathacetone in congestive heart failure”Am. J. Cardiol. 76,1076-1078(1995). 89. C. Wang and A. Mbi, “A new acetone detection device usingcavity ringdown spectroscopy at 266 nm: evaluation of the in-strument performance using acetone sample solutions”, Meas.Sci. Technol. 18, 2731-2741(2007). 90. C. Wang, A. Mbi, M. Shepherd,“A study on breath acetone indiabetic patients using a cavity ringdown breath analyzer: ex-ploring correlations of breath acetone with blood glucose andglycohemoglobin A1C”.IEEE. J. Sensors. 10, 54-63 (2010). 91. C. Wang and A.B. Surampudi,“An acetone breath analyser us-ing cavity ringdown spectroscopy: an initial test with humansubjects under various situations". Meas. Sci. Technol. 19,105604-105614(2008). 92. F. da Silva, M. Nobre, A. Fernandes, R. Antunes,D. Almeida,G. Garcia, N.J. Mason, and P. Limao-Vieira, “Spectroscopicstudies of ketones as a marker for patients with diabetes”,√J.Phys.: Conf. Series 101, 012011/1-7(2008). 93.B.A. Bodhaine,N.B. Wood,E.G. Dutton, and J.R. Slusser,“OnRayleigh Optical Depth Calculation”, J. Atm. Ocean. Tech. 16,1854-1861(1999). 94. Lange’s Handbook of Chemistry, Sixteenth Edition, McGraw--Hill Education: New York, Chicago, San Francisco, Lisbon,London, Madrid, Mexico City,2005. ( 95. Y. Ma, R. Lewicki, M. Razeghi, and F.K. Titte l ,“QEPAS based ppb-level detection of CO and N2O using a high power CW DFB-QCL”,Opt Express. 21, 1008-19 (2013). ) pto-Electron. Rev., no. ,SEP, WarsawBrought to you by|Military Technical AcademyAuthenticated |elzbieta.sadowska@wat.edu.plDownload Date|//AM Number of trace compounds (called biomarkers), which occur in human breath, provide an information about individual featureof the body, as well as on the state of its health. In this paper we present the results of experiments about detection of certainbiomarkers using laser absorption spectroscopy methods of high sensitivity. For NO, OCS, C2H6, NH3, CH4, CO and CO(CH3)2an analysis of the absorption spectra was performed. The influence of interferents contained in exhaled air was considered. Opti−mal wavelengths of the detection were found and the solutions of the sensors, as well as the obtained results were presented. Formajority of the compounds mentioned above the detection limits applicable for medicine were achieved. The experiments showedthat the selected optoelectronic techniques can be applied for screening devices providing early diseases detection.
关闭-
1/13
-
2/13
还剩11页未读,是否继续阅读?
继续免费阅读全文产品配置单
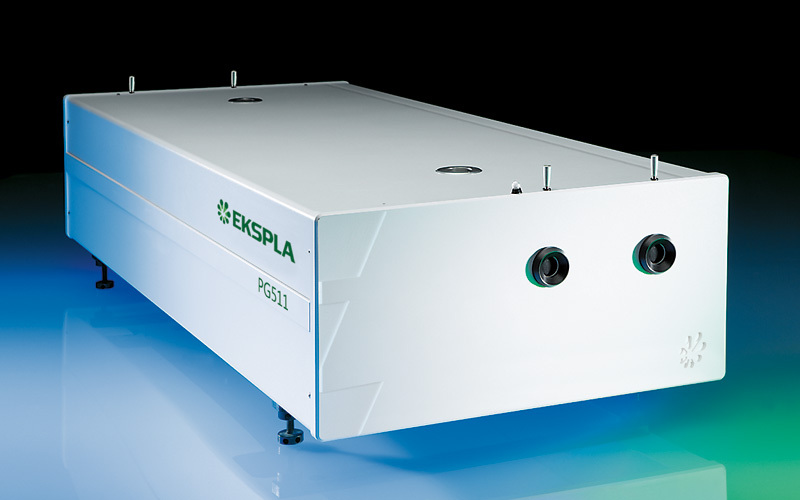
北京欧兰科技发展有限公司为您提供《人呼吸气体中疾病标识物检测方案(激光产品)》,该方案主要用于其他中疾病标识物检测,参考标准《暂无》,《人呼吸气体中疾病标识物检测方案(激光产品)》用到的仪器有Ekspla PGx11 窄线宽皮秒光学参量发生器。
我要纠错


相关方案
 咨询
咨询