

方案详情文
智能文字提取功能测试中
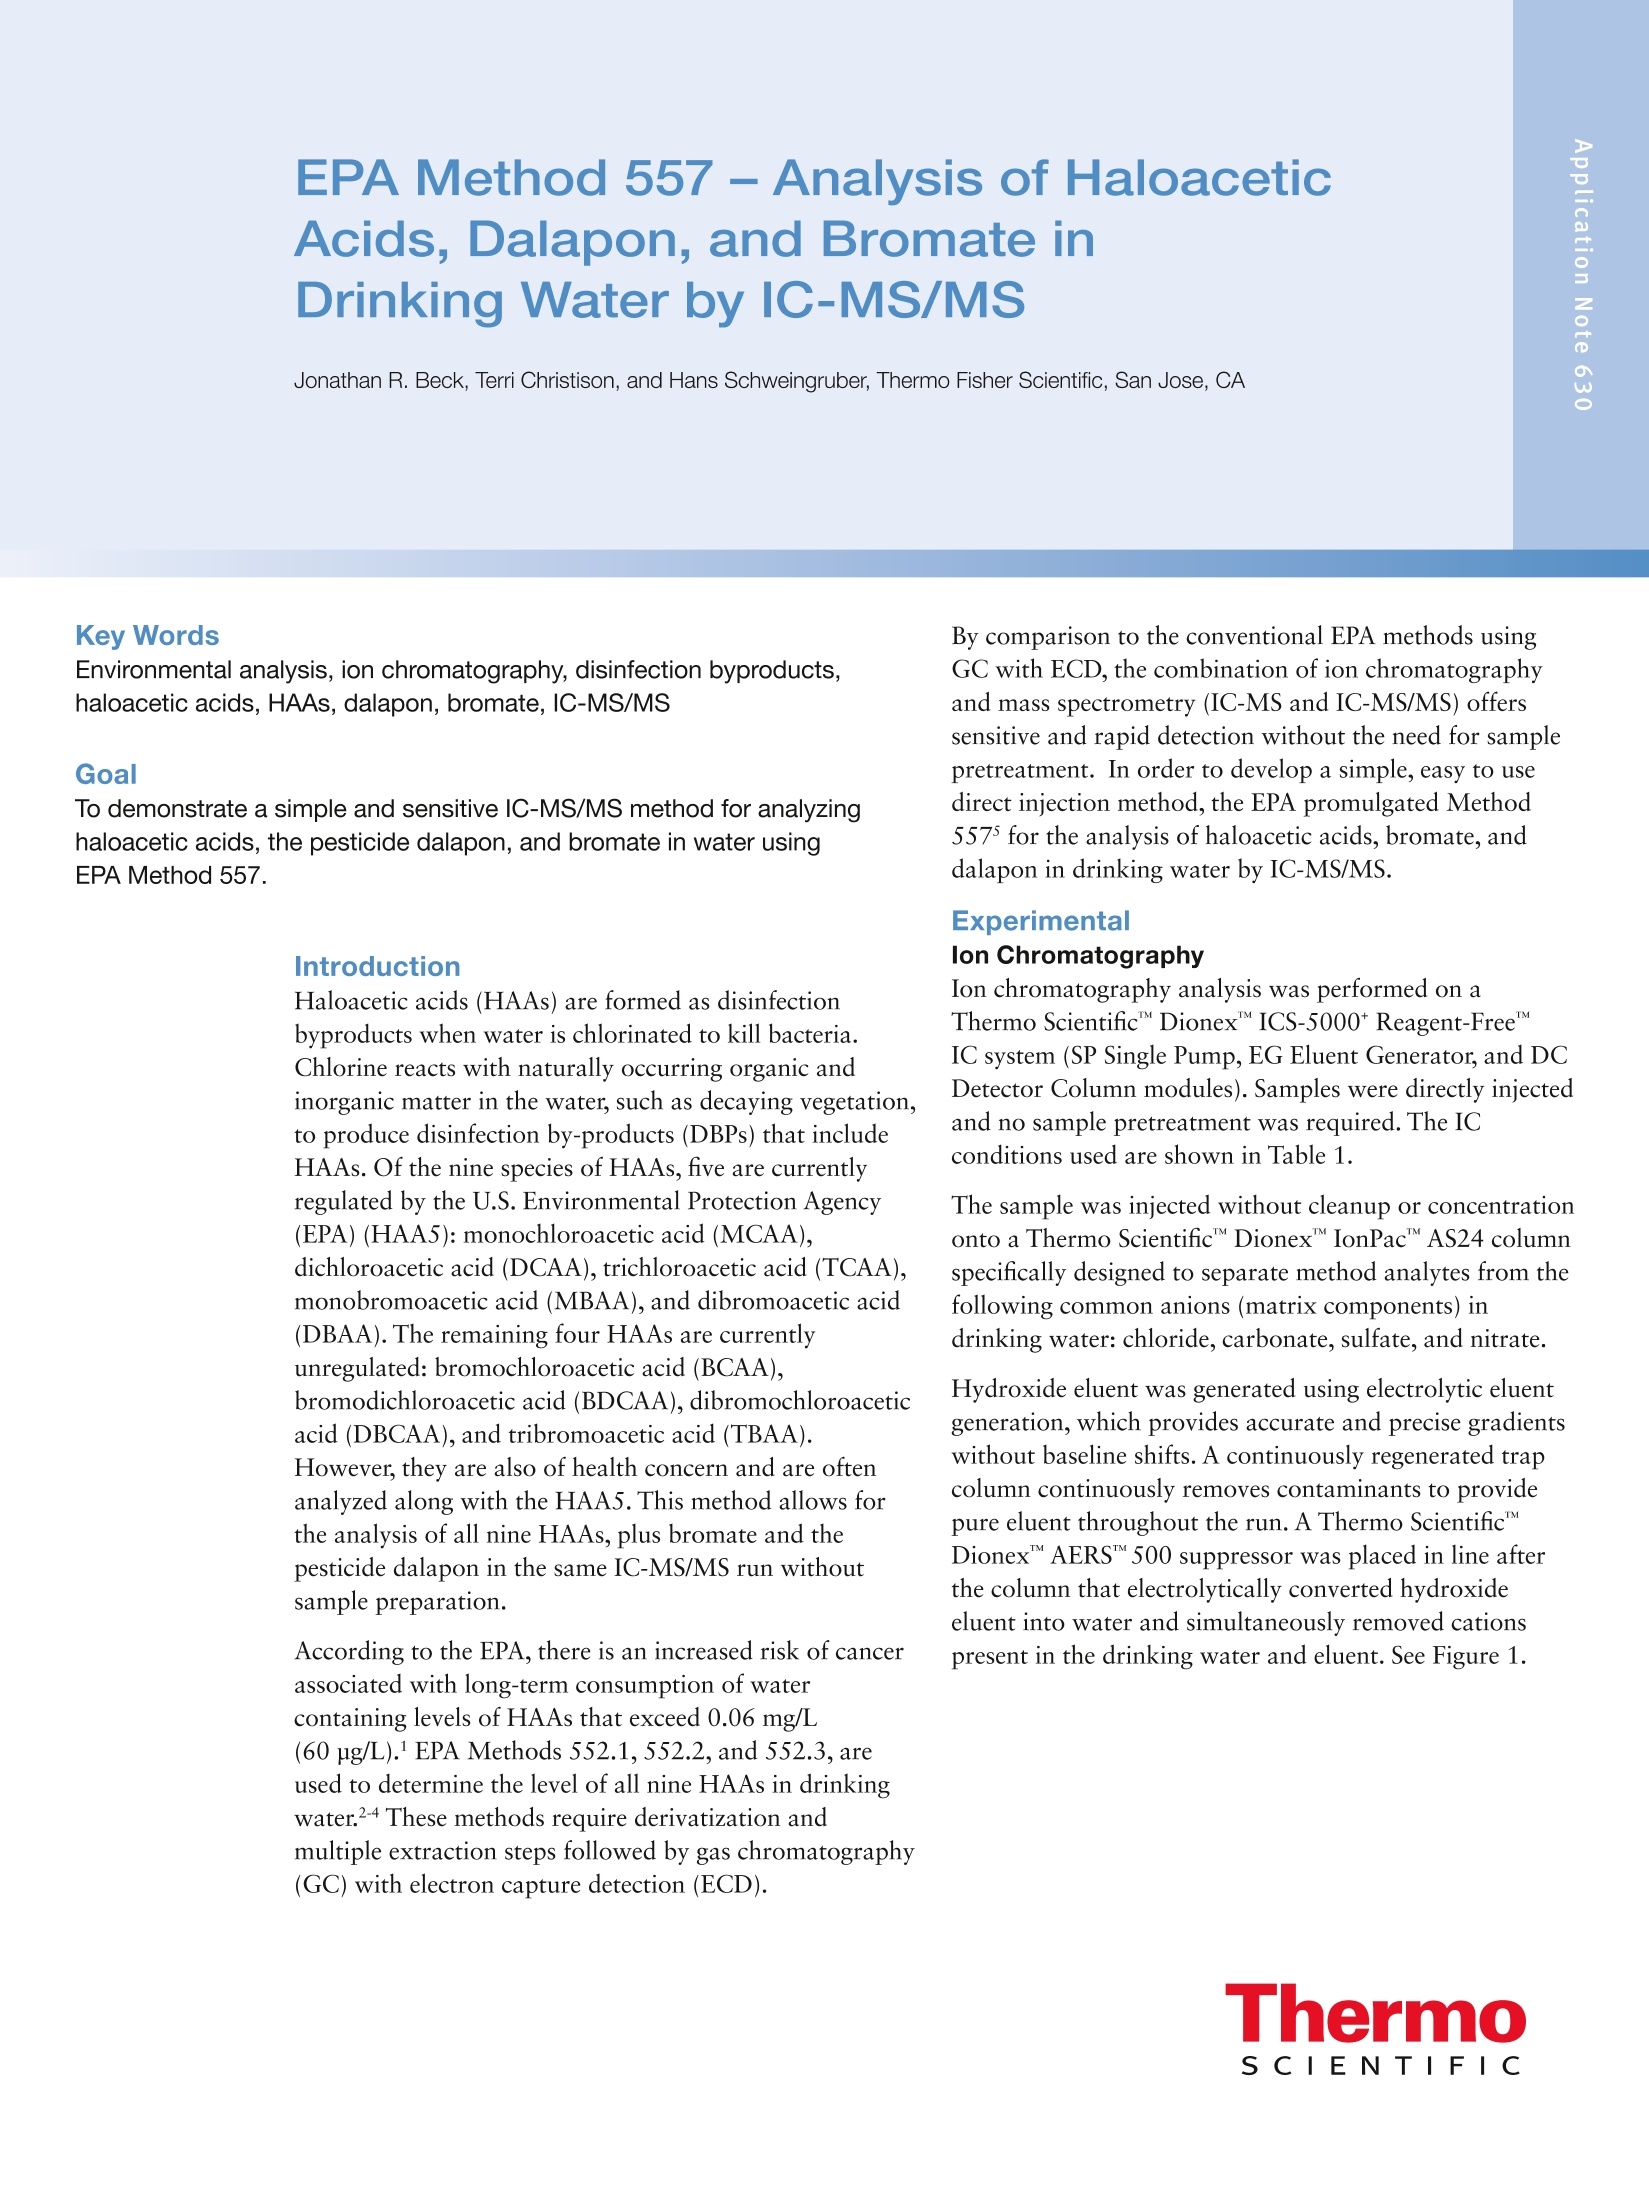
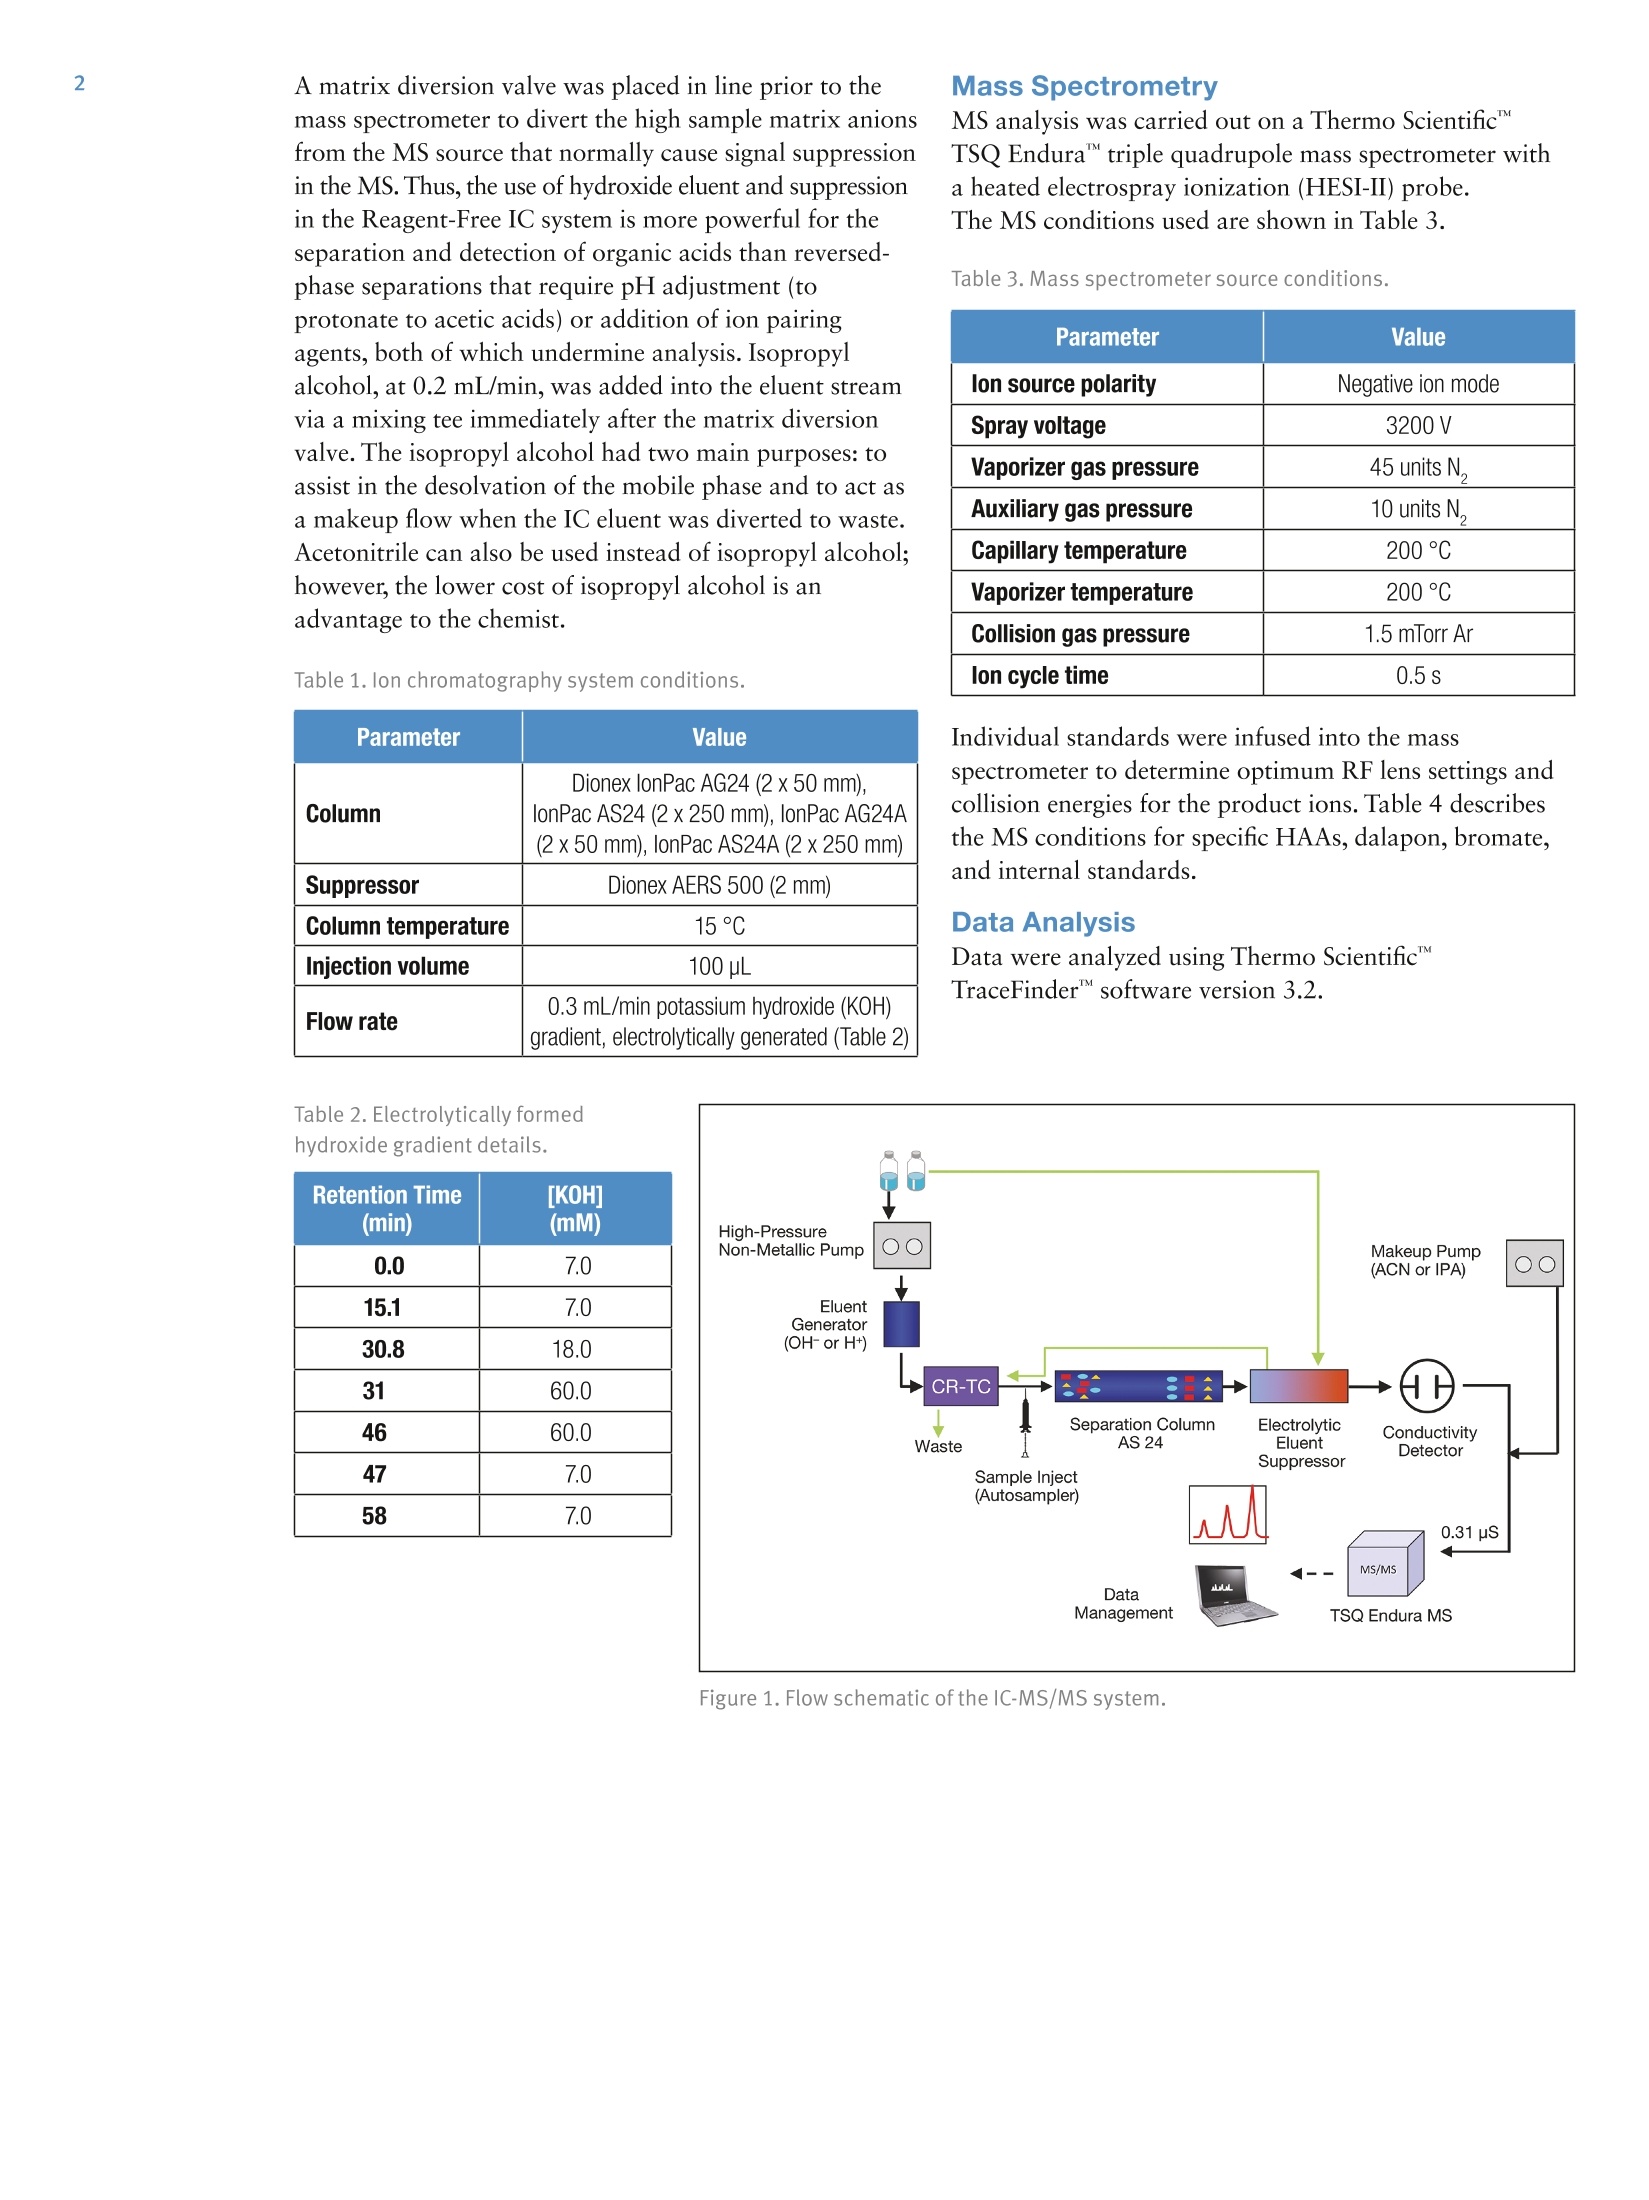
2 4 A Thermo Fisher Scientific BrandAN64514-EN 0715S EPA Method 557 - Analysis of HaloaceticAcids, Dalapon, and Bromate inDrinking Water by IC-MS/MS Jonathan R. Beck, Terri Christison, and Hans Schweingruber, Thermo Fisher Scientific, San Jose, CA To demonstrate a simple and sensitive IC-MS/MS method for analyzinghaloacetic acids, the pesticide dalapon, and bromate in water usingEPA Method 557. Introduction Haloacetic acids (HAAs) are formed as disinfectionbyproducts when water is chlorinated to kill bacteria.Chlorine reacts with naturally occurring organic andinorganic matter in the water, such as decaying vegetation,to produce disinfection by-products (DBPs) that includeHAAs. Of the nine species of HAAs, five are currentlyregulated by the U.S. Environmental Protection Agency(EPA) (HAA5): monochloroacetic acid (MCAA),dichloroacetic acid (DCAA),trichloroacetic acid (TCAA),monobromoacetic acid (MBAA), and dibromoacetic acid(DBAA). The remaining four HAAs are currentlyunregulated: bromochloroacetic acid (BCAA),bromodichloroacetic acid (BDCAA), dibromochloroaceticacid (DBCAA), and tribromoacetic acid (TBAA).However, they are also of health concern and are oftenanalyzed along with the HAA5. This method allows forthe analysis of all nine HAAs, plus bromate and thepesticide dalapon in the same IC-MS/MS run withoutsample preparation. According to the EPA, there is an increased risk of cancerassociated with long-term consumption of watercontaining levels of HAAs that exceed 0.06 mg/L(60 pg/L).1 EPA Methods 552.1, 552.2, and 552.3, areused to determine the level of all nine HAAs in drinkingwater.2-4These methods require derivatization andmultiple extraction steps followed by gas chromatography(GC) with electron capture detection (ECD). By comparison to the conventional EPA methods usingGC with ECD, the combination of ion chromatographyand mass spectrometry (IC-MS and IC-MS/MS) offerssensitive and rapid detection without the need for samplepretreatment. In order to develop a simple, easy to usedirect injection method, the EPA promulgated Method5575 for the analysis of haloacetic acids, bromate, anddalapon in drinking water by IC-MS/MS. Experimental lon Chromatography Ion chromatography analysis was performed on aThermo Scientific" DionexICS-5000*Reagent-Free"IC system (SP Single Pump, EG Eluent Generator, and DCDetector Column modules). Samples were directly injectedand no sample pretreatment was required. The ICconditions used are shown in Table 1. The sample was injected without cleanup or concentrationonto a Thermo ScientificDionexIonPacAS24 columnspecifically designed to separate method analytes from thefollowing common anions (matrix components) indrinking water: chloride,carbonate, sulfate, and nitrate. Hydroxide eluent was generated using electrolytic eluentgeneration, which provides accurate and precise gradientswithout baseline shifts. A continuously regenerated trapcolumn continuously removes contaminants to providepure eluent throughout the run. A Thermo Scientific"TMDionex"AERS"500 suppressor was placed in line afterthe column that electrolytically converted hydroxideeluent into water and simultaneously removed cationspresent in the drinking water and eluent. See Figure 1. A matrix diversion valve was placed in line prior to themass spectrometer to divert the high sample matrix anionsfrom the MS source that normally cause signal suppressionin the MS.Thus, the use of hydroxide eluent and suppressionin the Reagent-Free IC system is more powerful for theseparation and detection of organic acids than reversed-phase separations that require pH adjustment (toprotonate to acetic acids) or addition of ion pairingagents, both of which undermine analysis. Isopropylalcohol, at 0.2 mL/min, was added into the eluent streamvia a mixing tee immediately after the matrix diversionvalve.The isopropyl alcohol had two main purposes: toassist in the desolvation of the mobile phase and to act asa makeup flow when the IC eluent was diverted to waste.Acetonitrile can also be used instead of isopropyl alcohol;however, the lower cost of isopropyl alcohol is anadvantage to the chemist. Table 1. Ion chromatography system conditions. Parameter Value Column Dionex lonPac AG24 (2x50 mm),lonPac AS24 (2x250 mm), lonPac AG24A(2x50 mm), lonPac AS24A (2x250 mm) Suppressor Dionex AERS 500 (2 mm) Column temperature 15°C Injection volume 100pL Flow rate 0.3 mL/min potassium hydroxide (KOH) gradient, electrolytically generated (Table 2) Mass Spectrometry MS analysis was carried out on a Thermo ScientificTSQ Enduratriple quadrupole mass spectrometer witha heated electrospray ionization (HESI-II) probe.The MS conditions used are shown in Table 3. Table 3. Mass spectrometer source conditions. Parameter Value lon source polarity Negative ion mode Spray voltage 3200V Vaporizer gas pressure 45 units N Auxiliary gas pressure 10 units N. Capillary temperature 200°℃ Vaporizer temperature 200°℃ Collision gas pressure 1.5 mTorr Ar Ion cycle time 0.5s Individual standards were infused into the massspectrometer to determine optimum RF lens settings andcollision energies for the product ions. Table 4 describesthe MS conditions for specific HAAs, dalapon, bromate,and internal standards. Data Analysis Data were analyzed using Thermo Scientific" TraceFinder software version 3.2. Table 2. Electrolytically formedhydroxide gradient details. Retention Time (min) [KOH] (mM) 0.0 7.0 15.1 7.0 30.8 18.0 31 60.0 46 60.0 47 7.0 58 7.0 Table 4. Optimized MS transitions for each compound analyzed in this experiment. Per the EPA method, only one product ion wasmonitored for each precursorion. Analyte Q1 (m/z) Q3 (m/z) RF lens (V) CE (V) MCAA 92.9 35.0 67 10 MBAA 136.9 79.0 60 13 DCAA 126.9 82.9 70 10 DBAA 216.8 172.8 72 12 BCAA 172.9 128.9 70 11 TCAA 160.9 116.9 45 8 BDCAA 162.9 81.0 60 10 DBCAA 206.9 81.0 90 16 TBAA 252.8 81.0 70 17 Dalapon 140.9 96.8 56 7 Bromate 126.9 110.9 90 22 MCAA-ISTD 94.0 35.0 67 10 MBAA-ISTD 138.0 79.0 60 13 DCAA-ISTD 128.0 84.0 70 10 TCAA-ISTD 162.0 118.0 45 8 Results and Discussion Data acquisition and processing were carried out usingThermo ScientificTraceFinderM software version 3.2.The separation of the nine HAAs and two other analytesis shown in Figure 2. This chromatogram is from thelaboratory synthetic sample matrix (LSSM) fortified at20 ug/L. The LSSM is a prepared matrix of 250 mg/L ofeach of chloride and sulfate, 150 mg/L of bicarbonate,20 mg/L of nitrate, and 100 mg/L ammonium chloridepreservative, for a total chloride concentration of316 mg/L. All eleven compounds are shown in Figure 2.The selectivity of the IC-MS/MS system allows separationof the HAAs from common inorganic matrix ions. Thisallows matrix peaks of chloride, sulfate,nitrate, andbicarbonate to be diverted to waste during the analyticalrun and avoids premature fouling of the ESI-MS/MSinstrument source. Figure 3 shows the conductivitydetector response chromatogram. The response from theCl, SOand NO, can be seen in the trace. However,these ions do not coelute with the HAAs and they arediverted to waste using the method-controlled 6-portvalve on the mass spectrometer. Specifically, the IC streamis diverted to waste from 0-12 minutes, 16-22.75minutes, 30-37 minutes, and from 48 minutes until theend of the run. 13.2 NL:7.16E3100-MCAA TIC F:-C ESI SRMms2 92.920134.999-35.001]50- MS LSSM-0010-NL:1.54E4100- MBAA 50- TIC F:-C ESI SRMms2 136.920178.999-79.0011MS LSSM-001 0-1 Bromate 1015.3 NL2.65E400-cTIC F:-C ESI SRMms2 126.900[110.899-110.901150- MS LSSM-0010-23.2 100- Dalapon NL:4.02E4TIC F:-C ESI SRMms2 140.980[96.799-96.8011 50- MS LSSM-001 0-24 NL: 1.06E5100-TIC F:-c ESI SRMDCAA ms2 126.940[82.949-82.951150- MS LSSM-00125.7 NL:7.79E4100- BCAA TIC F:-CESI SRMms2 172.890[128.919-128.9211 501 MS LSSM-0010-10m 20 30 40 50Time (min) 100- 806040 20- 0- 100-80 6040 20 0- ,1100= 801 6040= 20- 0- 100= 806040 200 100= 80- 6040 20- 010 Figure 2. Overlaid chromatograms of the LSSM fortified at 20 pg/L collected on a DionexICS-5000* system coupled to a TSQ Endura MS. Figure 3. Conductivity detector trace showing the response of Cl, SO 2, and NO added to the laboratory synthetic sample matrix.These peaks were diverted to waste and did not enter the mass spectrometer, as indicated by red arrows. An internal standard mixture of 13C-labeled MCAA.MBAA, DCAA, and TCAA was spiked into each sampleat 4 ug/L. All calibration standards were prepared indeionized water containing 100 mg/L NH Cl as apreservative. The calibration curves were generated usinginternal standard calibrations for all of the HAAcompounds in water. Excellent linearity results wereobserved for all compounds. Analytes were run at levels of250 ng/L to 20 ug/L in a seven-point calibration curve. Allof the HAAs were detected at all concentration levels(20, 10,5,2,1,0.5, and 0.25 ug/L). It should be notedthat TCAA sensitivity is very strongly correlated with thesource temperature of the mass spectrometer and theTBAA sensitivity decreases at higher column temperatures.Higher source temperatures caused a loss in TCAA signal.For TBAA, the column temperature was maintained at15 C as specified in the EPA method. Additionally, toimprove the TCAA detection, the effect of temperature ofthe MS source on TCAA's response was tested.Temperatures of 200 °C for both the ion transfer tube andvaporizer were found to be optimal for TCCA detectionwithout impacting the detection of the other eightanalytes. This phenomenon of TCAA temperaturesensitivity has been reported in studies with other MSinstrumentation configurations.6 Method detection limits were calculated by seven replicateinjections of 0.5 ug/L of each analyte and the equationMDL=t,9%x S(n-7), where: t is Student's t at 99%confidence intervals (t99%,n=7= 3.143) and S is thestandard deviation. Table 6 compares these results to thecalculated MDL values of EPA Method 552.2, whichuses liquid-liquid extraction and methylation of thecarboxylic acids before determination by GC-ECD. Theresults obtained by the IC-MS/MS method exceeded theMDLs reported in EPA Method 552.2, with the exceptionof DBCAA. Table6. MDL calculation results for each compound for sevenreplicate injections of the 0.5 ug/L calibration standard comparedto the MDLs from EPA Method 552.2. Note the EPA methodcalculated the MDLs on various fortified levels. Please refer to theEPA method for details. Analyte CalculatedMDL (ug/L) EPA Method552.2 MDL (ug/L) %RSDs (n=7) MCAA 0.105 0.273 10.7 MBAA 0.104 0.204 6.3 DCAA 0.044 0.242 2.8 DBAA 0.021 0.066 1.6 BCAA 0.059 0.251 4.4 TCAA 0.033 0.079 3.0 BDCAA 0.141 0.091 10.6 DBCAA 0.214 0.468 15.9 TBAA 0.159 0.820 15.6 Dalapon 0.050 N/A 3.7 Bromate 0.059 N/A 6.3 Municipal Drinking Water Sample Analysis Additionally, municipal drinking water from San Jose, CA,was analyzed for the presence of any of the analytescontained in the method. Municipal drinking watersamples were collected in accordance with the procedurefor EPA Method 557, with NH Cl added as apreservative, as it reacts with residual chlorine preventingfurther formation of haloacetic acids. Internal standardswere added and the samples were quantified. The levels ofeach compound detected in the samples are shown inTable 7. The total amount of haloacetic acids for all nineHAAs was 35.62 ug/L. For the regulated HAA5, the totalwas 30.21 ug/L. The MCL set by the US EPA for theHAA5 is 0.060 mg/L(60 pg/L).7 This sample was belowthat limit, at 0.03021 mg/L (30.21 pg/L). Table 7. Results of analysis of San Jose,CA, municipal drinkingwater for the presence of HAAs. Eight out of the nine HAAsanalyzed plus bromate were detected. The total amount of HAAspresent in this sample was 35.62 ug/L. Analyte Detected Amount (ug/L) MCAA 1.08 MBAA N/D DCAA 15.21 DBAA 0.95 BCAA 2.65 TCAA 12.97 BDCAA 2.07 DBCAA 0.69 TBAA N/D Dalapon N/D Bromate 0.44 Analysis of Five Regulated HAAs If the entire panel of nine haloacetic acids is not required,the runtime can be shortened to 45 minutes. The adjustedgradient is shown in Table 8. All other parameters areidentical to those used in the analysis of the nine HAAs.Additionally, the AG24A guard column and AS24Aanalytical column can be utilized. Retention times for theHAAs will not change; however, the AS24A column offerssuperior separation of the chlorite ion that may co-elutewith MCAA. An example chromatogram showing theseparation of the five HAAs is shown in Figure 4. Table 8. Electrolytically formed hydroxide gradient for the analysisof five HAAs. Time (min) 「KOH1 (mM) 0.0 7.0 15.1 7.0 30.8 18.0 31 60.0 40 60.0 40.1 7.0 45 7.0 Figure 4. Extracted MS chromatograms of the five HAAs regulated by the US EPA. LSSM fortified sample at 2 pg/L collected on a DionexICS-5000* system coupled to a TSQ Endura MS. Note, the descending baseline seen just before the TCAA peak is due to the divert valveswitching and is not a response from TCAA. Conclusion Reagent Free IC systems coupled with an MS/MS detectorare a powerful tool used in the quantitation of haloaceticacid samples. When compared to the conventional EPAmethods using GC with electron capture, using thecombination of the ICS-5000* ion chromatography systemand the TSQ Endura triple quadrupole mass spectrometerto analyze for haloacetic acids saves analysts several hoursof sample preparation as well as eliminating costly andtoxic derivitization agents. This time savings is a result ofthe lack of time-consuming sample pretreatment whileoffering sufficient sensitivity to quantitate all ninehaloacetic acids. The resolution between the matrix peaksand haloacetic acids is excellent, which allows forminimum interference in detection, as well as ensuring acleaner ion source of the mass spectrometer. Excellent reproducibility and quantitation of HAAswas achieved when samples were spiked into a simulatedmatrix containing 250 mg/L of each of chloride andsulfate, 150 mg/L bicarbonate, 20 mg/L of nitrate, and100 mg/L ammonium chloride preservative for a totalchloride concentration of 316 mg/L. Results are betterthan those achieved in EPA Method 552.2, except forBDCAA, and comparable to those in EPA Method 557,except for higher MDLs for brominated compounds. Acknowledgments The authors would like to thank Brenda Steffy atLEGEND Technical Services, Inc. in Phoenix Arizona forsupplying the chromatogram shown in Figure 4. ( References ) 1. U.S.Environmental Protection Agency, MicrobialHealth Effects Tables: Potential Adverse Health Effectsfrom High/Long-term Exposure to HazardousChemicals in Drinking Water, 2002. ( 2. U.S. Environmental Protection Agency,Method 552.1,Determination of Haloacetic Acids and Dalapon inDrinking W ater by Ion Exchange Liquid-SolidExtraction and Gas Chromatograpby with Electron Capture Detection, Rev. 1 .0 , 1992. ) ( 3. U.S.Environmental Protection Agency, Method 552.2,Determination of Haloacetic Acids and Dalapon in Drinking W ater by Liquid-Liquid Extraction, Derivatization, and Gas Chromatography with Electron Capture Detection, R ev 1 . 0, 1995. ) 41U.S. Environmental Protection Agency, Method 552.3,Determination of Haloacetic Acids and Dalapon inDrinking Water Liquid-Liquid Microextraction,Derivatization, and Gas Chromatograpby withElectron Capture Detection, Rev 1.0, 2003. 5. U.S. Environmental Protection Agency, Method 557,Determination of Haloacetic Acids, Bromate,andDalapon in Drinking Water by Ion ChromatographyElectrospray Ionization Tandem Mass Spectrometry(IC-ESI-MS/MS),Rev 1.0,2009 6. Slingsby, R.; Saini, C.; Pohl, C.;Jack,R.The Measurement of Haloacetic Acids in DrinkingWater Using IC-MS/MS-Method Performance,Presented at the Pittsburgh Conference, New Orleans,LA, March 2008. 7. U.S. Environmental Protection Agency, BasicInformation about Disinfection Byproducts inDrinking Water: Total Tribalomethanes, HaloaceticAcids, Bromate, and Chlorite, http://water.epa.gov/drink/contaminants/basicinformation/disinfectionbyproducts.cfm www.thermoscientific.com @2015 Thermo Fisher Scientific Inc. All rights reserved. ISO is a trademark of the International Standards Organization. All othertrademarks are the property of Thermo Fisher Scientific and its subsidiaries. This information is presented as an example of theianahiliticapabilities of Thermo Fisher Scientific products. It is not intended to encourage use of these products in any manners that mightinfringe the intellectual property rights of others. Specifications, terms and pricing are subject to change. Not all products areavailable in all countries. Please consult your local sales representative for details. Thermo Fisher Scientific. San Jose, CA USA is ISO 13485 Certified. 与使用GC和ECD的常规EPA方法相比,离子色谱和质谱(IC-MS和IC-MS / MS)的组合提供了灵敏而快速的检测,无需样品预处理。 为了开发简单易用的直接进样方法,EPA颁布了5575方法,用于通过IC-MS / MS分析饮用水中的卤乙酸,溴酸盐和茅草枯。
关闭-
1/7
-
2/7
还剩5页未读,是否继续阅读?
继续免费阅读全文产品配置单

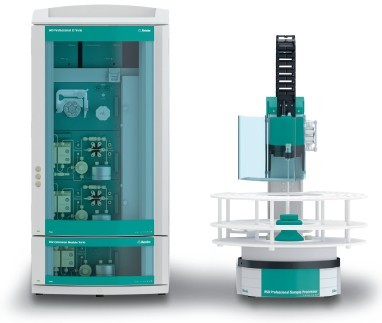
赛默飞色谱与质谱为您提供《饮用水中卤乙酸、茅草枯和溴酸盐等农药残留检测方案(蒸发光检测器)》,该方案主要用于饮用水中农药检测,参考标准《暂无》,《饮用水中卤乙酸、茅草枯和溴酸盐等农药残留检测方案(蒸发光检测器)》用到的仪器有赛默飞Dionex ICS-5000+ CD 电导检测器。
我要纠错
推荐专场
相关方案
 咨询
咨询