

方案详情文
智能文字提取功能测试中
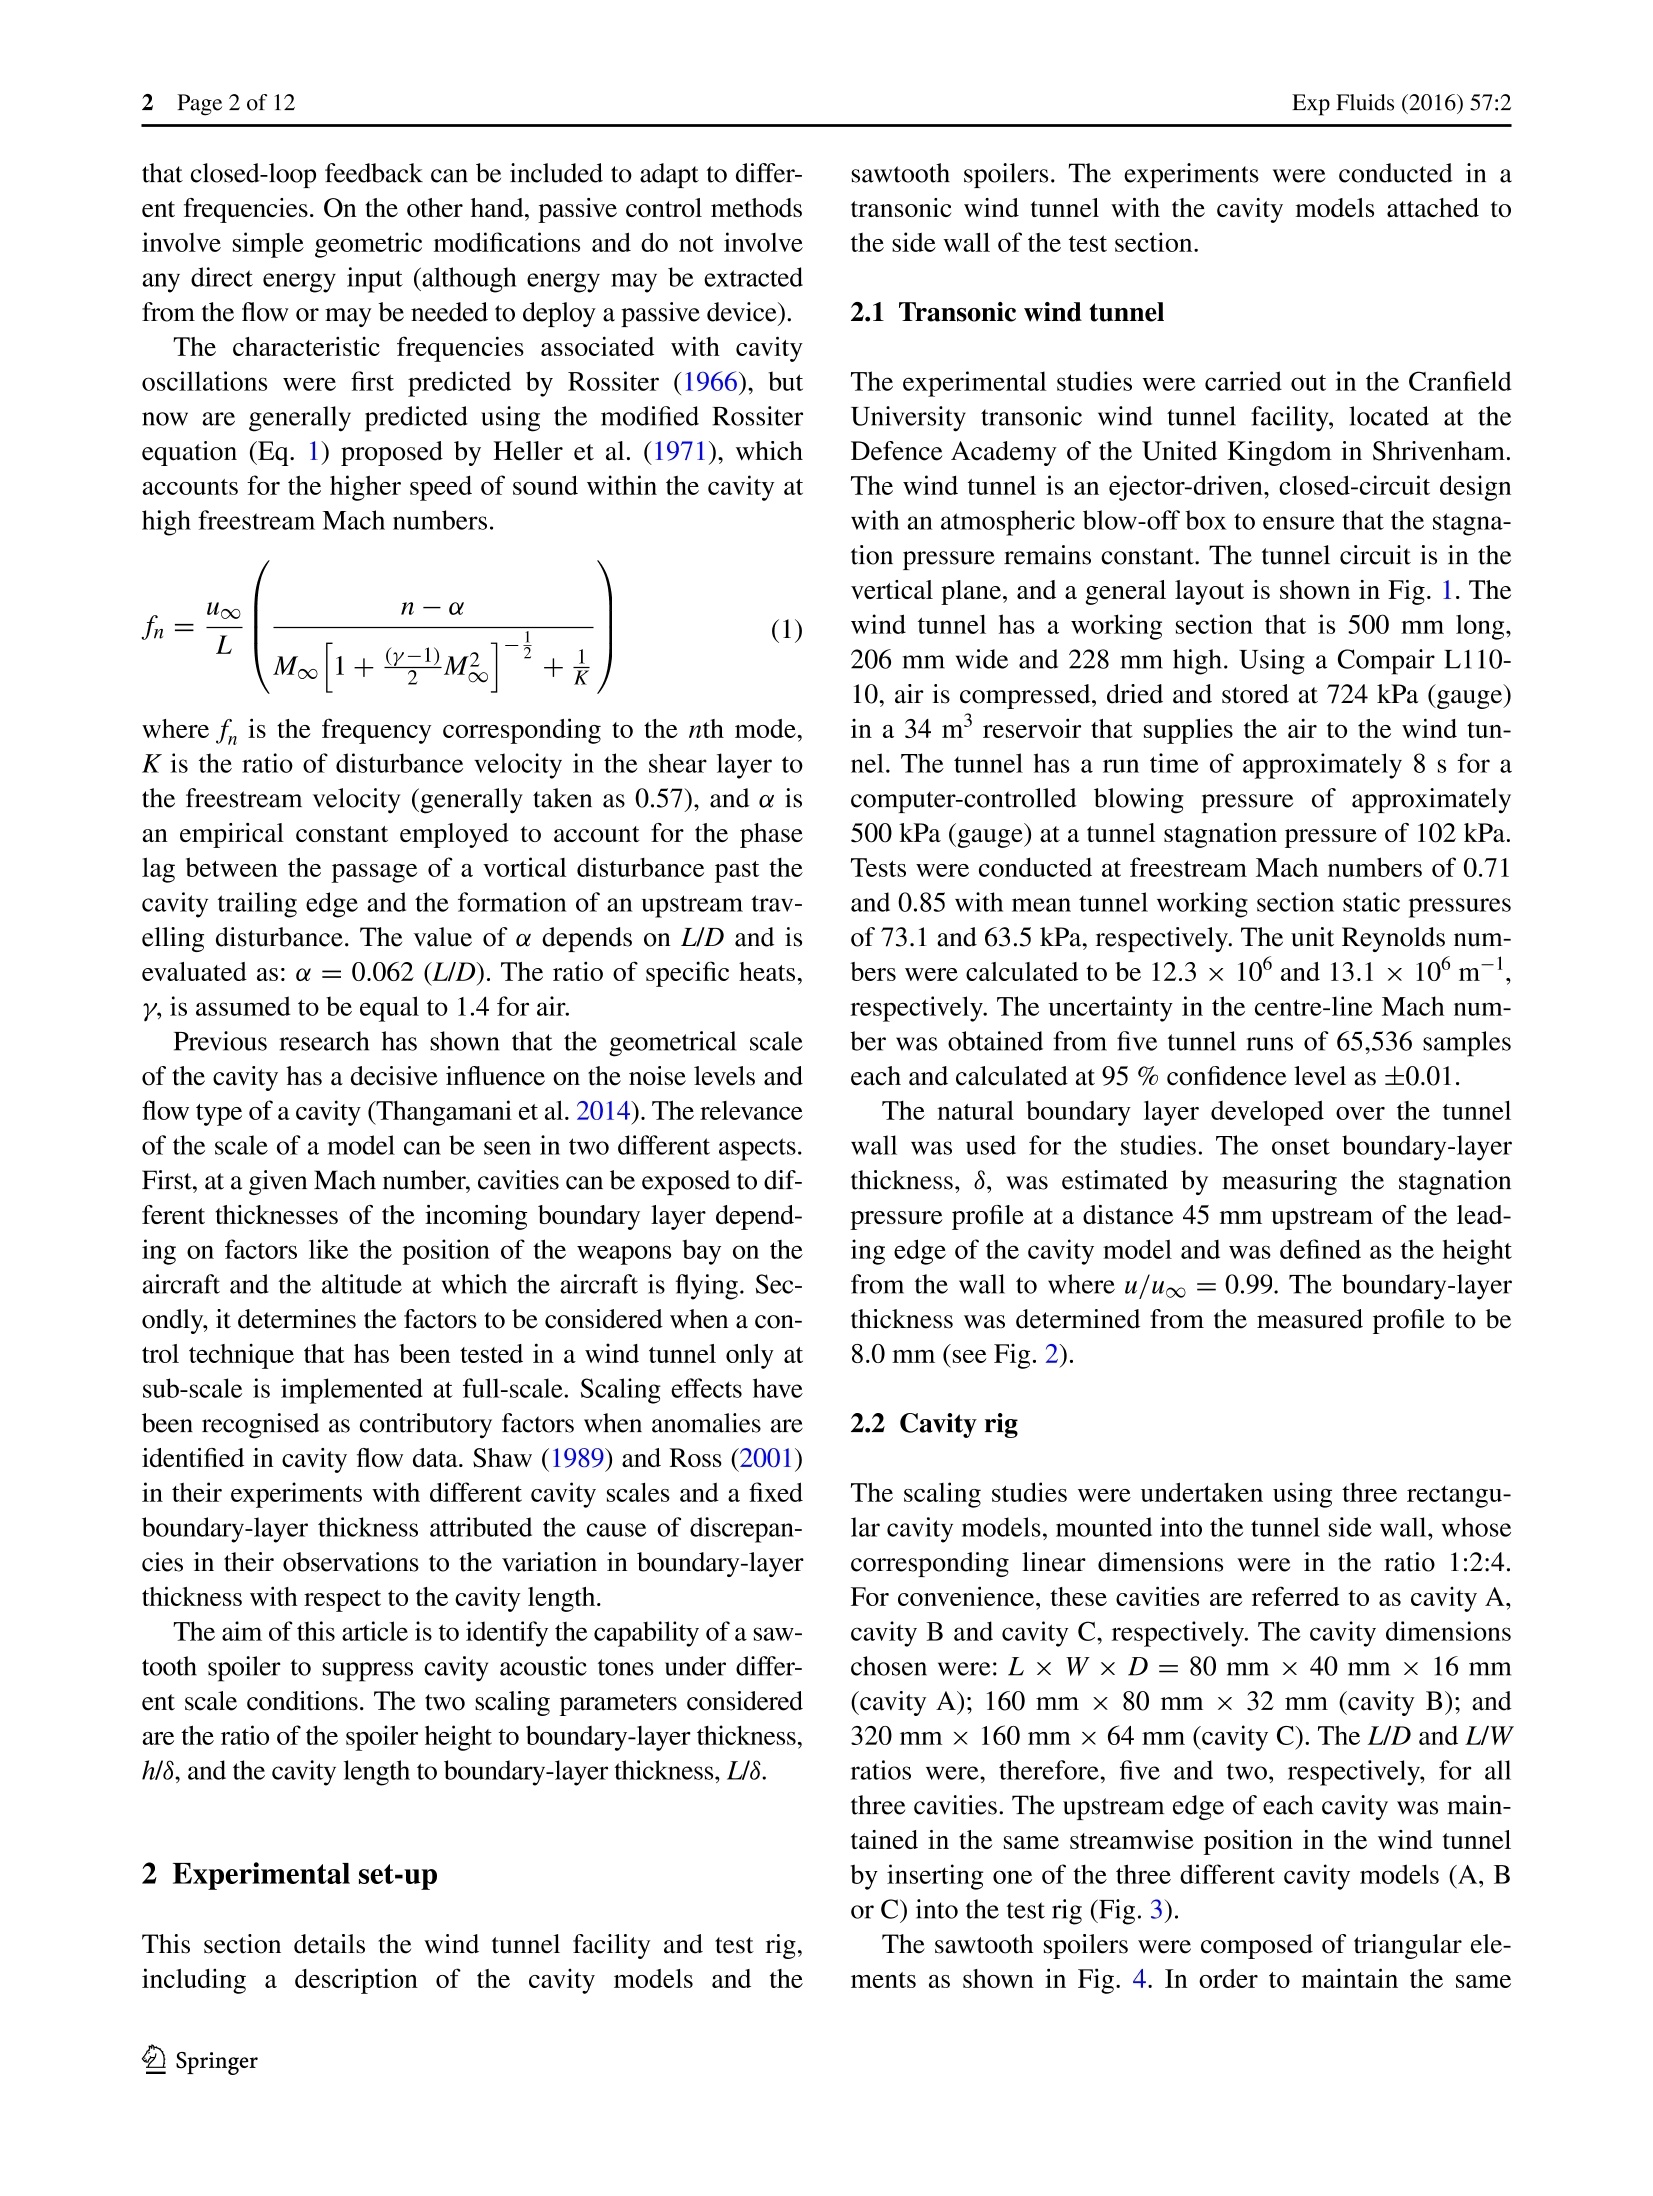
Exp Fluids (2016) 57:2DOI 10.1007/s00348-015-2088-2CrossMark 2 Page 2 of 12Exp Fluids (2016) 57:2 Scale effects on the performance of sawtooth spoilers in transonicrectangular cavity flow A. J. SaddingtonD.K.Knowles·V. Thangamani? Received: 24 July 2015 /Revised: 2 October 2015 / Accepted: 18 November 2015/ Published online: 11 December 2015C The Author(s) 2015. This article is published with open access at Springerlink.com AbstractAAn experimental study was conducted on theeffectiveness of sawtooth spoilers at suppressing acoustictones within a rectangular cavity with a length-to-depthratio of five and a width-to-depth ratio of two, operat-ing at a freestream Mach number of 0.71. Whereas previ-ous research has focussed on the ratio of spoiler height toboundary-layer thickness (h/8), this study also considersthe effect of the ratio of cavity length to boundary-layerthickness (L/8). Using a combination of unsteady pres-sure measurements and particle image velocimetry, it wasestablished that consideration of the magnitude of bothparameters is important when designing passive controlmethods for transonic cavities. A correlation was devel-oped which suggests that in order to suppress fully the cav-ity tones, a critical spoiler height, her, is defined such thathe/8=0.065≤L/8≤ 0.082. List of symbols D Cavity depth (m) fFrequency (Hz)h K Height of spoiler (m) Ratio of disturbance velocity in the shear layer tothe freestream velocity L Cavity length (m) M Mach number n Acoustic mode number 区A. J. Saddingtona.j.saddington@cranfield.ac.uk ( Aeromechanical Systems Group, Defence Academy of theUnited K ingdom, Cranfield U n iversity, Shrivenham,Swindon SN6 8LA, UK ) ( 2 Frigesco Ltd, Innovation Centre, University of Exeter, Exeter,Devon EX4 4RN,UK ) Ui Velocity vector components in Cartesian coordi-nates (u1,U2,u3)=(u,v,w) W Cavity width (m) Streamwise distance from the leading edge ofthe cavity(m) Distance from the cavity exit plane normal to thefloor (m) Spanwise distance from the cavity centre line(m) 8 Boundary-layer thickness (to 0.99ucc) (m)Ratio of specific heats OASPL Overall sound pressure level (dB) SPL Sound pressure level (dB) SWS Sawtooth spoiler 0c Freestream value (cr Critical value 0mean Mean value Orms Root-mean-square value 1 Introduction Cavities are increasingly appearing in aerospace applica-tions, such as weapons bays on high-speed aircraft. Whenthe bay doors are open, the resulting cavity flow can producehigh acoustic and aerodynamic loads that may lead to struc-tural failure. The control of cavity flow oscillations is, there-fore, of practical significance and has, consequently, beenthe subject of numerous studies (Shaw et al. 1988; Perng andDolling 2001; Ukeiley et al. 2004; MacManus and Doran2008; Lawson and Barakos 2009; Vikramaditya and Kurian2009a, b; Lada and Kontis 2011; Martinez et al. 2012). Theflow control method can be passive or active depending onthe external energy input (Cattafesta et al. 2008). Active con-trol, such as blowing (Lusk et al. 2012), has the advantage that closed-loop feedback can be included to adapt to differ-ent frequencies. On the other hand, passive control methodsinvolve simple geometric modifications and do not involveany direct energy input (although energy may be extractedfrom the flow or may be needed to deploy a passive device). The characteristic frequencies associated with cavityoscillations were first predicted by Rossiter (1966), butnow are generally predicted using the modified Rossiterequation (Eq. 1) proposed by Heller et al. (1971), whichaccounts for the higher speed of sound within the cavity athigh freestream Mach numbers. where f is the frequency corresponding to the nth mode,K is the ratio of disturbance velocity in the shear layer tothe freestream velocity (generally taken as 0.57), and o isan empirical constant employed to account for the phaselag between the passage of a vortical disturbance past thecavity trailing edge and the formation of an upstream trav-elling disturbance. The value of a depends on L/D and isevaluated as: a=0.062(L/D). The ratio of specific heats,y, is assumed to be equal to 1.4 for air. Previous research has shown that the geometrical scaleof the cavity has a decisive influence on the noise levels andflow type of a cavity (Thangamani et al. 2014). The relevanceof the scale of a model can be seen in two different aspects.First, at a given Mach number, cavities can be exposed to dif-ferent thicknesses of the incoming boundary layer depend-ing on factors like the position of the weapons bay on theaircraft and the altitude at which the aircraft is flying. Sec-ondly, it determines the factors to be considered when a con-trol technique that has been tested in a wind tunnel only atsub-scale is implemented at full-scale. Scaling effects havebeen recognised as contributory factors when anomalies areidentified in cavity flow data. Shaw (1989) and Ross (2001)in their experiments with different cavity scales and a fixedboundary-layer thickness attributed the cause of discrepan-cies in their observations to the variation in boundary-layerthickness with respect to the cavity length. The aim of this article is to identify the capability of a saw-tooth spoiler to suppress cavity acoustic tones under differ-ent scale conditions. The two scaling parameters consideredare the ratio of the spoiler height to boundary-layer thickness,h/8, and the cavity length to boundary-layer thickness, L/8. 2 Experimental set-up This section details the wind tunnel facility and test rig,including a description of the cavity models and the sawtooth spoilers. The experiments were conducted in atransonic wind tunnel with the cavity models attached tothe side wall of the test section. 2.1 Transonic wind tunnel The experimental studies were carried out in the CranfieldUniversity transonic wind tunnel facility, located at theDefence Academy of the United Kingdom in Shrivenham.The wind tunnel is an ejector-driven, closed-circuit designwith an atmospheric blow-off box to ensure that the stagna-tion pressure remains constant. The tunnel circuit is in thevertical plane, and a general layout is shown in Fig. 1. Thewind tunnel has a working section that is 500 mm long,206 mm wide and 228 mm high. Using a Compair L110-10, air is compressed, dried and stored at 724 kPa (gauge)in a 34 m’reservoir that supplies the air to the wind tun-nel. The tunnel has a run time of approximately 8 s for acomputer-controlled blowing pressure of approximately500 kPa (gauge) at a tunnel stagnation pressure of 102 kPa.Tests were conducted at freestream Mach numbers of 0.71and 0.85 with mean tunnel working section static pressuresof 73.1 and 63.5 kPa, respectively. The unit Reynolds num-bers were calculated to be 12.3× 10 and 13.1×10m-1.respectively. The uncertainty in the centre-line Mach num-ber was obtained from five tunnel runs of 65,536 sampleseach and calculated at 95 % confidence level as ±0.01. The natural boundary layer developed over the tunnelwall was used for the studies. The onset boundary-layerthickness, 8, was estimated by measuring the stagnationpressure profile at a distance 45 mm upstream of the lead-ing edge of the cavity model and was defined as the heightfrom the wall to where u/uco=0.99. The boundary-layerthickness was determined from the measured profile to be8.0 mm (see Fig.2). 2.2 Cavity rig The scaling studies were undertaken using three rectangu-lar cavity models, mounted into the tunnel side wall, whosecorresponding linear dimensions were in the ratio 1:2:4.For convenience, these cavities are referred to as cavity A,cavity B and cavity C, respectively. The cavity dimensionschosen were:LxWxD=80mm × 40 mmx 16 mm(cavityA); 160 mm x 80 mm x 32 mm (cavity B); and320mm x 160 mm x 64 mm (cavity C). The L/D and L/Wratios were, therefore, five and two, respectively, for allthree cavities. The upstream edge of each cavity was main-tained in the same streamwise position in the wind tunnelby inserting one of the three different cavity models (A, Bor C) into the test rig (Fig.3). The sawtooth spoilers were composed of triangular ele-ments as shown in Fig. 4. In order to maintain the same Fig.1 Transonic wind tunnel layout: sections A-F show the wind tunnel cross sections at various points; sections N and I are the nozzle andejector planes, respectively Fig.2 Boundary-layer profile 45 mm upstream of the cavity leadingedge cavity L/D for all tests, a 2-mm pocket was machined intothe front wall of each cavity to which the spoilers werefixed. Table 1 shows the different sawtooth spoiler geom-etries and the different cavities on which they have beentested. The reference axis system used for the experimentsis shown in Fig. 4; the origin is at the centre of the leadingedge of the cavity. The x-axis is parallel to the flow direc-tion; the y-axis is normal to the cavity exit plane. On the cavity floor, nine pressure tappings of 0.8 mmdiameter were spaced linearly in the streamwise directionat increments of x/L=0.1. Three such rows were placed at planes z/W=0, z/W=0.1625 and z/W= 0.325, which arereferred to as “Centreplane”(CP),“Offsetplane1”(OP1)and“Offsetplane2”(OP2), respectively. In total, there were27 static pressure tappings for the cavity model, forminga measurement grid on the floor as shown in Fig. 5. Flowvisualisation of a cavity with the same L/D and L/W ratiosby Atvars et al. (2009) indicated that the mean cavity flow-field is reasonably symmetric about the centreline. Hence,symmetry is assumed, and the pressure tappings have beenmade only for half of the floor plane. 2.3 Instrumentation 2.3.1 Pressure measurements The unsteady pressure measurements in the experimen-tal tests were made with an integrated pressure measure-ment device, the Scanivalve ZOC22B, and data were col-lected from the pressure tappings made on the cavity floor.The analogue signal from the ZOC22B was acquired by amodular amplifier system (DEWE-RACK) which has ananalogue-to-digital converter. The signal was amplified,conditioned and digitised before being sent to a computer.A National Instruments DAQ card 6036E was used as theinterface between the computer and the DEWE-RACK. Fig. 3 Exploded view of the test rig with different cavity models Fig. 4 General schematic of the cavity geometry and sawtoothspoiler passive control device: the spoiler pitch is defined as the dis-tance between adjacent ‘teeth’ For the spectral analysis of the unsteady pressure samples,a total of 65,536 samples, averaged over four tunnel runs,were recorded at a sampling rate of 12.5 kHz. The powerspectra were plotted using an FFT algorithm to determinethe amplitude of the different frequency components. Themaximum error in amplitude of the tones was determinedto be 0.208 dB. Table 1 Sawtooth spoiler geometries tested: pitch is defined as thedistance between adjacent ‘teeth’ Total width (mm) Pitch(mm) h (mm) h/8 Cavity 5 2 0.25 A 10 8 1 A 10 16 2 A 10 4 0.5 B 10 8 1 B 10 16 2 B 160 10 8 1 C 160 16 2 160 3 C 160 4 C W Fig.5 The arrangement of pressure tappings on the cavity floor 2.3.2 Velocity measurements Two-dimensional, time-averaged velocity field measure-ments were made using particle image velocimetry (PIV)on purpose-built, transparent cavities. The PIV equipmentconsisted of a New Wave Gemini II Nd: YAG double-pulsedlaser which, through the use of a pair of spherical lenses,created a light sheet approximately 1 mm thick. Since thewind tunnel had no optical access at right angles to thelaser sheet, the image was obtained using a front-coatedmirror oriented at 45° to the cavity side wall (Fig.6). Withthe exception of the transparent floor and wall, all the sidesof the cavity models and the test rig were painted black forthe PIV experiments to prevent stray reflections of the laserlight. Water was used for seeding the flow. Filtered clean waterwas pressurised using a three-stage pump and sprayedthrough a rake of Bete atomising nozzles positioned acrossthe span of the settling chamber of the wind tunnel. Therake consisted of three atomisers located at equal intervalsat the mid-height position of the test section. The nominalseeding particle diameter based on a seeding pressure of2000 psi is quoted by Ritchie (2005) as 10 um. All the PIV measurements given in this work wereobtained from the mid-plane of the cavity (z/W=0). Thedouble-pulse frequency of the laser was set at 15 Hz witha pulse separation of 6 ps. The images were acquired Fig. 6 Schematic of the PIVset-up. a Top view. b Side view using a 1016 x 1008 pixel resolution Kodak ES 1 Mega-plus camera fitted with a Nikkor 60 mm f2.8 lens. A totalof 700 image pairs acquired over 10 tunnel runs were usedto create a single mean velocity plot. A Dantec Flow Map500 acquisition controller was used as the hardware box,which worked in conjunction with Flow Manager (v3.21)software. Both the camera and laser were connected to thehardware box, and the timing and acquisition functions ofboth were controlled using the Flow Manager software.Due to the large size of the cavity model and limited reso-lution of the camera, the PIV data for cavity C were cre-ated from two separate sets of acquisitions. Image pairsfor cavity segments x/L= 0 to x/L=0.5 and x/L= 0.5 tox/L= 1 were acquired separately and combined togetherto get the final data for the whole length of the mid-plane.Post-processing of all PIV data was done using DaVis soft-ware from LaVision. A three-pass window deformation algorithm, with initial and final interrogation sizes of32 × 32 pixels and 12 ×12 pixels and a 50 % overlapbetween subsequent interrogation areas, was used to createthe vectors. The time-averaged data were obtained from theensemble average of 700 image pairs. The uncertainties in PIV measurements stem from anumber of factors which include errors occurring due tothe particle flow dynamics, bias errors, random errors andstatistical error in the mean and rms velocities, which arestrongly related to the sample size. To remove outliers, themedian filter proposed by Westerweel (1994) was used tolocate spurious vectors and replace them by interpolation.On average, over 95 % of the vectors in a given field werefound to be valid prior to replacement and interpolation.The accuracy with which the position of the correlationpeak is determined can be affected by bias errors. A sourceof bias error in PIV measurements is the velocity gradients present inside the interrogation area. This is because parti-cles with higher velocities tend to leave the interrogationarea between the pulses, biasing the result towards lowervelocities. This has been minimised by selecting displace-ment limits between the pulses and by using windowdeformation algorithms as described above to increase thenumber of matched particles. Progressively decreasing theinterrogation window size reduces the loss of particles fromthe interrogation area, leading to improved accuracy andbetter signal-to-noise ratios (Keane and Adrian 1992). Biaserror can also occur due to the phenomenon of peak lock-ing. Peak locking occurs because of the bias of the estima-tion ofthe position of the correlation peak towards an inte-ger number of pixels. Peak locking is attributable mainly tothe choice of the sub-pixel estimator used to locate the cor-relation peak. In the current experiments, a Gaussian sub-pixel estimator was used which was shown by Westerweel(1997) to be superior in terms of mitigating peak-lockingeffects. Random errors in PIV can arise from backgroundnoise, shot noise (which can vary from pixel to pixel) andrandom errors associated with properly identifying thesub-pixel displacement. Although these errors can play animportant role in the determination of instantaneous PIVresults, their effect on ensemble averages of large num-bers of samples (as is the current case) can be considerednegligible owing to the random nature of their occurrence.Therefore, random errors do not degrade the accuracy ofstatistics derived from larger PIV ensembles (Christensen2004). Overall, the maximum error in the mean and RMSvelocities was determined to be 2.8 and 2.6 %,respectively. 3 Results and discussion The results for the experiments made at Mach 0.71 and0.85 showed only minor differences, with the overall trendsand observations being the same. As a consequence, onlyresults for the Mach 0.71 tests will be presented here. Theeffectiveness of sawtooth spoilers across different scaleswas initially tested by using spoilers of the same profileand height, h/8=1. Spoilers with a height approximatelyequal to the boundary-layer thickness have been tested bya number of researchers including Rossiter (1966), Shawet al. (1988), Ashworth (2008) and Lawson and Barakos(2009). Figure 7 shows the power spectra of cavities A, Band C with and without the use of sawtooth spoilers. Thefirst three predicted Rossiter tones, R1, R2 and R3, calcu-lated from Eq.1, are also shown in the plots. It can clearlybe observed that the effectiveness of the spoilers is not thesame for all three cavities. With the use of spoilers, there is a significant decreasein both the broadband and tonal amplitudes for cavities Aand B. Cavity A has a maximum reduction of 5 dB in its (a) Cavity A. (b) Cavity B. Fig. 7 The effect of sawtooth spoilers on the sound pressure levelsfor cavities A, B and C (h/8=1.0,x/L=0.9) dominant tone (R1), and tones R2 and R3 are reduced tobroadband levels. For cavity B, there is a maximum reduc-tion of 12.7 dB for its dominant tone (R2) which is nolonger dominant. R1 is now the dominant tone, and R3 hasbeen shifted to a higher frequency at around 2 kHz. Thespoiler has very little effect on the amplitude of the tonesfor cavity C. Although there is a reduction of 7.4 dB in thedominant tone, the power spectrum is not reduced to broad-band. There are high-amplitude peaks present even after theuse of the spoiler, although with reduced magnitude whencompared to the clean cavity. This suggests that the samespoiler is unable to cope with the increase in flow unsteadi-ness caused by the increase in cavity scale (L/8). To gain a better understanding of the effect that thespoilers were having on the flowfield, the PIV data for each Fig. 8 The effect of a sawtoothspoiler on the cavity stream-wise velocity field of cavity A(h/8=1) flow uu. 0.2 0.15 0.1 0.05 0 -0.05 -0.1 Fig.9 The effect of a sawtoothspoiler on the cavity stream-wise velocity field of cavity B(h/8=1) flow U/uo 0.4 0.35 0.3 0.25 0.2 0.15 0.1 0.05 0 -0.05 -0.1 -0.15 -0.2 -0.25 Fig. 10 The effect of asawtooth spoiler on the cavitystreamwise velocity field of cav-ity C (h/8=1) flow Clean cavity uiu 0.4 0.35 0.3 0.25 10.2 0.15 0. 0.05 0 -0.05 -0.1 x/L cavity have been compared. Figures 8, 9 and 10 show thatthere is a significant change in the flowfield inside the cav-ity due to the presence of the spoilers. The velocity in thestreamwise direction has been reduced significantly whencompared to the clean cavity cases. This reduction in u supports the belief that the spoilers deflect the shear layeraway from the cavity. Due to the presence of the spoiler,the shear layer is vertically displaced or ‘lifted’, whichdecreases its interaction with the aft wall. This leads toa decreased momentum transfer to the acoustic source region, which is considered the main reason for tone ampli-fication. It is worth noting, however, that lifting of the shearlayer alone would not be responsible for the decrease inmomentum transfer. Spoilers introduce significant three-dimensionality into the shear layer and decrease its spatialcoherence. They also thicken the shear layer due to vorti-city induced in the streamwise direction. These factorsalso contribute to a reduced momentum transfer from thefreestream to the vicinity of the aft wall. The decreased momentum transfer and strength of theacoustic feedback result in tone attenuation that has beenobserved in the frequency spectra (Fig.7). While the maxi-mum values of umean for cavities A, B and C were observedto be 18.1, 36.1 and 41 % of the freestream velocity for therespective clean cavities, these maxima have reduced to4.9, 15.2 and 28 % for cavities with a spoiler. This indi-cates 73.2, 57.7 and 31.3 % reduction in the values of peakstreamwise velocity with a spoiler for cavities A, B and C,respectively. The velocity reduction is not constant, there-fore, for all three cavities. The fluctuating vertical veloc-ity, Vrms, also showed a non-constant magnitude relative tothe freestream velocity, with larger-scale cavities showinghigher vertical velocity components (Fig. 11). Due to theuse of the spoilers with the same h/8, the length up to whichthe shear layer is vertically displaced should be equal. It issuggested that this is the reason for a stronger interactionbetween the shear layer and the cavity trailing edge as L/8is increased. Another significant change that occurs due to the spoil-ers is the increase in the mean values of negative stream-wise velocity (-u). The increase in negative velocitiesis due to the lifting of the shear layer and a decrease inpressure inside the cavity (Thangamani et al. 2014). Thedecrease in the positive streamwise velocity and increase inthe negative streamwise velocity are not consistent acrossthe different cavity scales as clearly shown in Fig. 12,which shows the percentage change in the values of maxi-mum +u and maximum -u with the use of spoilers. CavityA is most affected by the use of spoilers and cavity C theleast affected. Where cavity tones are not fully suppressed,the change in negative streamwise velocities with the useof spoilers is likely to be responsible for the change in fre-quency of the tones observed in the power spectra due to achange in the velocity of the acoustic feedback wave. Although spoilers with h/8=1 were able to attenuatetotally the cavity tones and reduce the frequency spectrumto broadband level for small scales (cavity A), it was alsofound that the spoilers were incapable of suppressing cav-ity tones and unsteadiness at the larger scales (cavities Band C). This suggests that leading-edge spoilers cannot bescaled to the boundary-layer thickness alone to achievesuppression. When a change in L/8 results in a less-effec-tive spoiler, the only practical solution is to increase its Fig. 11 Fluctuating vertical velocity, Vrms, for different cavities withsawtooth spoilers (h/8=1) height, h. To deduce the correct spoiler height required fora particular value of L/8 requires the testing of differentspoiler heights at different values of L/8 Figure 13 shows the power spectra of the different cavi-ties with various spoiler heights. It can clearly be seen that,in general, increasing the spoiler height, h, decreases theamplitude of the cavity tones and the broadband noise. Itcan also be seen from Fig. 13a that increasing the spoilerheight from h/8= 0.25 to 1 for cavity A decreases thetonal amplitudes and broadband noise significantly. How-ever, increasing the spoiler height from h/8= 1to h/8 =2does not have much effect. This shows that the reductionin cavity noise reaches a saturation level at a particularspoiler height. This happens when all the cavity tones getreduced to a minimum broadband level achievable. Thesame behaviour can also be noticed for cavity C when h/8is increased from three to four. Once the tones are attenu-ated to a broadband level, any further increase in spoilerheight has no effect on noise reduction. The value ofspoiler height at which this saturation is attained will becalled the critical spoiler height, he The value of OASPLreached after attaining the her is not the same, however, forthe different scales. This is because the OASPL obtained Fig. 12 Percentage change instreamwise velocity from cleancavity with the use of spoilers(h/8=1) L/8 (a) Cavity A. Fig. 13 The effect of different sawtooth spoiler heights on the soundpressure levels for cavities A, B and C (x/L=0.9) Fig. 14 Variation of OASPL with h/8 and L/8(x/L=0.9) after attenuation of all tones is due to broadband noise.This broadband noise is created mainly due to turbulentfluctuations in the shear layer. With changes in scale or L/8,the turbulent fluctuations could change. At larger cavityscales, the broadband noise is higher due to the growth andconvection of the turbulent fluctuations in the streamwisedirection. The values of OASPL obtained near the aft wall forspoilers of different h/8 are shown in Fig. 14. It can be seenthat the OASPL curves are dependent on the value of L/8.It was discussed above that a spoiler with height equal tothe boundary-layer thickness was insufficient to attenuatethe tones for cavity C. However, when the spoiler heightwas raised to three times the boundary-layer thickness, thetones were completely attenuated to the broadband level(see Fig. 13c). This shows that the spoiler heights haveto be adjusted with a change in L/8. In the literature, thesize required for a leading-edge control (hehere) has beenassumed to depend only on factors such as Mach number,L/D and L/W. Here, however, the results indicate that thecritical spoiler height,her, required for a particular cavityis dependent on the factor L/8, i.e. on the boundary-layerthickness relative to the cavity size. Hence, for a given 175 Fig. 15 The effect of sawtooth spoilers of critical height, her, on thesound pressure levels along the floor of the cavities. a Clean configu-ration. b With sawtooth spoilers employed cavity, her=f(Moo,L/D,L/8). The value of he is definedin this work as the lowest value of h that achieves a condi-tion where all the tones are completely eliminated and theOASPL is a minimum, or within ±0.25 dB of the minimumvalue. The value of h/8 for cavities A, B and C obtainedfrom the current experiments can be observed as 1, 2 and3, respectively, from Fig. 14. It can also be seen fromFig. 14 that increasing the value of h/8 beyond h/8 slightlyincreases the OASPL. This appears to be because a furtherincrease in spoiler height increases the turbulent broadbandnoise generated by the spoiler. Figure 15 shows the OASPL variation in the stream-wise direction for the three cavities in a clean configurationand using spoilers with critical height, ho For the cleancavities (Fig. 15a), it can be seen that the OASPL gener-ally has higher values near the trailing edge. This increaseis due to the amplification of the shear-layer disturbancesin the downstream direction. For a fixed boundary-layerthickness, the OASPL values increase as the cavity sizeis increased; again this is due to the greater opportunityfor downstream amplification. For the case with spoil-ers (Fig. 15b), the OASPL for each cavity is reduced to anapproximately constant broadband level. The streamwiseamplification of the disturbances is effectively suppressed. The values of h/8 obtained are plotted against the corre-sponding values of L/8 including the point (0,0) in Fig. 16.Uncertainty bars (based on 50 % of Ah) are given for thedifferent values of ho/8 because not all values of h/8 havebeen tested. Since h/8 is chosen as the lowest value of h/8 6 L/8 Fig. 16 The linear relationship between h/8 and L/8 when all tones are eliminated, only a lower limit is taken.Figure 16 shows the data points obtained with their uncer-tainties. Using the points available, a linear approximationhas been made. A linear regression curve, weighted accord-ing to the error at each point, is constructed. Due to theuncertainties, a confidence band (at 95 % confidence level)is also shown. It can be seen from Fig. 16 that the confidence bandis bound within the regression lines y =0.082× andy=0.065×. From this linear approximation, it is clear thatthe value of he is dependant only on the cavity length Lsuch that This implies that oscillations in a cavity can be suppressedas long as h/L her/L. It must be noted that althoughhoL is independent of the boundary-layer thickness, sup-pression is not achieved for a given cavity until this ratiois achieved. For h/L < her/L, cavity oscillations are stillvulnerable to changes in the ratio L/8. Once h/L=her/Loscillations are suppressed and L/8 no longer plays a role incavity unsteadiness. Previous researchers such as Shaw et al. (1988), Ger-aldes (2005) and Lawson and Barakos (2009) have pre-sented data on sawtooth spoilers similar to the one usedin this work; however, it must be noted that although theyobserved cavity tone attenuations, Shaw et al. (1988) andLawson and Barakos (2009) were unable to suppress suc-cessfully all the tones to broadband level [see, for example,Figure 11 in Shaw et al. (1988)]. The value of h/8 used in the works by Shaw et al. (1988)and Lawson and Barakos (2009) is also shown in Fig. 16.Although Shaw et al. (1988) do not specifically quoteboundary-layer thickness, there are sufficient data withinthe report to make an estimate; this has been calculated to Fig. 17 Cavity noise suppression with sawtooth spoilers (Geraldes2005) be 5.2 mm, based upon a flat plate calculation. Referring toan earlier report on the F-111 weapons bay (Clark 1979),the full-scale boundary-layer thickness at the leading edgeof the weapons bay was measured as 88.9 mm (4.4 mm at4.9 % scale) and between 8.0 and 8.4 mm at 6.67 % scale(5.9-6.2 mm at 4.9 % scale), giving confidence in the esti-mated value. It is noted that the value of h/8 used by theseresearchers falls below the value of ho/8 recommendedby the linear model. By contrast, the value of h/8 used byGeraldes (2005) is close to the linear approximation, anda good level of suppression was achieved in his studies(Fig. 17). According to the linear approximation model pre-sented here, a cavity with L/D=5 achieves suppressionwhen the height of the sawtooth spoiler used is 6.5-8.2 %of the cavity length. This is irrespective of the value of L/8faced by the cavity and indicates that sawtooth spoilerswith critical height have to be scaled according to the cav-ity dimensions and not according to the incoming bound-ary-layer thickness as previously thought. Once the criti-cal spoiler height, her, of a particular cavity is determined,then the spoiler can be scaled according to the cavitydimensions. It is presumed that the critical spoiler heightis mainly dependent on factors like spoiler profile andL/D ratio of the cavity. For the current case, a spoiler withheight equalling 6.5-8.2 % of the cavity length achievescritical height. A more accurate estimate of hoL can beestimated by testing a large number of the intermediatevalues in the h/8-OASPL curves. Shaw et al. (1988) andLawson and Barakos (2009) quote spoiler heights equalling4.7 and 3.76 % of the cavity lengths, respectively, whichare less than the critical spoiler heights required. 4 Conclusions The influence of scaling on the effectiveness of a sawtoothpassive control device for cavity tone suppression wasstudied. By using spoilers of the same h/8 ratio on cavitiesof different scales, it was found that there was significantvariation in the control effectiveness. Spoilers with h/8=l were able to suppress the tones effectively on smaller cavi-ties, but they failed at larger scales. These results showthat scaling the spoiler with respect to the boundary-layerthickness is not correct. It also shows that the factor L/8has significant impact on the effectiveness of the passivecOntrol. Different spoiler heights were tested for a given cavity(or L/8), and it was found that the spoilers were effectivein eliminating the cavity tones when the ratio of spoilerheight to onset boundary-layer thickness, h/8, reached aparticular value. After this value, any further increase inspoiler height was found to have negligible effect. Thespoiler height at which this phenomenon was achievedwas termed the critical spoiler height, hc By correlatingthe ratios, ho/8 and L/8, it was found that they are approx-imately linearly related to each other. The linear modelimplied that the ratio ho/L is constant for a cavity of givenL/D and is immune to the effects of L/8. This implies thatas long as h/L is achieved, the cavity is expected to haveno tones and exhibit the lowest OASPL possible for thatparticular L/8. Once hL for a particular cavity specifi-cation (L/D,L/W,M。o and spoiler profile) is known,then the passive control method can be scaled accordingto the cavity dimensions. If the spoiler height is less thanher, then the cavity is not immune to the changes in L/8.Finally he/L is suggested to be a more suitable criterionfor scaling a passive control device because it dependsonly on the physical cavity dimensions and not the flowconditions. Open Access This article is distributed under the terms of theCreative Commons Attribution 4.0 International License (http://crea-tivecommons.org/licenses/by/4.0/), which permits unrestricted use,distribution, and reproduction in any medium, provided you giveappropriate credit to the original author(s) and the source, provide alink to the Creative Commons license, and indicate if changes weremade. References Ashworth R (2008) DES of a cavity with spoiler. In: Peng SH, HaaseW (eds) Advances in hybrid RANS-LES modelling, notes onnumerical fluid mechanics, vol 97. Springer, Berlin,pp 162-171 Atvars K, Knowles K, Ritchie SA, Lawson NJ (2009) Experimentaland computational investigation of an ‘open’transonic cavityflow. Proc Inst Mech Eng G J Aerosp 223(4):357-368 Cattafesta LN, Song Q, Williams DR, Rowley CW, Alvi FS (2008)Active control of flow-induced cavity oscillations. Prog AerospSci 44(7-8):479-502 Christensen K (2004) The influence of peak-locking errors on tur-bulence statistics computed from PIV ensembles. Exp Fluids36:484-497 Clark R (1979) Evaluation of F-111 weapon bay aero-acoustic andweapon separation improvement techniques. Technical ReportAFFDL-TR-79-3003, Air Force Flight Dynamics Laboratory,Wright Patterson Airforce Base Geraldes P (2005) Instabilities in transonic cavity flows. PhD thesis,Cranfield University Heller H, Holmes D, Covert E (1971) Flow-induced pressure oscilla-tions in shallow cavities. J Sound Vib 18:545-553 ( Keane RD, Adrian RJ (1 9 92) Theory of cross-correlation analysis of PIV i mages. Appl S ci Res 49:191-215 ) ( Lada C, Kontis K (2011) Experimental studies of open cav i ty con-figurations at transonic speeds with f low c ontrol. J Aircr 48(2):719-724 ) ( Lawson SJ, B arakos GN (2009) Assessment of passive flow c o ntrol for transonic cavity flow using detached-eddy simulation. J Aircr46(3):1009-1029 ) ( Lusk T, C attafesta L, Ukeiley L (2012) Leading edge slot blowing onan open cavity in supersonic flow. Exp Fluids 53( 1 ):187-199 ) MacManus DG, Doran DS (2008) Passive control of transonic cavityflow. J Fluid Eng 130(6):064501-064501-4 ( Martinez MA, Cicca GMD, Iovieno M, Onorato M (2012) Control ofcavity flow o scillations by high f requency forcing. J Fluid E n g 134(5):051201-051201-11 ) ( Perng SW, Dolling DS (2001) Sup p ression of pressure oscillations in high-Mach-number, turbulent, cavity flow. J Aircr 38(2):248-256 ) Ritchie SA (2005) Non-intrusive measurements and computations oftransonic cavity flows with applications to aircraft stores release.PhD thesis, Cranfield University Ross J (2001) High speed acoustic measurements in cavities. Techni-cal Report F49620-98-1-0167, DERA Rossiter JE (1966) Wind-tunnel experiments on the flow over rec-tangular cavities at subsonic and transonic speeds. Reports andMemoranda 3438, Aeronautical Research Council ( Shaw L ( 1 989) Scale effect on the f low i nduced acoustic e nvironmentin cavities. Technical Report WRDC-TM-89-159-FIBG, WrightResearch a nd D evelopment Center, W r ight Patterson AirforceBase ) Shaw L, Clark R, Talmadge D (1988) F-111 generic weapons bayacoustic environment. J Aircr 25(2):147-153 ( Thangamani V , Knowles K, Saddington AJ (2014) The effects of scal- i ng o n high subsonic cavity flow oscillations and c ontrol. J Aircr 51(2):424-433 ) Ukeiley LS, Ponton MK, Seiner JM, Jansen B (2004) Suppression ofpressure loads in cavity flows. AIAA J 42(1):70-79 Vikramaditya NS, Kurian J (2009a) Effect of aft wall slope oncavity pressure oscillations in supersonic flows. Aeronaut J113(1143):291-300 Vikramaditya NS, Kurian J (2009b) Pressure oscillations from cavi-ties with ramp.J Aircr 47(12):2974-2984 Westerweel J (1994) Efficient detection of spurious vectors in particleimage velocimetry data. Exp Fluids 16:236-247 Westerweel J (1997) Fundamentals of digital particle image veloci-metry. Meas Sci Technol 8:1379-1392 Springer An experimental study was conducted on the effectiveness of sawtooth spoilers at suppressing acoustic tones within a rectangular cavity with a length-to-depth ratio of five and a width-to-depth ratio of two, operating at a freestream Mach number of 0.71. Whereas previous research has focussed on the ratio of spoiler height to boundary-layer thickness (h/δ), this study also considers the effect of the ratio of cavity length to boundary-layerthickness (L/δ). Using a combination of unsteady pressure measurements and particle image velocimetry, it was established that consideration of the magnitude of both parameters is important when designing passive control methods for transonic cavities. A correlation was developed which suggests that in order to suppress fully the cavity tones, a critical spoiler height, hcr, is defined such that hcr/δ = 0.065 ≤ L/δ ≤ 0.082.
关闭-
1/12
-
2/12
还剩10页未读,是否继续阅读?
继续免费阅读全文产品配置单

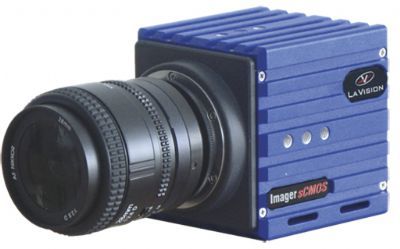

北京欧兰科技发展有限公司为您提供《空气流场,锯齿形阻流板中比例效应检测方案(粒子图像测速)》,该方案主要用于航天中比例效应检测,参考标准《暂无》,《空气流场,锯齿形阻流板中比例效应检测方案(粒子图像测速)》用到的仪器有德国LaVision PIV/PLIF粒子成像测速场仪、Imager sCMOS PIV相机、LaVision DaVis 智能成像软件平台。
我要纠错
推荐专场


CCD相机/影像CCD
更多


相关方案
 咨询
咨询