方案详情文
智能文字提取功能测试中
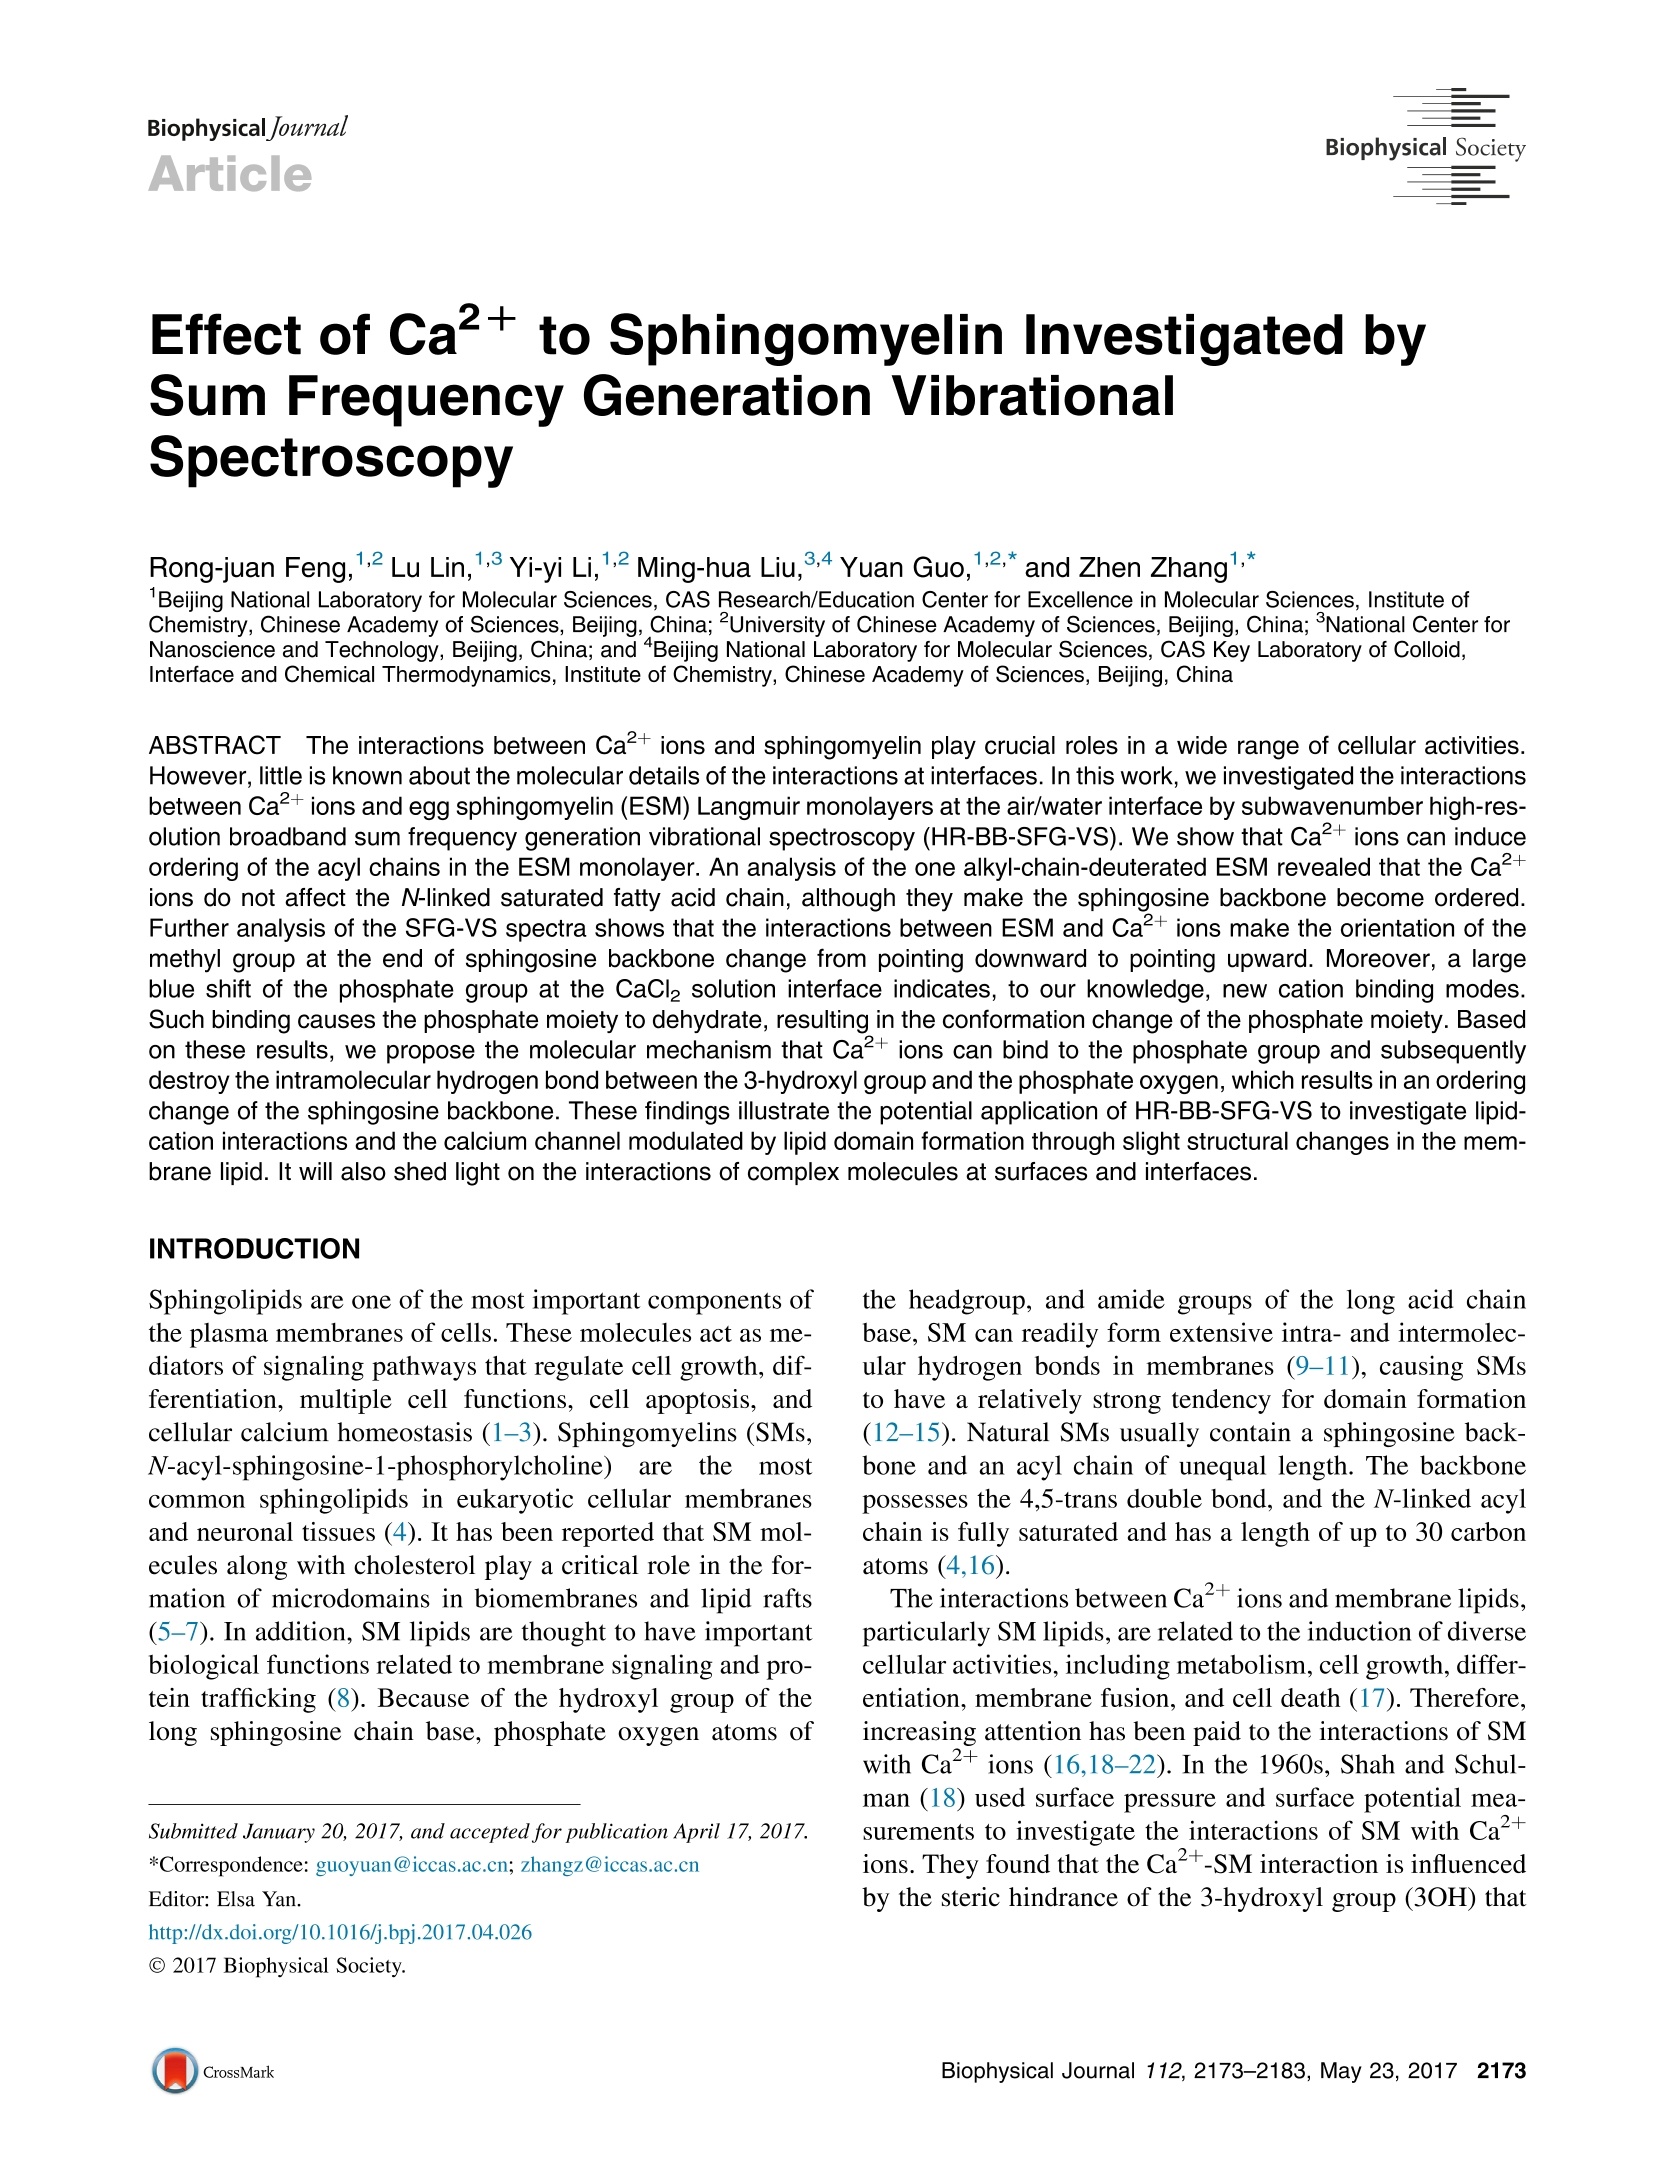
BiophysicaljournalArticleBiophysical Society Feng et al. Effect of Ca2+ to Sphingomyelin Investigated bySum Frequency Generation VibrationalSpectroscopy Rong-juan Feng,12 Lu Lin,1.3 Yi-yi Li,12 Ming-hua Liu,34 Yuan Guo,12* and Zhen Zhang1,* Beijing National Laboratory for Molecular Sciences, CAS Research/Education Center for Excellence in Molecular Sciences, Institute ofChemistry, Chinese Academy of Sciences, Beijing, China; 2University of Chinese Academy of Sciences, Beijing, China; 3National Center forNanoscience and Technology, Beijing, China; and Beijing National Laboratory for Molecular Sciences, CAS Key Laboratory of Colloid,Interface and Chemical Thermodynamics, Institute of Chemistry, Chinese Academy of Sciences, Beijing, China ABSTRACT The interactions between Ca+ions and sphingomyelin play crucial roles in a wide range of cellular activities.However, little is known about the molecular details of the interactions at interfaces. In this work, we investigated the interactionsbetween Ca2+ions and egg sphingomyelin (ESM) Langmuir monolayers at the air/water interface by subwavenumber high-res-olution broadband sum frequency generation vibrational spectroscopy (HR-BB-SFG-VS). We show that Ca+ions can induceordering of the acyl chains in the ESM monolayer. An analysis of the one alkyl-chain-deuterated ESM revealed that the Ca+ions do not affect the N-linked saturated fatty acid chain, although they make the sphingosine backbone become ordered.Further analysis of the SFG-VS spectra shows that the interactions between ESM and Ca+ions make the orientation of themethyl group at the end of sphingosine backbone change from pointing downward to pointing upward. Moreover, a largeblue shift of the phosphate group at the CaCl solution interface indicates, to our knowledge, new cation binding modes.Such binding causes the phosphate moiety to dehydrate, resulting in the conformation change of the phosphate moiety. Basedon these results, we propose the molecular mechanism that Ca+ions can bind to the phosphate group and subsequentlydestroy the intramolecular hydrogen bond between the 3-hydroxyl group and the phosphate oxygen, which results in an orderingchange of the sphingosine backbone. These findings illustrate the potential application of HR-BB-SFG-VS to investigate lipid-cation interactions and the calcium channel modulated by lipid domain formation through slight structural changes in the mem-brane lipid. It will also shed light on the interactions of complex molecules at surfaces and interfaces. Sphingolipids are one of the most important components ofthe plasma membranes of cells. These molecules act as me-diators of signaling pathways that regulate cell growth, dif-ferentiation, multiple cell functions, cell apoptosis, andcellular calcium homeostasis (1-3). Sphingomyelins (SMs,N-acyl-sphingosine-1-phosphorylcholine)areethemostcommon sphingolipids in eukaryotic cellular membranesand neuronal tissues (4). It has been reported that SM mol-ecules along with cholesterol play a critical role in the for-mation of microdomains in biomembranes and lipid rafts(5-7). In addition, SM lipids are thought to have importantbiological functions related to membrane signaling and pro-tein trafficking (8). Because of the hydroxyl group of thelong sphingosine chain base, phosphate oxygen atoms of ( Submitted January 20, 2017, and accepted for publication April 17,2017. ) C 2017 Biophysical Society. the headgroup, and amide groups of the long acid chainbase, SM can readily form extensive intra- and intermolec-ular hydrogen bonds in membranes (9-11), causing SMsto have a relatively strong tendency for domain formation(12-15).Natural SMs usually contain a sphingosine back-bone and an acyl chain of unequal length. The backbonepossesses the 4,5-trans double bond, and the N-linked acylchain is fully saturated and has a length of up to 30 carbonatoms (4,16). The interactions between Caions and membrane lipids,particularly SM lipids, are related to the induction of diversecellular activities, including metabolism, cell growth, differ-entiation, membrane fusion, and cell death (17). Therefore,increasing attention has been paid to the interactions of SMwith Caions (16,18-22). In the 1960s, Shah and Schul-man (18) used surface pressure and surface potential mea-surements to investigate the interactions of SM with Caions. They found that the Ca+-SM interaction is influencedby the steric hindrance of the 3-hydroxyl group (3OH) that is vicinal to the phosphate group. Several studies of the in-teractions of Ca+ions with SM bilayers performed byNMR and Fourier transform (FT)-Raman spectroscopyhave reported that Caions mainly bind to the phosphategroup in the headgroup and do not change the conformationof the O-C-C-N backbone (19-21). Rujoi et al. (16)investigated the effect of Caions on SM structures usingFT infrared (FT-IR) spectroscopy and concluded that Ca什ions not only bind to and/or dehydrate the phosphate moi-eties but they also strengthen the intermolecular hydrogenbonds. Sugimori et al. (23) used density functional theorycalculations to investigate the interactions, and they showedthat Ca+ions prefer to interact with the choline moiety nearthe phosphate group. However, previous studies havemainly focused on the interactions of Ca+ions with theheadgroup,and the conformationalaand orientationalchanges of the two hydrophobic chains have not been inves-tigated. It is critical to investigate the possible changes in theconformation and orientation of the saturated fatty acid andsphingosine chains because these changes are related to thelipid-ion channel and the functions of membranes (24-30). The sum frequency generation (SFG) technique has beenshown to be a powerful tool because it is sensitive to thestructure, structural variations, and the complex local envi-ronment at the interface, and it has been used to determinethe functional group orientation and conformation structureof lipid monolayers at interfaces (26,31-33). To better un-derstand the molecular structure at interfaces, different po-larization conditions have also been used to identify theorientation of molecules at interfaces (34,35). The principleof the SFG experiments is described briefly in the Support-ing Materials and Methods. Although there have been manydevelopments in the instrumentation and interpretation ofSFG-vibrational spectroscopy (SFG-VS) data, the limita-tions of its application to different complex molecular sys- tems, such as bimolecular surfaces and interfaces, stillrestrict the ability to interpret SFG-VS data (36-38). Toovercome these limitations, high-resolution broadbandSFG-VS (HR-BB-SFG-VS) with subwavenumber resolu-tion (0.4 cm-) and a large signal-to-noise ratio (SNR)has been developed (39). In addition to the surface sensi-tivity, HR-BB-SFG-VS can obtain unambiguous interferingfine spectral features and nearly intrinsic spectral lineshapesof the molecular vibrational modes because of the high res-olution and large SNR (40,41). To elucidate the effect of Ca2+ions on the structures ofthe two hydrophobic chains, we used a combination of sur-face pressure measurements and HR-BB-SFG-VS to inves-tigate the structures of egg SM (ESM, as shown in Fig. 1)lipid monolayers at pure water and 2 M CaCl2 aqueous So-lution interfaces. Such studies have rarely been carried out,except for the study of SMs interact with cholesterol at theair/solid interface by Weeraman et al.(33).The concentra-tion of 2 M CaCl2 in the solution is relevant in the biologicalstudy and biological systems. For example, 2 MCaCl, solu-tions can be used during the cell competence in the labora-tory(42). In addition, the study of high concentration salteffect is a common method to understand the essence ofthe ion-lipids interactions (26). To observe the subtle effectof Caions on the organization of the ESM monolayers, arelatively high Ca+ concentration (2 M) was used in thisstudy rather than <0.4 M, as used in previous studies(26,31,43). In this article, we reported that Ca+ions can bind to thephosphate group and subsequently destroy the intramolecu-lar hydrogen bonds between the 3OH and the phosphateoxygen, which results in the ordering change of the sphingo-sine backbone and the change of orientation of the methylgroup at the end of sphingosine backbone from downwardto upward. FIGURE 1 Given are molecular structures of (a)ESM and (b) ESM-d31. Both ESM and ESM-d31consist of three parts: two hydrophobic acyl chains,one hydrophilic polar headgroup, and an interfaceregion. To see this figure in color, go online. MATERIALS AND METHODS Materials Chicken ESM and chain-deuterated ESM (ESM-d31) were purchased fromAvanti Polar Lipids (Alabaster, AL) and used as received. Chloroform andmethanol (HPLC grade) were purchased from Sigma-Aldrich (St. Louis,MO). ESM was dissolved in a methanol-chloroform (5:1, v/v) mixture tomake a 0.5 mM solution. The stock solutions of SM were stored in thedark at -20°C and warmed to ambient temperature before being used.The molecular structures of ESM and ESM-d31 are shown in Fig. 1. Beforeits use, calcium chloride dehydrate (ACS reagent grade, ≥99%; AlfaAesar; Haverhill, MA) was baked at 550C for 5 h under argon protec-tion conditions to remove potential organic contaminants. The bakedcalcium chloride was then used to prepare a stock solution by dissolvingin pure water (18.2 MQ·cm, pH 5.6). No C-H stretching features(2800-3000 cm-) of organic contaminant were observed in the SFG-VSspectrum of the calcium chloride stock solution following a previouslypublished procedure (44). Surface pressure-area isotherm The surface pressure-area (n-A) compression isotherms were measured by acomputer-controlled Langmuir trough (Atotal =273 cm;KSV Mini Trough;Biolin Scientific, Espoo,Finland). The trough was made of Teflon and equip-ped with two compression barriers made of Delrin (DuPont, Wilmington,DE). The surface pressure of the Langmuir monolayer was monitored by aWilhelmy plate made of platinum and flamed with a Bunsen burner beforeuse. The trough and barriers were rinsed with ethanol and Milliporewater(Millipore, Billerica, MA) several times before the measurements. Thewhole trough was enclosed in a homebuilt Plexiglas protective box to elim-inate dust and other possible airborne contaminants. Before spreading theSM solution on the pure water or CaCl2 aqueous solution, the aqueous sur-face was swept by the barriers to ensure surface cleanliness, and the cleanli-ness was confirmed when the final surface pressure was <0.2 mN/m. Whenpreparing the Langmuir monolayers, an appropriate volume of the SM solu-tion was spread on the water or CaCl2 aqueous surface with a microsyringe ina dropwise manner. After waiting for ~15 min to allow the solvent to evap-orate, the films were compressed with a constant rate of 10 mm/min. Duringthis process, the surface pressures and the mean molecular areas were contin-uously monitored by compressing the barriers. Sub-1 cm-1 resolution broadband SFG-VS A recently developed HR-BB-SFG-VS with subwavenumber spectral reso-lution can provide an accurate spectral lineshape and allow direct probingof the molecular interactions by SFG-VS spectra (37,39). The HR-BB-SFG-VS spectrometer used in this study was set up by our group. It consistsof two sets of synchronized Ti:sapphire oscillators/amplifiers. One is aTi:sapphire regenerative amplifier (Spitfire Ace;Spectra-Physics, MountainView, CA) seeded with an oscillator (Mai Tai; Spectra-Physics) andpumped with two diode-pumped green lasers (Empower; Spectra-Physics).The amplifier is used to generate laser pulses centered at 800 nm with a full-width at half-maximum (FWHM) of 30 nm and a pulse duration of 35 fs.The amplifier produces ~7.5 mJ energy per pulse with a repetition rateof 1 kHz. Two commercial optical parametric amplifiers (TOPAS-Prime;Spectra-Physics) are pumped with 2.5 and 5.0 mJ of the amplified800 nm beam, respectively. For one TOPAS-Prime amplifier, the signaland idler are used in a difference frequency mixing process on a silver gal-lium disulfide (AgGaS2) crystal, resulting in 10 uJ IR pulses that are tunablearound a central wavelength of ~3440 nm (~2900 cm-) with a FWHM of400 cm,and the other 5 mJ TOPAS-Prime amplifier results in a 8 uJ pulsethat is tunable around a central wavelength of ~9540 nm (~1050 cm)with a FWHM of 300 cm, which are used as IR pulses. The other synchronized picosecond laser system is described below. Themaster pulse train originates from a 35 fs oscillator (Mai Tai; Spectra-Phys-ics) and its repetition rate (84 MHz) is used as the frequency referencefor stabilization of a 50 ps oscillator (Tsunami; Spectra-Physics). The50 ps oscillator is pumped with a diode-pumped green laser (Empower;Spectra-Physics). The amplifer (Spitfire Ace; Spectra-Physics) is used togenerate laser pulses centered at 800 nm with a pulse duration of 50 ps,which are used as visible pulses. It produces ~2.0 mJ energy per pulsewith a repetition rate of 1 kHz. The stability and pulse width of the 50 pspulse are monitored with a homebuilt autocorrelator throughout the wholeexperiment. The manually synchrolocked controls provide a few nanosec-onds of continuous relative time delay between the slave and the masterpulses. The infrared and visible laser beam temporally and spatially overlap at theair/liquid interfaces, aligning in a copropagating geometry with an IR incidentangle of 55°and a visible incident angle of 63° relative to the surface normal.The typical acquisition time of a single SFG-VS spectrum in a specific polar-ization combination is 30 min using a monochromator (model No. SP2750;750 mm, 1800 lines/mm grating; Princeton Instruments, Trenton, NJ) andelectron-multiplied charge-coupled device camera cooled at -70°C (ProEMEM-charge-coupled device camera; 1600 ×400; Princeton Instruments).With all the instruments, the spectral resolution of the sub-1 cm-HR-BBSFG-VS spectrometer was characterized as ~0.4cm-in our setup. The SFG-VS spectra were recorded in the C-H stretching region (2800-3000 cm) and P-O stretching region (1000-1200 cm-) in the ssp andppp polarization combinations (SFG, visible, and the IR laser beams, respec-tively). Each SFG-VS spectrum was processed by subtracting the backgroundand blocking the IR pulses, and then normalized to the SFG-VS signal of thickz-cut quartz (12.5×12.5×5 mm) in the 2800-3000 cm- range and aGaAs(110) wafer in the 1000-1200 cm- range to remove spectral distortioncaused by the energy profile of the IR pulse. To minimize the laser heating ef-fects on the spectrum of the ESM monolayer at the interface, a Teflon (Chemo-urs,Wilmington, DE) dish was placed on a rotation stage (model No. PR50CC;Newport, Stratford, CT) operated by a motion controller (model No. XPS-Q4;Newport) with a fixed rate of 1200°/s. All of the measurements were performedat controlled room temperature (22.0±0.5°C) and humidity (~20%). RESULTS AND DISCUSSION Surface pressure-area isotherm of ESM FIGURE 2Given here are the surface pressure (mN/m)-area (A²) iso-therms of ESM Langmuir monolayers at 24°C at the pure water (red solidline) and CaCl2 solution (blue dashed line) interfaces: G, gas phase; LE,liquid-expanded phase;LC, liquid-condensed phase; and LE-LC, the coex-istence of LE and LC. After adding Ca+ions into the subphase, the ESMisotherm shifts to higher MMA, indicating that Caions bind to the phos-phate group of ESM. The vertical arrows and dashed lines denote thesurface area in the HR-BB-SFG-VS measurements in subsequent experi-ments. The isotherm curves shown here are the averages of three measure-ments. To see this figure in color, go online. Ordering effect of Ca2+ ions on the acyl chains To obtain the effect of Ca+ions on the conformation of thehydrocarbon chains, HR-BB-SFG-VS spectra were recordedin the C-H stretch region. The spectra were taken at twodifferent molecule areas: 68 Aper molecule in the LE-LC phase and 52 A2 per molecule in the LC phase. Fig. 3shows the HR-BB-SFG-VS spectra of ESM monolayers atthe pure water and 2 M CaCl2 solution interfaces under sspand ppp polarization combinations, in which nine vibrationalmodes can be observed. All the spectra are fitted using Lor-entzian lineshape functions; the detailed description can befound in the Supporting Materials and Methods. The HR-BB-SFG-VS spectra identify a number of additional peaks,for example, more CH2 ss vibration modes, which areobscuredin thelower resolutionnSFG-VS spectra(41,49,50). The comparisons of HR-BB-SFG-VS (spectralresolution 0.4 cm) and the EKSPLA picosecond scanningsystem (spectral resolution 6 cm) are shown in Fig. S3. The peaks centered at ~2874, 2926,2942,2953, and2963 cm-can be assigned to CHs symmetric stretching(CH3 ss), CH2 Fermi resonance, CH Fermi resonance,CH2 ss in the headgroup, and CH asymmetric stretching(CH as), respectively (26-28,30,32,33,51-56). The exactassignments of all of the peaks are beyond the scope ofthis article. The peaks centered at 2840-2860 cmsho dbelong to the symmetric stretching mode of CH2 groups.The fitting results are listed in Table S1, and the fittedpeak positions are labeled with vertical dashed lines in 3 ii lll ESM68A IIppp Vwater' water 2M CaCl 2M CaC1 ESM 52A2 lCH,-FRI 1JCH,-SS 'CH,-FR CH,-ASCH,-SS CH,-SS CH,CH,-AS I CH,-S Wavenumber(cm) FIGURE 3 Shown here are HR-BB-SFG-VS spectra of ESM monolayerfilms on the pure water and CaCl2 solution subphases at (a) 68 A /moleculeand (b) 52 A’/molecule under ssp and ppp polarization. The solid lines arethe global fitting curves using the Lorentzian lineshape, and the verticaldashed lines denote the peak positions from the fitting. To see this figurein color, go online. Fig. 3 a. As recently reported, to our knowledge the newCH2 spectral features observed here overlap with CH3-SS,CH3-as, or Fermi resonance in common BB-SFG-VS, butthey can be well resolved by, to our knowledge, the newHR-BB-SFG-VS technique (49). It is worth noting that, inprinciple, each ESM molecule has an even number of CHgroups and they should pairwise cancel the SFG-VS signalin the straight chain, but this is not the case in the real SFG-VS measurements here. This may be because multiplemicroscopic structures with gauche defects can contributeto the CH SFG-VS spectrum. The CH2 groups connectedto the terminal CH3 group and the CH2 groups linked tothe serine group of the headgroup also contribute to theCH2 SFG-VS spectrum. In Fig. 3, the ratio of the intensities of the CH ss(~2874 cm-) and CHz ss (~2850 cm-) modes for52 A /molecule is larger than that for 68 A/molecule, indi-cating that the conformation of the ESM acyl chains for 52 A /molecule is more ordered, which is in agreement withprevious studies of lipids (26-28,53,54,57-59). Comparedwith the spectra at the pure water interface, the CH3 ss peaksin the spectra at the 2 M CaCl2 solution interface are stron-ger, whereas the CH2 ss peaks become slightly weaker.These results indicate that the acyl chains of ESM are alsomore ordered at the 2 M CaCl2 solution interface underthe same MMA. As shown in Fig. 1, ESM has two hydrophobic acylchains-one is sphingosine backbone, and the other isN-linked fully saturated acyl chain. It is crucial to under-stand which acyl chain plays the main role in determiningthe lipid-ion interactions. Although previous studies havesuggested that the N-linked acyl chain is important for deter-mining the interaction of SM with cholesterol becauseintermolecular hydrogen bonds can be formed betweencholesterol and the N-linked acyl chain (60-62), there isno direct research on the interaction between the twodifferent acyl chains of ESM and Caions. To investigatehow the two hydrophobic acyl chains interact with Caions, SFG-VS spectra of ESM-d31 (the structure shown inFig. 1 b) were collected in both the C-H and C-D regions.The detailed effects of the two hydrophobic acyl chains willbe discussed below. Effect of Ca2+ions on the two acyl chains Fig. 4 shows the ssp spectra of ESM-d31 monolayers withdifferent MMA on water and the CaCl solution in theC-D stretching region. The ssp peaks at ~2068,~2104,~2120, and 2219 cm- have been previously assigned tothe CD3 symmetric stretch (CD3 ss), the CD2 asymmetricstretch (CD2 as),CD2 Fermi resonance, and the CD3asym-metric stretch (CD3 as), respectively (29,57,58). The peak at~2068 cmcan also be assigned to CD3 ss, similar to whatwas observed in the C-H stretching region. In Fig.4, there isan extra peak at ~2056 cmin the ssp spectra. We do notassign this peak here because of the low SNR, but this willnot change any of the conclusions of this study. It is worthnoting that the CD2 Fermi resonance spectral shift inFig. 4 has not been observed; instead, a slight intensitychange of the CD2 Fermi resonance has been observed,which may result from the slightly different molecularvibrational coupling of the CD2 groups of the N-linkedacyl chain in the presence of Ca+and in the absence ofCa+. As shown in Fig. 4, a and b, apart from the CD Fermiresonance, the ssp spectra of ESM-d31 on the water andCaCl2 solution subphases are almost identical in the C-Dstretching region, indicating that Ca+ions have a negli-gible effect on the N-linked fully saturated acyl chain ofESM. This indicates the CH2 groups in the N-linked fattyacid acyl chain are well ordered and adopt the all-transconformation on the water subphase, and the addition ofCaions does not affect the highly ordered N-linked alkylchain. 0.15 ESM-d31 68A SSp water 2M CaCl, 0.10 0.05 AAA 0.00 0.24 0.20 ESM-d3i 52A 0.16· CD-SS I | CD,-FR CD-AS 0.12- CD,-AS| ? 0.08 0.04. 0.00 Wavenumber(cm) FIGURE 4Shown here are the HR-BB-SFG-VS ssp spectra of ESM-d31monolayer films on the pure water and 2 M CaCl2 solution subphases at (a)the 68 A/molecule (solid lines are fitting results using Lorentzian lineshapefunctions, the fitting parameters are listed in Table S2) and (b) the 52 A2/molecule in the C-D stretching region. Compared with the spectrum onthe water subphase, the spectrum on the 2 M CaCl2 solution subphase isalmost the same, except for the CD2 Fermi resonance. The solid lines arethe global fitting curves using the Lorentzian lineshape, and the verticaldashed lines denote the peak positions from the fitting. To see this figurein color, go online. In contrast to the C-D stretching region, the SFG-VSspectra of the ESM-d31 monolayers on the pure waterand CaCl2 solution subphases show a significant differencein the C-H stretching region, as shown in Fig. 5. For thesame MMA, the CH ss intensity of the ESM-d31 monolayeron the CaCl2 solution subphase is larger than that on the wa-ter subphase, similar to that of ESM monolayers upon addi-tion of Ca+ ions into the subphase. Combined with theSFG-VS spectra of ESM-d31 in the C-D stretching region,it can be inferred that Caions only influence the confor-mation of the sphingosine backbone. The different effectsof Caions on the two chains originates from the intramo-lecular hydrogen bonding between 3OH and the phosphateoxygen in the sphingosine backbone (23,63-66). The intra-molecular hydrogen bonding, along with the rigid C4-C5trans double bond, makes the sphingosine backbone tilt ata large angle with respect to the surface normal (61). T11ESM-d31 68A 11 ssp water 1 1 111 1pppwater2M CaCL 2M CaCl,1 11 11 11 SS CH,-SSI 1ESM-d3152A 11 11 11CH,-SsCH,-SSI CH,-FRTCH,-SSi1 CH,-FRCH,-AS’ICH,-SS 1 11 CH,-AS 2 Wavenumber (cm) FIGURE 5 Shown here are the HR-BB-VSFG ssp and ppp spectra ofESM-d31 monolayers on the pure water and 2 M CaCl2 solution subphaseswith (a) 68 and (b)52 A/molecule in the C-H stretching region. The over-all spectral amplitudes on the CaCl2 solution subphase are larger than thaton the water subphase. The solid lines are the global fitting curves using theLorentzian lineshape. To see this figure in color, go online. Therefore, ESM molecules occupy a large molecule area at the air/water interface. At the CaCl2 solution interface, Caions can easily bind to the phosphate moiety and imbed be-tween 3OH and the phosphate oxygen because of their highbinding affinities (23,67-69). As a result, the intramolecularhydrogen bonds are destroyed and the sphingosine back-bones tilt parallel to the surface normal, leading to a smallermolecular area. This is in agreement with previWitous mo-lecular dynamics simulations that showed that Ca+ionsremarkably reduce the palmitoyloleoylphosphatidylglycerolmolecule area from ~68.2 to~50.6 A²(67). In addition, thesphingosine backbones become more ordered after tiltingparallel to the surface normal, so the CH ss peak intensitybecomes stronger in the presence of Caions. In the case ofthe ESM monolayer with the 68 A /molecule, there aremore intramolecular hydrogen bonds compared with the52 A /molecule. As a consequence, upon adding Ca+ions, the increase of the CH3 ss peak intensity is more pro-nounced in the ESM monolayer with the 68 A /molecule. Tothe best of our knowledge, this is the first study investigatingthe influence of Ca+ions on the acyl chains of ESM withHR-BB-SFG-VS measurements. Reverse orientation of the terminal methyl groupwith Ca2+ ion addition As discussed above, in the spectra of ESM monolayers, theCH3 ss peak contains contributions from both the N-linkedacyl chain and the sphingosine backbone. In contrast, inthe spectra of the ESM-d31 monolayers, the CH ss peaksolely originates from the sphingosine backbone. Bycomparing Figs. 4 and 5, we can easily conclude that theN-linked acyl chain remains unaltered and the sphingosinebackbone becomes more ordered upon addition of Caions. With this information, if we assume that the changesin the intensities (AI) of the CH3 ss peaks from the sphingo-sine backbone are the same for both the ESM and ESM-d31monolayers by adding Ca, then where R represents the ratio of the CH3 peak intensity at theCaCl2 solution interface to that at the pure water interface.However, comparison of Fig. 5 with Fig.3 shows that the ra-tio is actually smaller for the ESM-d31 monolayer for bothmolecule areas. This inconsistency can be interpreted byassuming that the terminal methyl groups in the sphingosinebackbone have opposite orientations on the water and CaCl2solution subphases, the detailed analysis are discussed below. It is known that the CH3 ss peak intensity is proportionalto the square of the effective susceptibility of the methylgroups, x. For ESM monolayers on the water and CaCl2solution subphases, where and x are the effective susceptibilities of the terminal methyl groups in the N-linked acyl chains and thesphingosine backbones, respectively. Similarly, for ESM-d31 monolayers on the water and CaCl2 solution subphases, Denoting a=Xs,Ho/xN and b=xs.cacl/xn, the ratio ofthe CH3 ss intensities of the ESM and ESM-d31 monolayerson the different subphases can be expressed as According to the fitting results listed in Table S1 and TableS3, for the monolayers at the 68 A /molecule, As mentioned above, the N-linked acyl chains are wellordered regardless of the subphase, so it is reasonable toassume that|a|<1 and|b|<1. By solving Eq. 4, we obtaineda=-0.45 andb=0.75. To explain the meaning of the abovevalues, we modeled the Xssp versus 0-curves for the methylgroup (see Fig. S2) using previously reported equations(34,70,71). Based on the observations in Fig. S2, the negativevalue of a indicates that the two terminal methyl groups in theN-linked acyl chain and the sphingosine backbone are oppo-sitely oriented on the water subphase, whereas the positivevalue of b indicates that the orientations of the two terminalmethyl groups on CaCl solution subphase are the same.Because the N-linked acyl chains are well-ordered and themethyl groups in the N-linked acyl chains always point up-ward, we suggest that the terminal methyl groups in the sphin-gosine backbones point downward on the water subphase andturn upward after adding Ca+ions into the subphase. Thedownward orientation of the terminal methyl groups in thesphingosine backbones can be attributed to the intramolecularhydrogen bonds and the gauche defects of the CH2 group con-nected to the terminal CHs group (72). After adding Caionsinto the subphase, destruction of the intramolecular hydrogenbonds and the rigidity of the double bond in the sphingosinebackbone make the terminal methyl groups change theirorientation to pointing upward. nprinciple, phase-sensitivemeasurements or)r tthemaximum entropy method can be used to obtain directly the phase information. In our experiment, however, it isdifficult to finish. Because the SFG signal of CH3 originatesfrom the sum of the contribution of the CH3 group located atthe same alky chains for ESM or ESM-d31, it is impossibleto distinguish the partially reversed CH group with phase-sensitive measurements or the maximum entropy method. Binding of Ca+ions to P-0 As discussed in Ordering Effect of CaIons on the AcylChains, the -PO-2 group and 3OH in the sphingosine backbone can form an intramolecular hydrogen bond. After addingCa2+,the intramolecular hydrogen bond is completely disrup-ted because the strong proton acceptor of the phosphate groupof ESM will chelate with Ca+. More evidence can be foundin the P-O vibrational modes in the SFG-VS spectra. Fig. 6 shows the P-O stretching region of SFG-VSspectra of ESM monolayers at the pure water and 2 MCaCl solution interfaces at 52 A /molecule under the ssppolarization combination. Three peaks at ~1051,~1080,and ~1091 cm- are observed in the spectrum of theESM monolayer at the pure water interface. There is nodoubt that the peak at ~1051 cmcan be assigned to theP-O ester stretch (73,74). The peak at ~1080 cm- hasnot been previously identified in conventional SFG-VSspectra with lower resolution (31,73). Moreover, it is wellknown that the red shift of the symmetric stretch of-PO2 (-PO-2 SS) can be observed owing to the loss ofelectron density of the P-O bonds during the hydrationprocess. The peak at~1080 cm- exhibits a larger red shiftrelative to -PO-2 ss than that of the peak at ~1091 cm,so it canbe assigned to thee symmetric stretch of-PO-2...HO. The peak at ~1091 cm-ccan be assigned Wavenumber(cm) FIGURE 6sShown here are the HR-BB-SFG-VSspectra of the ESM monolayers in pure water (redcircle, higher intensity spectrum) and 2 M CaClsolution (blue triangle, lower intensity spectrum)subphases in the P-O stretching region. Thesolid lines are the global fitting curves using theLorentzian lineshape. To see this figure in color,go online. to the symmetric stretch of -PO 2...3OH, which is anintramolecular hydrogen bond between -PO 2 in the head-group and 3OH in the sphingosine backbone. This hydrationchange-induced frequency redshift has also been investi-gated by theoretical calculations (75). shifts to the blue; more details can be found in Fig. S4.Here we will not focus on the concentration-dependent anal-ysis. Further studies are underway (R.-j.F., Y.-y.L, L.-L.Lu, G.-C. Han, Y.-P. Yi, Y.G., and Z.Z., unpublisheddata). Considering all of the above information, the peakobserved at~1104 cmcan be assigned to the partially de-hydrated -PO~2 ss (16,30,73,79-81). The peaks at ~1120 and ~1131 cm- in the spectrum ofESM at the 2 M CaCl2 interface (Fig.6) only present at theCaCl2 solution interface, thus those peaks can only be as-signed to the Ca+-ESM complex. One possible interpreta-tion of the two peaks is based on symmetry splitting(82,83). That is, when the conformational freedom of thephosphate group is reduced by Caions binding to the nega-tively charged oxygen atoms of the phosphate moiety, theeffective symmetry of the phosphate group is also loweredbecause of the intermolecular interactions (83). This reduc-tion of symmetry may result in splitting of the degeneratemodes by introduction of new bands (84). Moreover, theSFG-VS intensity of the -PO 2 symmetric stretch at theCaCl2 solution interface is lower than that at the pure waterinterface. Such an intensity decrease may originate fromthe more tilted orientation of the P-N dipole in the headgroupwith respect to the monolayer, which has been described intheoretical and experimental studies (31,69,79,85-87). With all of the detailed information described above, theHR-BB-SFG-VS spectra of ESM at the pure water andCaCl2 solution interfaces in the P-O stretching regionconfirm that Ca+ ions bond to the phosphate moiety.Such binding induces a large blue shift (40 cm-) of-PO-2, and two new features appear at ~1120 and~1131 cm-from the ESM-Ca+ complex. Molecular mechanism of Ca2+ interactingwith ESM Based on the above discussion, a full molecular mechanismfor Ca+ interacting with ESM is proposed (Fig. 7). The FIGURE 7 Given here is the molecular mecha-nism of Caions interacting with the headgroupand hydrocarbon chains of ESM. After addingCa+ions to the subphase, the headgroup first de-hydrates and then reorients, the sphingosine back-bones become more ordered, and the terminalmethyl groups in the backbones change their orien-tation from pointing downward to pointing up-ward. To see this figure in color, go online. binding of Ca+to the phosphate moiety first dehydrates theheadgroup and then induces reorientation of the polar head-groups. In this case, the intramolecular hydrogen bonds be-tween the phosphate moiety and 3OH in the sphingosinebackbones are destroyed, and the sphingosine backbonesbecome more ordered. These processes finally make the ter-minal methyl groups in the backbones change their orienta-tion from pointing downward to pointing upward. CONCLUSIONS HR-BB-SFG-VS is used to investigate ESM monolayers atair/aqueous interfaces. The results reveal a molecular mech-anism of Ca+interacting with ESM. Caions first bind tothe phosphate group and then induce dehydration of thephosphate group and reorientation of the polar headgroups.Subsequently, intramolecular hydrogen bonds between thephosphate moiety and 3OH in the sphingosine backbonesare destroyed in the presence of Ca+ions. The sphingosinebackbones become more ordered and the terminal methylgroups in the backbones change their orientation from point-ing downward to pointing upward. In contrast, the confor-mation of the N-linked acyl chain remains unaltered uponaddition of Ca2+ions in the subphase. This study providesbasic information for studying SM membranes at the molec-ular level. Furthermore, it also shows the applicability ofHR-BB-SFG-VSsIto study complicated lipidAsystems.Further studies are underway to investigate the effect ofCa²+ on ESM by molecular dynamics simulations. SUPPORTING MATERIAL Supporting Materials and Methods,four figures, and three tables are avail-ableathttp://www.biophysj.org/biophysj/supplemental/S0006-3495(17)30442-3. AUTHOR CONTRIBUTIONS Z.Z. and Y.G. designed the research project. R.-j.F. and Y.-y.L. performedthe experiments. Z.Z., Y.G., R.-j.F., and L.L. analyzed the data. All authorsdiscussed the results and commented on the manuscript. ACKNOWLEDGMENTS We thank Dr. Yuki Nagata and Prof. Yuanping Yi for thoughtfuldiscussions. Y.G. is grateful for funding from the Natural Science Foundation of China(NSFC) (grant No. 21227802) and Ministry of Science and Technology ofChina (MOST) (grant No. 2013CB834504). Z.Z. is grateful for fundingfrom the Natural Science Foundation of China (NSFC) (grant No.21503235) and the Institute of Chemistry, Chinese Academy of Sciences(ICCAS), for start-up funding to support this work. SUPPORTING CITATIONS References (88-97) appear in the Supporting Material REFERENCES 1. Hannun, Y. A., and L. M. Obeid. 1995. Ceramide: an intracellular. signal for apoptosis. Trends Biochem. Sci.20:73-77. 2. Jayadev, S., B. Liu,..., Y. A. Hannun. 1995. Role for ceramide in cellcycle arrest. J. Biol. Chem. 270:2047-2052. 3.SSweeney, E. A., J. Inokuchi, and Y. Igarashi. 1998. Inhibition of sphin-golipid induced apoptosis by caspase inhibitors indicates that sphingo-sine acts in an earlier part of the apoptotic pathway than ceramide.FEBSLett. 425:61-65. 4. FFilippov, A. V., M. A. Rudakova, and B. V. Munavirov. 2010. Lateraldiffusion in sphingomyelin bilayers. Magn. Reson. Chem. 48:945-950. 5.IHarder, T., and K. Simons. 1997.Caveolae, DIGs, and the dynamicsof sphingolipid-cholesterol microdomains. Curr Opin. Cell Biol.9:534-542. 6. Balijepalli, R. C., and T. J. Kamp.2008.Caveolae, ion channels andcardiac arrhythmias. Prog. Biophys. Mol. Biol. 98:149-160. 7. Baumgart, T, S. T. Hess, and W. W. Webb. 2003. Imaging coexistingfluid domains in biomembrane models coupling curvature and line ten-sion. Nature. 425:821-824. ( 8 . A n do,J., M. K i noshita,. . . , M . Sodeoka . 2 0 15 . S p h i ngomyeli n di s t r i- b ut i on i n l ipid r afts of artifici a l mono l ayer membranes visualized b y Raman microscop y. P roc. N atl. A cad.S c i. U SA. 1 1 2 : 4 5 58 45 6 3. ) 9.M1aulik, P. R., and G. G. Shipley. 1996. N-palmitoyl sphingomyelin bi-layers: structure and interactions with cholesterol and dipalmitoylphos-phatidylcholine. Biochemistry. 35:8025-8034. 10. Petrache, H. I., S. Tristram-Nagle, and J. F. Nagle. 1998. Fluid phasestructure of EPC and DMPC bilayers. Chem. Phys. Lipids. 95:83-94. 11. Niemela, P., M. T. Hyvonen, and I. Vattulainen. 2004. Structure and dy-namics of sphingomyelin bilayer: insight gained through systematiccomparison to phosphatidylcholine. Biophys. J. 87:2976-2989. 12. Matsumori, N., T. Yamaguchi, ..., M. Murata. 2015.Orientation andorder of the amide group of sphingomyelin in bilayers determined bysolid-state NMR. Biophys. J. 108:2816-2824. 13. Fugler, L., S. Clejan, and R. Bittman. 1985. Movement of cholesterolbetween vesicles prepared with different phospholipids or sizes.J. Biol. Chem. 260:4098-4102. 14. Lund-Katz, S., H. M. Laboda, ..., M. C. Phillips. 1988. Influence ofmolecular packing and phospholipid type on rates of cholesterol ex-change. Biochemistry. 27:3416-3423. 15Y.eagle, P. L., and J. E. Young. 1986. Factors contributing to the distri-bution of cholesterol among phospholipid vesicles. J. Biol. Chem.261:8175-8181. 16. Rujoi,M.,D. Borchman,...,M. C. Yappert. 2002. Interactions of Cawith sphingomyelin and dihydrosphingomyelin. Biophys. J. 82:3096-3104. 17. Kooijman,E. E., D. Vaknin,..., S. Kumar. 2009. Structure ofceramide-1-phosphate at the air-water solution interface in the absence and pres-ence of Ca+. Biophys.J. 96:2204-2215. 18.9Shah,D. O.. and J. H. Schulman. 1967. Interaction of calcium ions withlecithin and sphingomyelin monolayers. Lipids. 2:21-27. 19. Y1uan, C. B., D. Q. Zhao,..., F. Huang. 1995. Effects of metal-ions onthe conformation of polar headgroup of sphingomyelin bilayer. Chin.Sci. Bull.40:820-823. 20. Zhao, B., C. B. Yuan,..., F. Huang. 1995. Ft-Raman spectroscopicstudies on the interaction of metal-ions with sphingomyelin bilayer.Chem. Res. Chin. Univ. 11:117-121. 21. Yuan, C. B., D. Q. Zhao,..., J. Z. Ni. 1996.NMR and FT-Ramanstudies on the interaction of lanthanide ions with sphingomyelin bila-yers. Spectrosc. Lett. 29:841-849. 22. Tlang, D., D. Borchman, ...,V. Rasi. 2003. Influence of age, diabetes,and cataract on calcium, lipid-calcium, and protein-calcium relation-ships in human lenses. Invest. Ophthalmol.Vis. Sci.44:2059-2066. 23. Sugimori, K., H. Kawabe,..., K. Nishikawa. 2008. A DFT study ofinfrared spectrum of sphingomyelin lipid molecule with calciumcation. Int. J. Quantum Chem. 108:2935-2942. 24. Can, S. Z., C. F. Chang, and R. A. Walker. 2008. Spontaneous forma-tion of DPPC monolayers at aqueous/vapor interfaces and the impact ofcharged surfactants. Biochim. Biophys. Acta. 1778:2368-2377. 25.W1alker, R. A., J. C. Conboy, and G. L. Richmond. 1997. Molecularstructure and ordering of phospholipids at a liquid-liquid interface.Langmuir. 13:3070-3073. 26. Sovago, M., G. W. H. Wurpel, ..., M. Bonn. 2007. Calcium-inducedphospholipid ordering depends on surface pressure. J. Am. Chem.Soc. 129:11079-11084. 27. Roke, S.,J. Schins, ..., M. Bonn. 2003. Vibrational spectroscopicinvestigation of the phase diagram of a biomimetic lipid monolayer.Phys. Rev. Lett.90:128101. 28. Ohe, C.,Y. Ida, ..., K. Itoh. 2004. Investigations of polymyxin B-phos-pholipid interactions by vibrational sum frequency generation spectros-31-copy. J. Phys. Chem. B. 108:18081-18087. 29. Ma, G., and H. C. Allen. 2007. Condensing effect of palmitic acid onDPPC in mixed Langmuir monolayers. Langmuir 23:589-597. 30. Chen, X., and H. C. Allen. 2009. Interactions of dimethylsulfoxide witha dipalmitoylphosphatidylcholine monolayer studied by vibrationalsum frequency generation. J. Phys. Chem. A. 113:12655-12662. 31. Casillas-Ituarte,N. N., X. Chen,..., H. C. Allen. 2010. Na and Ca+effect on the hydration and orientation of the phosphate group of DPPCat air-water and air-hydrated silica interfaces. J. Phys. Chem. B.114:9485-9495. 32.IBonn, M., S. Roke,...,M. Muller. 2004. A molecular view of choles-terol-induced condensation in a lipid monolayer. J. Phys. Chem. B.108:19083-19085. 33.W1eeraman, C.,M. Chen,...,L. J. Johnston. 2012. A combined vibra-tional sum frequency generation spectroscopy and atomic force micro-scopy study of sphingomyelin-cholesterol monolayers. Langmuir.ao28:12999-13007. 34.Wang, H. F., W. Gan,...,B. H. Wu. 2005. Quantitative spectral andorientational analysis in surface sum frequency generation vibrationalspectroscopy (SFG-VS). Int. Rev. Phys. Chem. 24:191-256. 35. Gan, W., D. Wu, ..., H. F. Wang. 2006.Polarization and experimentalconfiguration analyses of sum frequency generation vibrational spectra,structure, and orientational motion of the air/water interface. J. Chem.Phys.124:114705-114705. 36.W\ang, H.F., L. Velarde, ...,L. Fu. 2015. Quantitative sum-frequencygeneration vibrational spectroscopy of molecular surfaces and inter-faces: lineshape, polarization, and orientation. Annu. Rev. Phys.Chem. 66:189-216. 37. Wang, H.-F. 2016. Sum frequency generation vibrational spectroscopy(SFG-VS) for complex molecular surfaces and interfaces: spectral line-PAshape measurement and analysis plus some controversial issues. Prog.Surf. Sci. 91:155-182. 38. Smith, J. P., and V. Hinson-Smith. 2004. SFG coming of age. Anal.Chem. 76:287A-290A. 39. Velarde, L., X. Y. Zhang, ..., H. F. Wang. 2011. Communication:spectroscopic phase and lineshapes in high-resolution broadbandsum frequency vibrational spectroscopy: resolving interfacial inho-mogeneities of “identical”molecular groups. J. Chem. Phys.135:241102. 40. Velarde, L., and H. F. Wang. 2013. Unified treatment and measurementof the spectral resolution and temporal effects in frequency-resolvedsum-frequency generation vibrational spectroscopy (SFG-VS). Phys.Chem. Chem. Phys. 15:19970-19984. 41. Velarde, L., and H. F. Wang. 2013. Capturing inhomogeneous broad-ening of the -CN stretch vibration in a Langmuir monolayer withhigh-resolution spectra and ultrafast vibrational dynamics in sum-fre-quency generation vibrationalspectroscopy ((SFG-VS). J. Chem.Phys. 139:084204. 42. Cohen, S. N., A. C. Y. Chang,...,R. B. Helling. 1973. Construction ofbiologically functional bacterial plasmids in vitro. Proc. Natl. Acad.Sci. USA. 70:3240-3244. 43. Petelska, A. D., A. Niemcunowicz-Janica,...,Z. A.Figaszewski. 2010.Equilibria of phosphatidylcholine-Ca+ions in monolayer at the air/water interface. Langmuir. 26:13359-13363. 44.BIian, H. T., R. R. Feng, ..., H. F. Wang. 2008. Increased interfacialthickness of the NaF, NaCl and NaBr salt aqueous solutions probedwith non-resonant surface second harmonic generation (SHG).Phys.Chem. Chem. Phys. 10:4920-4931. 45. Ramstedt, B., and J. P. Slotte. 1999. Interaction of cholesterol withsphingomyelins and acyl-chain-matchedphosphatidylcholines:acomparative study of the effect of the chain length. Biophys.B.J76:908-915. 46. Li,X. M., M.M. Momsen, ....R. E. Brown. 2001. Cholesterol de-creases the interfacial elasticity and detergent solubility of sphingo-myelins. Biochemistry. 40:5954-5963. 47. Smaby,J. M., V. S. Kulkarni, ..., R. E. Brown. 1996.The interfacialelastic packing interactions of galactosylceramides, sphingomyelins,and phosphatidylcholines. Biophys. J. 70:868-877. 48. Benitez, I. O., and D. R. Talham. 2005. Calcium oxalate monohydrateprecipitation at membrane lipid rafts. J. Am. Chem. Soc. 127:2814-2815. 49. Fu, L., S. L. Chen, and H. F. Wang. 2016. Validation of spectra andphase in sub-1 cm-1resolution sum-frequency generation vibrationalspectroscopy through internal heterodyne phase-resolved measure-ment. J. Phys. Chem. B. 120:1579-1589. 50. Mifflin, A. L.,L. Velarde,...,F. M. Geiger. 2015. Accurate line shapesfrom sub-1 cmresolution sum frequency generation vibrational spec-troscopy of a-pinene at room temperature. J. Phys. Chem. A.119:1292-1302. 51. Kett, P. J.N., M. T. L. Casford, and P. B. Davies. 2011. Structure ofmixed phosphatidylethanolamine and cholesterol monolayers in a sup-ported hybrid bilayer membrane studied by sum frequency generationvibrational spectroscopy. J. Phys. Chem. B. 115:6465-6473. 52. Liu, J., and J. C. Conboy. 2005. Structure of a gel phase lipid bilayerprepared by the Langmuir-Blodgett/Langmuir-Schaefer method char-acterized by sum-frequencyVvibrationalspectroscopy.Langmuir.21:9091-9097. 53.W1atry, M. R., T. L. Tarbuck, and G. I. Richmond. 2003. Vibrationalsum-frequency studies of a series of phospholipid monolayers andthe associated water structure at the vapor/water interface. J. Phys.Chem. B. 107:512-518. 54. Backus,E. H. G., D. Bonn,...,M. Bonn. 2012. Laser-heating-induceddisplacement of surfactants on the water surface.J. Phys. Chem. B.116:2703-2712. 55. Harper, K. L., and H. C. Allen. 2007. Competition between DPPC andSDS at the air-aqueous interface. Langmuir. 23:8925-8931. 56. Feng,R.-J., X. Li,..., Y. Guo. 2016. Spectral assignment and orienta-tional analysis in a vibrational sum frequency generation study ofDPPC monolayers at ithe air/water interface. J. Chem.. Phhys.145:244707. 57. Ma,G., and H. C. Allen. 2006. Real-time investigation of lung surfac-tant respreading with surface vibrational1 spectroscopy. Langmuir22:11267-11274. 58. Ma, G., and H. C. Allen. 2006.DPPC Langmuir monolayer at the air-water interface: probing the tail and head groups by vibrational sumfrequency generation spectroscopy. Langmuir. 22:5341-5349. 59. Ohe, C., Y. Goto,...,K. Itoh. 2007. Sum frequency generation spectro-scopic studies on phase transitions of phospholipid monolayers con-taining poly(ethylene oxide) lipids at the air-water interface. J. Phys.Chem. B. 111:1693-1700. 60. Veiga, M. P, J. L. R. Arrondo, ..., D. Marsh. 2001. Interaction ofcholesterol with sphingomyelin in mixed membranes containing phos-phatidylcholine, studied by spin-label ESR and IR spectroscopies. Apossible stabilization of gel-phase sphingolipid domains by choles-terol. Biochemistry. 40:2614-2622. 61. Slotte, J. P. 2016. The importance of hydrogen bonding in sphingomye-lin’s membrane interactions with co-lipids. Biochim. Biophys. Acta.1858:304-310. 62. Lonnfors, M., J. P. F. Doux, ...,J. P. Slotte. 2011. Sterols have higheraffinity for sphingomyelin than for phosphatidylcholine bilayers evenat equal acyl-chain order. Biophys. J. 100:2633-2641. 63.T1albott,C. M., I. Vorobyov, ...,M. C. Yappert. 2000. Conformationalstudies of sphingolipids by NMR spectroscopy.II. Sphingomyelin.Bio-chim. Biophys. Acta. 1467:326-337. 64.IBruzik, K.S. 1988.Conformation of the polar headgroup of sphingo-myelin and its analogues. Biochim. Biophys. Acta. 939:315-326. 65. Villalain. J.. A. Ortiz, and J. C. Gomez-Fernandez. 1988.Molecular in-teractions between sphingomyelin and phosphatidylcholine in phos-pholipid vesicles. Biochim. Biophys. Acta. 941:55-62. 66.Venable,R. M.,A. J. Sodt,....J.B.Klauda.2014. CHARMM all-atomadditive force field for sphingomyelin: elucidation of hydrogenbonding and of positive curvature. Biophys. J. 107:134-145. 67.Yang,H., Y. Xu,..., H. Jiang. 2010. Effects of Na,K*, and Ca+onthe structures of anionic lipid bilayers and biological implication.J. Phys. Chem. B. 114:16978-16988. 68.SSugimori, K., H. Kawabe,...,K. Nishikawa. 2009. Ab initio and DFTstudy of P-31-NMR chemical shifts of sphingomyelin and dihydros-phingomyelin lipid molecule. Int. J. Quantum Chem. 109:3685-3693. 69. Petrov, A. S.,J. Funseth-Smotzer, and G. R. Pack. 2005. Computationalstudy of dimethyl phosphate anion and its complexes with water, mag-nesium, and calcium. Int. J. Quantum Chem. 102:645-655. 70. Hirose, C.,N. Akamatsu, and K. Domen. 1992. Formulas for the anal-ysis of surface sum-frequency generation spectrum by CH stretchingmodes of methyl and methylene groups. J. Chem. Phys. 96:997-1004. 71. Lu, R., W. Gan,..., H.-f. Wang. 2004. Vibrational polarization spec-troscopy of CH stretching modes of the methylene group at the va-por/liquid interfaces with sum frequency generation. J. Phys. Chem.B. 108:7297-7306. 72. Schleeger, M., Y. Nagata, and M. Bonn. 2014.Quantifying surfactantalkyl chain orientation and conformational order from sum frequencygeneration spectra of CH modes at the surfactant-water interface.J. Phys. Chem.Lett. 5:3737-3741. 73. Chen, X., W. Hua, ..., H. C. Allen. 2010. Interfacial water structureassociated with phospholipid membranes studied by phase-sensitivevibrational sum frequency generation spectroscopy. J. Am. Chem.Soc. 132:11336-11342. 74. AFrrondo,J. L. R., F. M. Goni, and J.M. Macarulla. 1984. Infrared spec-troscopy of phosphatidylcholines in aqueous suspension. A study of thephosphate group vibrations. Biochim. Biophys. Acta.794:165-168. 75. Mrazkova, E., P. Hobza, ..., W. Pohle.2005. Hydration-inducedchanges of structure and vibrational frequencies of methylphosphocho-line studied as a model of biomembrane lipids. J. Phys. Chem. B.109:15126-15134. 76. Goni,F. M.,and J. L. R. Arrondo. 1986. A study of phospholipid phos-phate groups in model membranes by Fourier transform infrared spec-troscopy. Faraday Discuss. Chem. Soc. 81:117-126. 77. Hadzi, D., M. Hodoscek, ..., F. Avbelj. 1992. Intermolecular effects onphosphate frequencies in phospholipids-infrared study and ab initiomodel calculation. J.Mol. Struct. 266:9-19. 78. Pohle, W., C. Selle, ..., M. Bohl. 1997. Comparative FTIR spectro-scopic study upon the hydration of lecithins and cephalins. J. Mol.Struct. 408:273-277. 79. Adams, E. M., C. B. Casper, and H. C. Allen. 2016. Effect of cationenrichment on dipalmitoylphosphatidylcholine (DPPC) monolayersat the air-water interface. J. Colloid Interface Sci. 478:353-364. 80. Chen, Y., K. C. Jena,..., S. Roke. 2015. Three dimensional nano“Langmuir Trough” for lipid studies. Nano Lett. 15:5558-5563. 81. Liljeblad,J. F. D.,V. Bulone,..., C. M. Johnson. 2010. Phospholipidmonolayers probed by vibrational sum frequency spectroscopy: insta-bility of unsaturated phospholipids. Biophys. J.98:L50-L52. 82.LIincoln, S. F., and D. R. Stranks. 1968. Phosphate complexes of Co-balt(3).I. General structural and hydrolytic properties. Aust. J. Chem.21:37-56. 83.IDluhy, R. A., D. G. Cameron,...,R. Mendelsohn. 1983. Fourier-trans-form infrared spectroscopic studies of the effect of calcium-ions onphosphatidylserine. Biochemistry. 22:6318-6325. 84. DIecius,J. C., and R. M. Hexter. 1977.Molecular Vibrations in Crystals.McGraw-Hill,New York. 85.Smondyrev, A. M., and M. L. Berkowitz. 1999.United atom forcefield for phospholipid membranes: constant pressure molecular dy-namics simulation of dipalmitoylphosphatidylcholine/water system.J. Comput. Chem. 20:531-545. 86.1Brumm, T., C. Naumann, ..., T. M. Bayerl. 1994. Conformational-changes of the lecithin headgroup in monolayers at the air/water inter-face-a neutron reflection study. Eur. Biophys. J. 23:289-295. 87. Casper, C. B.,D. Verreault,...,H. C. Allen. 2016. Surface potential ofDPPC monolayers on concentrated aqueous salt solutions. J. Phys.Chem. B. 120:2043-2052. 88.Shen, Y. R. 2011. Surface nonlinear optics. J. Opt. Soc. Am. B.28:A56-A66. 89. Shen, Y. R. 2003. The Principles of Nonlinear Optics. Wiley-Interscience, Hoboken, NJ. 90. Zhuang,X., P. B. Miranda, ..., Y. R. Shen. 1999. Mapping molecularorientation and conformation at interfaces by surface nonlinear optics.Phys. Rev. B. 59:12632-12640. 91. Wei,X., S. C. Hong,..., Y. R. Shen. 2000. Nonlinear optical studies ofliquid crystal alignment on a rubbed polyvinyl alcohol surface. Phys.Rev. E Stat. Phys. Plasmas Fluids Relat. Interdiscip. Topics. 62 (4 PtA):5160-5172. 92. Feller, M. B., W. Chen, and Y. R. Shen. 1991. Investigation of surface-induced alignment of liquid-crystal molecules by optical second-har-monic generation. Phys. Rev. A. 43:6778-6792. 93. Shen, Y. R. 2001. Exploring new opportunities with sum-frequencynonlinear optical spectroscopy. Pure Appl. Chem. 73:1589-1598. 94. Hirose, C., H. Yamamoto,...,K. Domen. 1993. Orientation analysis bysimulation of vibrational sum-frequency generation spectrum: CHstretching bands of the methyl-group. J. Phys. Chem.97:10064-10069. 95. Akamatsu,N.,K. Domen, and C. Hirose. 1993. SFG study of 2-dimen-sional orientation of surface methyl-groups on cadmium arachidateLangmuir-Blodgett-films. J. Phys. Chem. 97:10070-10075. 96.Wang,C. Y., H. Groenzin, and M. J. Shultz. 2004. Surface characteriza-tion of nanoscale TiO2 film by sum frequency generation using meth-anol as a molecular probe. J. Phys. Chem. B. 108:265-272. 97. Chen, S.-L., L. Fu,...,H.-F. Wang. 2016. Homogeneous and inhomo-geneous broadenings and the Voigt line shapes in the phase-resolvedand intensity sum-frequency generation vibrationalspectroscopy.J. Chem. Phys. 144:034704. Biophysical Journal May rossMark The interactions between Ca2þ ions and sphingomyelin play crucial roles in a wide range of cellular activities. However, little is known about the molecular details of the interactions at interfaces. In this work, we investigated the interactions between Ca2þ ions and egg sphingomyelin (ESM) Langmuir monolayers at the air/water interface by subwavenumber high-resolution broadband sum frequency generation vibrational spectroscopy (HR-BB-SFG-VS). We show that Ca2þ ions can induce ordering of the acyl chains in the ESM monolayer. An analysis of the one alkyl-chain-deuterated ESM revealed that the Ca2þ ions do not affect the N-linked saturated fatty acid chain, although they make the sphingosine backbone become ordered. Further analysis of the SFG-VS spectra shows that the interactions between ESM and Ca2þ ions make the orientation of the methyl group at the end of sphingosine backbone change from pointing downward to pointing upward. Moreover, a large blue shift of the phosphate group at the CaCl2 solution interface indicates, to our knowledge, new cation binding modes. Such binding causes the phosphate moiety to dehydrate, resulting in the conformation change of the phosphate moiety. Based on these results, we propose the molecular mechanism that Ca2þ ions can bind to the phosphate group and subsequentlydestroy the intramolecular hydrogen bond between the 3-hydroxyl group and the phosphate oxygen, which results in an ordering change of the sphingosine backbone. These findings illustrate the potential application of HR-BB-SFG-VS to investigate lipidcation interactions and the calcium channel modulated by lipid domain formation through slight structural changes in the membrane lipid. It will also shed light on the interactions of complex molecules at surfaces and interfaces.
关闭-
1/11
-
2/11
还剩9页未读,是否继续阅读?
继续免费阅读全文产品配置单
北京欧兰科技发展有限公司为您提供《鞘磷脂中和频光谱检测方案(其它光谱仪)》,该方案主要用于其他中其他检测,参考标准《暂无》,《鞘磷脂中和频光谱检测方案(其它光谱仪)》用到的仪器有Ekspla SFG 表面和频光谱分析系统。
我要纠错
推荐专场
相关方案
 咨询
咨询