

方案详情文
智能文字提取功能测试中
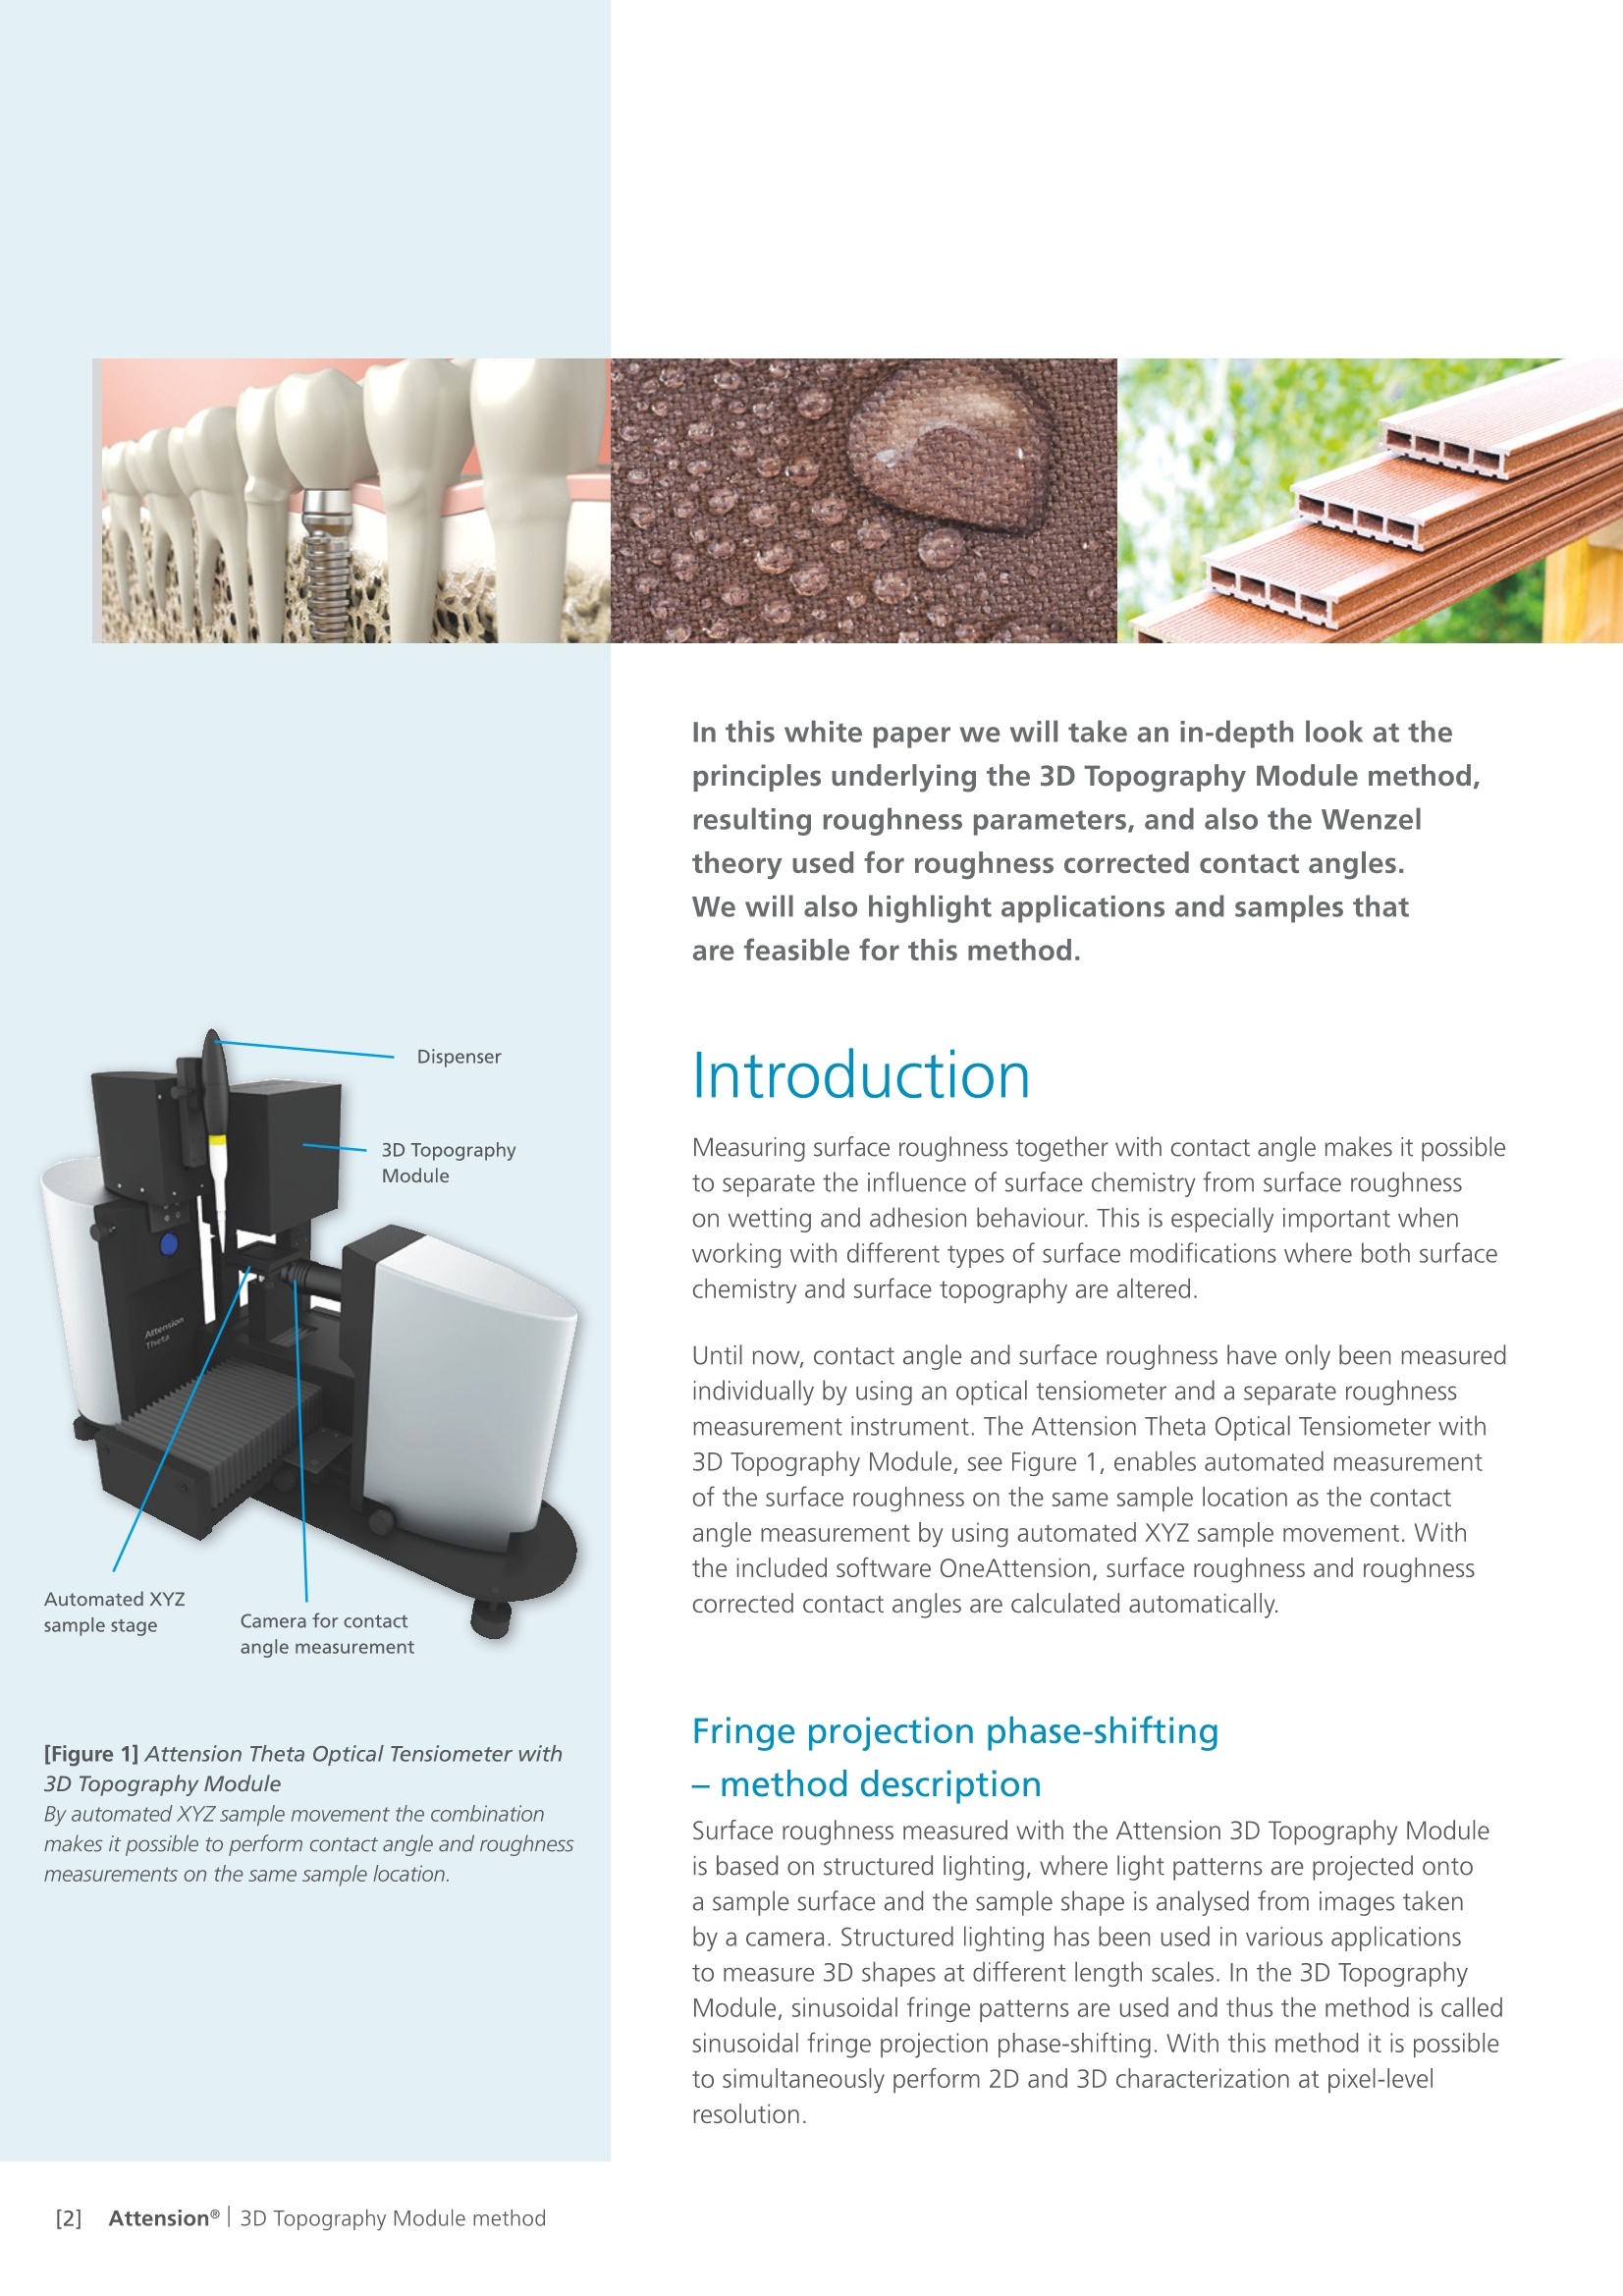
Attension@|White Paper The Attension Theta Optical Tensiometerwith 3D Topography Module - for Roughness Corrected Contact Angles Author: Susanna Lauren, PhD, Biolin Scientific [Figure 1] Attension Theta Optical Tensiometer with3D Topography Module By automated XYZ sample movement the combinationmakes it possible to perform contact angle and roughnessmeasurements on the same sample location. In this white paper we will take an in-depth look at theprinciples underlying the 3D Topography Module method,resulting roughness parameters, and also the Wenzeltheory used for roughness corrected contact angles.We will also highlight applications and samples thatare feasible for this method. Introduction Measuring surface roughness together with contact angle makes it possibleto separate the influence of surface chemistry from surface roughnesson wetting and adhesion behaviour. This is especially important whenworking with different types of surface modifications where both surfacechemistry and surface topography are altered. Until now, contact angle and surface roughness have only been measuredindividually by using an optical tensiometer and a separate roughnessmeasurement instrument. The Attension Theta Optical Tensiometer with3D Topography Module, see Figure 1, enables automated measurementof the surface roughness on the same sample location as the contactangle measurement by using automated XYZ sample movement. Withthe included software OneAttension, surface roughness and roughnesscorrected contact angles are calculated automatically. Fringe projection phase-shifting- method description Surface roughness measured with the Attension 3D Topography Moduleis based on structured lighting, where light patterns are projected ontoa sample surface and the sample shape is analysed from images takenby a camera. Structured lighting has been used in various applicationsto measure 3D shapes at different length scales. In the 3D TopographyModule, sinusoidal fringe patterns are used and thus the method is calledsinusoidal fringe projection phase-shifting. With this method it is possibleto simultaneously perform 2D and 3D characterization at pixel-levelresolution. As illustrated in Figure 2, the 3D Topography Module consists of aprojector with an LED light source and a slide with sinusoidal fringepatterns on a grey-scale. These illumination patterns are sequentiallyprojected onto the studied surface, and a digital camera captures thefringe patterns from which the 3D shape of the object is reconstructedby phase-shift coding. This enables pixel level measurement resolution.In the 3D Topography Module, the pixel size is 1.1 pm x 1.1 pm foranalysis of micron-scale surface features. The sinusoidal fringes can be expressed by1: where (x, y) is the coordinate in the slide frame plane, a is backgroundintensity, b is amplitude modulation, p is sinusoidal grating wavelength,d, is the additional phase shift caused by the surface height and 8 is thephase shift from the slide movement. As an example for a color pattern with red, green, and blue light, we candemonstrate the case of three divided wavelengths where Ir, lg, and Ibare the corresponding intensities for each of the colors. The phase shiftscan be plotted as in Figure 3. Then the spatial phase shift can be expressed with the following equation 1: The phase shift indicates the horizontal coordinate, i.e. the heightdifferences in every pixel providing the sample topography. There are many different algorithms available that use sinusoidal phase-shifting. For this application, the algorithm was based on an analogousgrayscale version. The RGB light example is given to illustrate the principle,however the exact equations used in our approach are proprietary. The algorithm and instrument design can be validated with a validationtool with a known surface structure. The validation specimen has apatterned structure with known surface topography features, allowingthe user to compare the measured roughness value to a theoreticalroughness value, see Figure 4. B [Figure 2] Fringe Projection Phase-Shifting shematics(A) and an example of a surface with the projectedpattern (B). A sinusoidal pattern is sequentiallyprojected on the sample surface and a camera is utlizedto capture the fringe patterns and recontruct the 3Dimage by phase-shift coding. [Figure 3] In the sinusoidal phase-shifting method aseries of phase-shifted sinusoidal patterns are recorded(top), from which the phase information at every pixe/is obtained (bottom). The phase shift correlates withsample surface topography from pixe/ to pixel thatdefines the resolution. A B C [Figure 4] Attension 3D Topography Module imagesfor the validation tool. A) optical image, B) 2D imageand C) 3D image. Utilization of different roughness parameters Surface roughness cannot be accurately characterized by using a singleroughness parameter. Instead a set of surface roughness parametersare defined. Parameters that characterize surface profiles are called 2Dparameters, and are marked with the letter "R". These parameters arewidely utilized in different applications but are not really able to providea complete picture for three dimensional surfaces. Parameters used tocharacterize the surface topography are called 3D parameters, and aremarked with the letter "S". Some of the 3D parameters have 2D coun-terparts; others are specifically developed for 3D surfaces. A summaryof these parameters as stated by the ISO 25178 standard (and their 2Dcounterparts) is presented in Table 1. Only the area factor, S, is utilized for the Wenzel contact angle roughnesscorrection. However, with the 3D Topography Module a selection of2D and 3D parameters are measured for detailed surface topographicalcharacterization: S is the arithmetic mean height of the surface. Sand its2D counterpart are the most widely used roughness parameters that givethe standard deviation of height. R and R give the maximum height ofthe summit and maximum depth of the valleys, respectively. R, gives thepeak to peak value and R. is calculated as the mean height value of fivelocal maxima and local minima. It is worth pointing out that R. is moresensitive to noise than R.. The ratio between the interfacial and projectedarea, S, gives the additional surface area contributed by the texture. Thisparameter is especially useful in wettability studies since it can be used tocalculate the roughness factor, r, utilized in the Wenzel equation. The 3D Topography Module provides 3-dimensional characterizationover a surface area of 1.4 mm x 1.1 mm. Larger surface areas up to4.2 mm x 4.2 mm can be characterized by automatic stitching of imagesin OneAttension software. Contact angle roughness correction usingthe Wenzel equation Both chemical and topographical properties of the surface are importantparameters in many different applications and processes, where wettingand adhesion behavior needs to be optimized. Wettability can be studiedby measuring the contact angle of the substrate with a given liquid.The Young equation21 describes the balance at the three phase linebetween solid, liquid and gas: Ysv=Y,+Ycose, The interfacial tensions, YwY, and y, form the equilibrium contacttyrangle of wetting, referred to Young's contact angle 0. Young's equationassumes that the surface is chemically homogenous and topographicallysmooth. This is however usually not true in the case of real surfaces, whichinstead of having one equilibrium contact angle value generally exhibit arange of contact angles between the advancing and receding values. In Figure 5, a droplet on an ideal and a real surface is presented. On theideal surface, Young's equation applies and the measured contact angle isequal to Young's contact angle (Figure 5A). On a real surface, the actual Symbol Name Equations Description Ra, Sa Arithmetic average Sa.==-NM n(xp)ij) i=1j=1 Average of zl Rg, Sq Root mean square(RMS)roughness Sq= n(xp))) Standard deviation of z Rp Sp Maximum heightof peaks S,= MAX(np) Maxz Ry, Sy Maximum depthof valleys S,= MIN(ny) Min z Rz,Sz Maximum heightof the surface Sz= (|s,|+|s,|) Maxz-Min z R10zS10z Ten point height : _2 Average of five highest localmaxima and five deepest localminima 5 Sdr Area factor (Textured surface area)-(Cross sectional area)Cross sectional area *100% 1-M-1_j=1 Zi=1Ag-(M-1)(N-1)AxAy二(M-1)(N-1) AxAy *100% Ratio between the interfacialand projected areas contact angle is the angle between the tangent to the liquid-fluid interfaceand the actual, local surface of the solid (Figure 5B). However, themeasured (apparent) contact angle is the angle between the tangent tothe liquid-fluid interface and the line that represents the apparent solidsurface, as seen macroscopically. Actual and apparent contact angle valuescan deviate substantially from each other. To calculate theoretically validsurface free energies of the solid the actual contact angles should be used. [Table 1] Roughness parametersaccording to the ISO 25178 standard. The relationship between roughness and wettability was defined in 1936by Wenzel who stated that adding surface roughness will enhance the wet-tability caused by the chemistry of the surface. For example, if the surfaceis chemically hydrophobic, it will become even more hydrophobic whensurface roughness is applied. Wenzel's statement!3.4 can be described by: cos =rcos0, where 0 is the measured contact angle, 0, is Young's contact angle andr is the roughness ratio. Roughness ratio is defined as the ratio betweenthe actual and projected solid surface area (r=1 for a smooth surface and> 1 for a rough surface). It is important to note that the Wenzel equationis based on the assumption that the liquid completely penetrates into theroughness grooves (as in Figure 5B). Wenzel's equation is an approximationthat becomes more accurate as the drop becomes larger compared to thescale of the roughness. It follows that if the drop is larger than the rough-ness scale by two to three orders of magnitude, the Wenzel equationapplies. This fits well with contact angle measurement's length scale ofmicroliter volume droplets being millimeters, and the roughness analysedby the 3D Topography Module being microns. The roughness ratio, r,for the Wenzel equation is calculated from the 3-dimensional area factorSaccording to the following equation5: [Figure 5] Definition of different types of contactangles; (A) Contact angle on an ideal surface iscalled the Young's contact angle (B) Apparentor measured contact angle on a real surfacewith an inherentroughness. Applications The 3D Topography Module is utilized in applications, where themicro-scale roughness is an important factor influencing a materials'adhesion properties. Since the 3D Topography Module uses an optical method, a diffusereflecting surface is required. Therefore, samples being completelyblack or transparent cannot be analysed. Also, surfaces with amirror-like appearance (i.e. very shiny surfaces) may give irregularresults. Below are examples of three common application areas. Biocompatibility of implants Various materials such as metals, ceramics, and polymers, are beingutilized as implants in medicine. The surface of the implant is typicallymodified through mechanical roughening and/or chemical treatmentto enhance biocompatibility with the surrounding host tissue.Separating the impact of chemical and mechanical treatment fromwater contact angles can be very useful in implant developmentand quality control. For details see application note 17 at biolinscientific.com/attension/applications. Paper and board coatings Optimized wetting and adhesion to paper surfaces plays a crucial rolein ensuring quality and runnability in various converting and finishingoperations such as printing and packaging. Base paper can be coatedfor example with pigment coatings to provide a smooth surface forprinting or by wax coatings to ensure a barrier against odor and gastransmission in packaging applications. Paper surfaces typically containmicroscale roughness that has an influence on wetting and adhesionlin addition to the applied coating chemistry. Thus, understanding theimpact of roughness on wetting may help with coating formulationand optimization of surface treatment processes as well as to givemore insight into the root cause of quality issues. Construction and building materials Coating and surface finishing for construction and building materialsare important for enhanced appearance and durability. Adhesion ofdifferent types of coatings, such as paint or veneer sheeting can dependon both surface topography and surface chemistry. The Theta OpticalTensiometer with 3D Topography Module can be used for evaluatingsurface processing quality and its influence on wettability. For moreinformation see application note 16 focusing on wood plasticcomposites at biolinscientific.com/attension/applications. Summary In this white paper we have described the 3D Topography Modulefringe projection phase-shifting principle, defined the roughnessparameters measured with this method and shown how Wenzel'sequation can be used to provide roughness corrected contactangles. ln addition, a handful of the most common applicationareas, along with sample limitations have been described. The Attension Theta Optical tensiometer with 3D TopographyModule is the first product which makes it possible to combine3D surface roughness measurements in conjunction with contactangle measurements and to perform those measurements at thesame exact sample location. · OneAttension software can automatically calculate roughness,roughness corrected contact angles and surface free energy ●TThe fully automatic measurement takes only a few secondsand can be run and analyzed without a dedicated specialist TThis approach separates the impact of surface chemistry androughness of various coating formulations and surfacemodifications [References and further reading] [1] S. Zhang and P. Huang, "High-resolution, Real-time 3D ShapeAcquisition", Computer Vision and Pattern RecognitionWorkshop, 2004. [2]1T. Young, In: Miscellaneous Works, Vol l, G. Peacock and J.Murray (Ed.), London, UK, 1855 [3] A. Marmur, "Soft contact: measurement and interpretation ofcontact angles", Soft Matter 2 (2006) 12 ( [ 4 ] R . W . Wen ze l, I n d . E n g . C h e m. 1 9 36 , 2 8 , 9 88 ) ( [ 5 ] ] J J . P el t o n e n, M . J a rn, S . A r e va, M. L i n d en a n d J . B . R o s enho l m , T o po g r aph i c a l P a rame t ers f o r S p e ci f y i n g a T h ree-Dimen si o n a l S ur f ac e, L a n g m u i r 2 0 0 4 , 2 0, 9 42 8- 9 4 3 1 ) ( [ 6 ] ) A . B .D . C a s s ie a nd S. B ax t e r, "Wet ta b i l it y of p oro u s su r faces ", T r a n s a ct i o n s o f t h e Fa r a d a y S o ci et y 40 ( 19 4 4 ) 5 4 6 ) ( [ 7 ] A . T u t e j a , W . C h o i, M . M a , J . M. M a b r y, S . A. M a z z e l l a , G .C. R ut l e dg e , G . H . M c K i n l e y an d R.H. Co h en , " D e s i gn in gs u p ero l eo ph ob i c s u r f a c e s", S c i e n ce 3 1 8 ( 2 00 7 ) 1 618 ) ( [ 8 ] A . M a r mu r, " S o li d-S ur f a c e ch a r ac t e ri za tio n b y we t ti n g " , A nn u al revi e w o f m a t e r ials r e se a r c h 3 9 (2009 ) 47 3 ) [9] K.J. Stout, P.J. Sullivan, W.P. Dong, E. Mainsah,N. Luo, T.Mathia and H. Zahouani, "The development of methods forthe characterization of roughness in three dimensions", 1993 [10]L. Blunt and X. Jiang,“Advanced techniques for assessmentsurface topography, Development of a basis for 3D surfacetexture standards "SURFSTAND", Chapter 2, 2003 [11][ISO25178] Geometrical product specifications (GPS)-Surface texture: Areal Part 2: Terms, definitions and surfacetexture parameters About us Biolin Scientific is a leading Nordic instrumentation company with rootsin Sweden, Denmark and Finland. Our customers include companiesworking with pharmaceuticals, energy, chemicals, and advanced materials,as well as academic and governmental research institutes. Our precisioninstruments help discover better drugs faster, develop better solutionsfor energy and materials, and perform research at the frontiers of scienceand technology. Contact us at info@biolinscientific.com Biolin Scientific[Progress Together] [] Attension@| D Topography Module method 将表面粗糙度与接触角结合能够排除接触角测试过程中粗糙度对其在浸润和粘附行为中的影响。在不同类型的表面改性,包括表面化学改性和表面粗糙度改性等方面有重要作用。直到现在,接触角和粗糙度还是使用光学法和粗糙度测量设备分别测试。配备3D形貌模块的Attension Theta Flex光学法设备,见表1,可通过XYZ自动样品台的移动满足同一位置粗糙度和接触角自动测量。在OneAttension软甲哪种,表面粗糙度和粗糙度校准接触角能够自动计算。
关闭-
1/8
-
2/8
还剩6页未读,是否继续阅读?
继续免费阅读全文产品配置单


大昌华嘉科学仪器为您提供《接触角中粗糙度校正接触角检测方案(接触角测量仪)》,该方案主要用于其他中粗糙度校正接触角检测,参考标准《暂无》,《接触角中粗糙度校正接触角检测方案(接触角测量仪)》用到的仪器有光学接触角形貌联用仪、水滴角测量仪 Theta Lite。
我要纠错

相关方案
 咨询
咨询