方案详情文
智能文字提取功能测试中
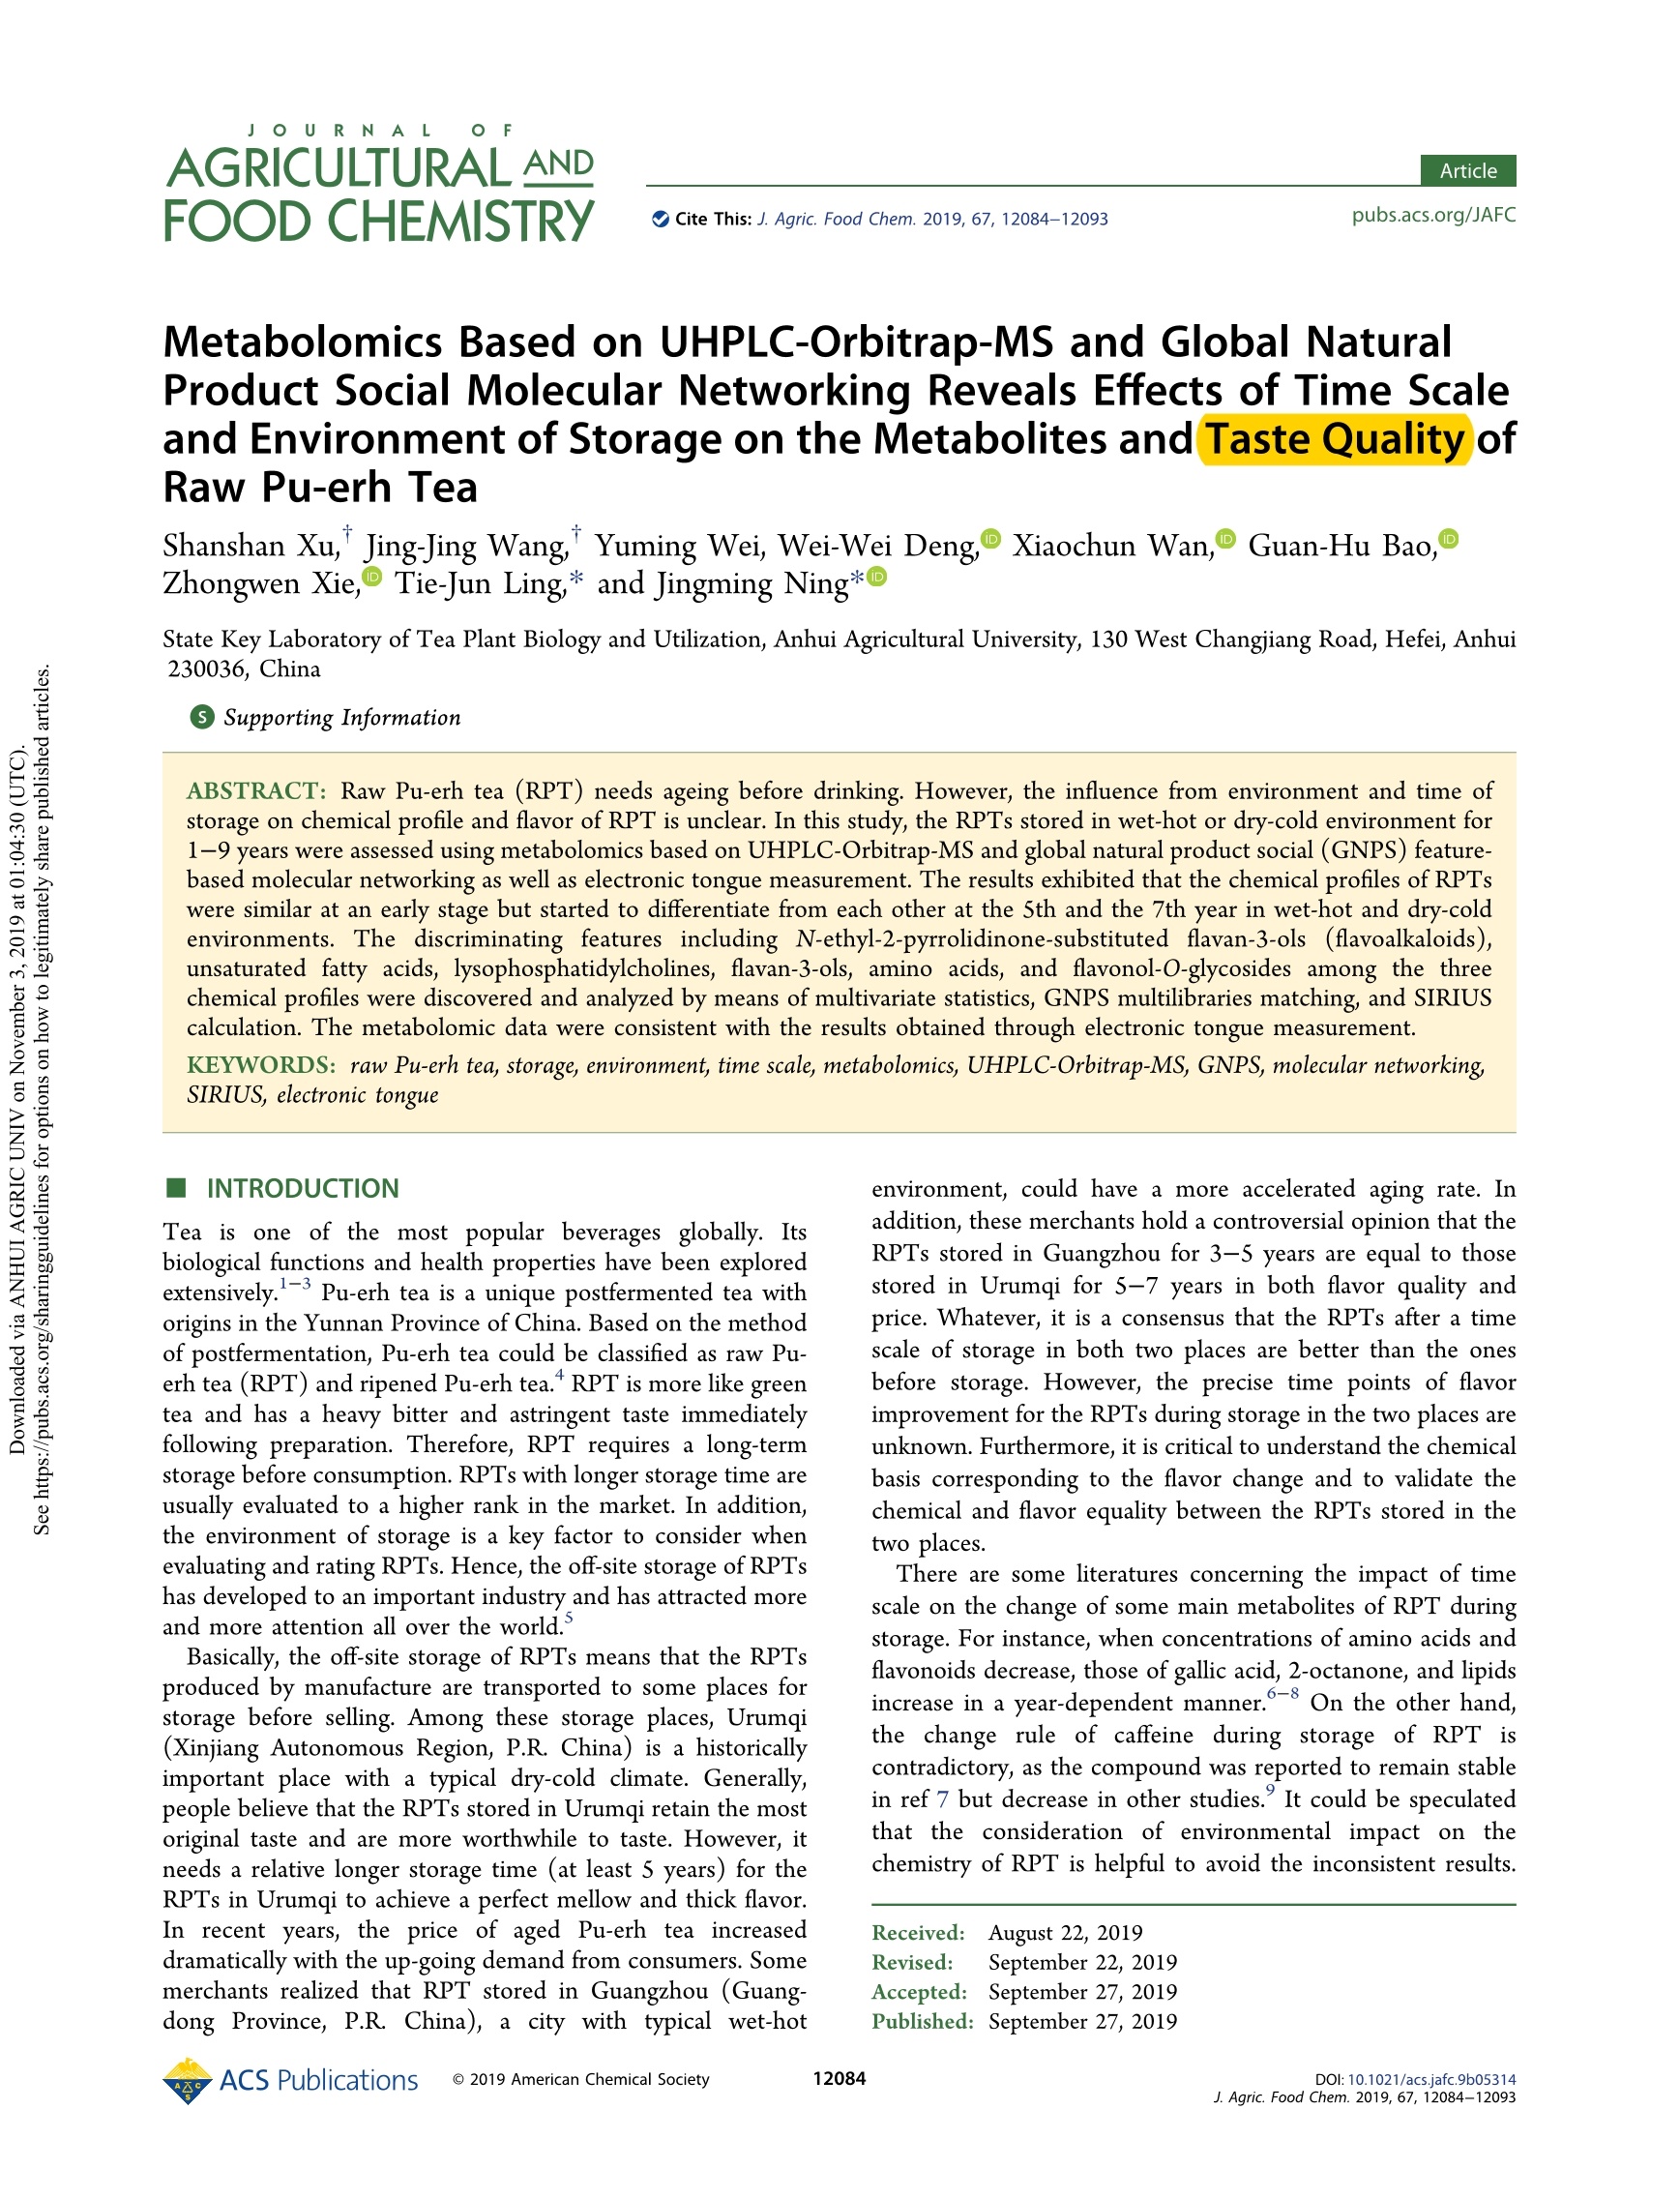
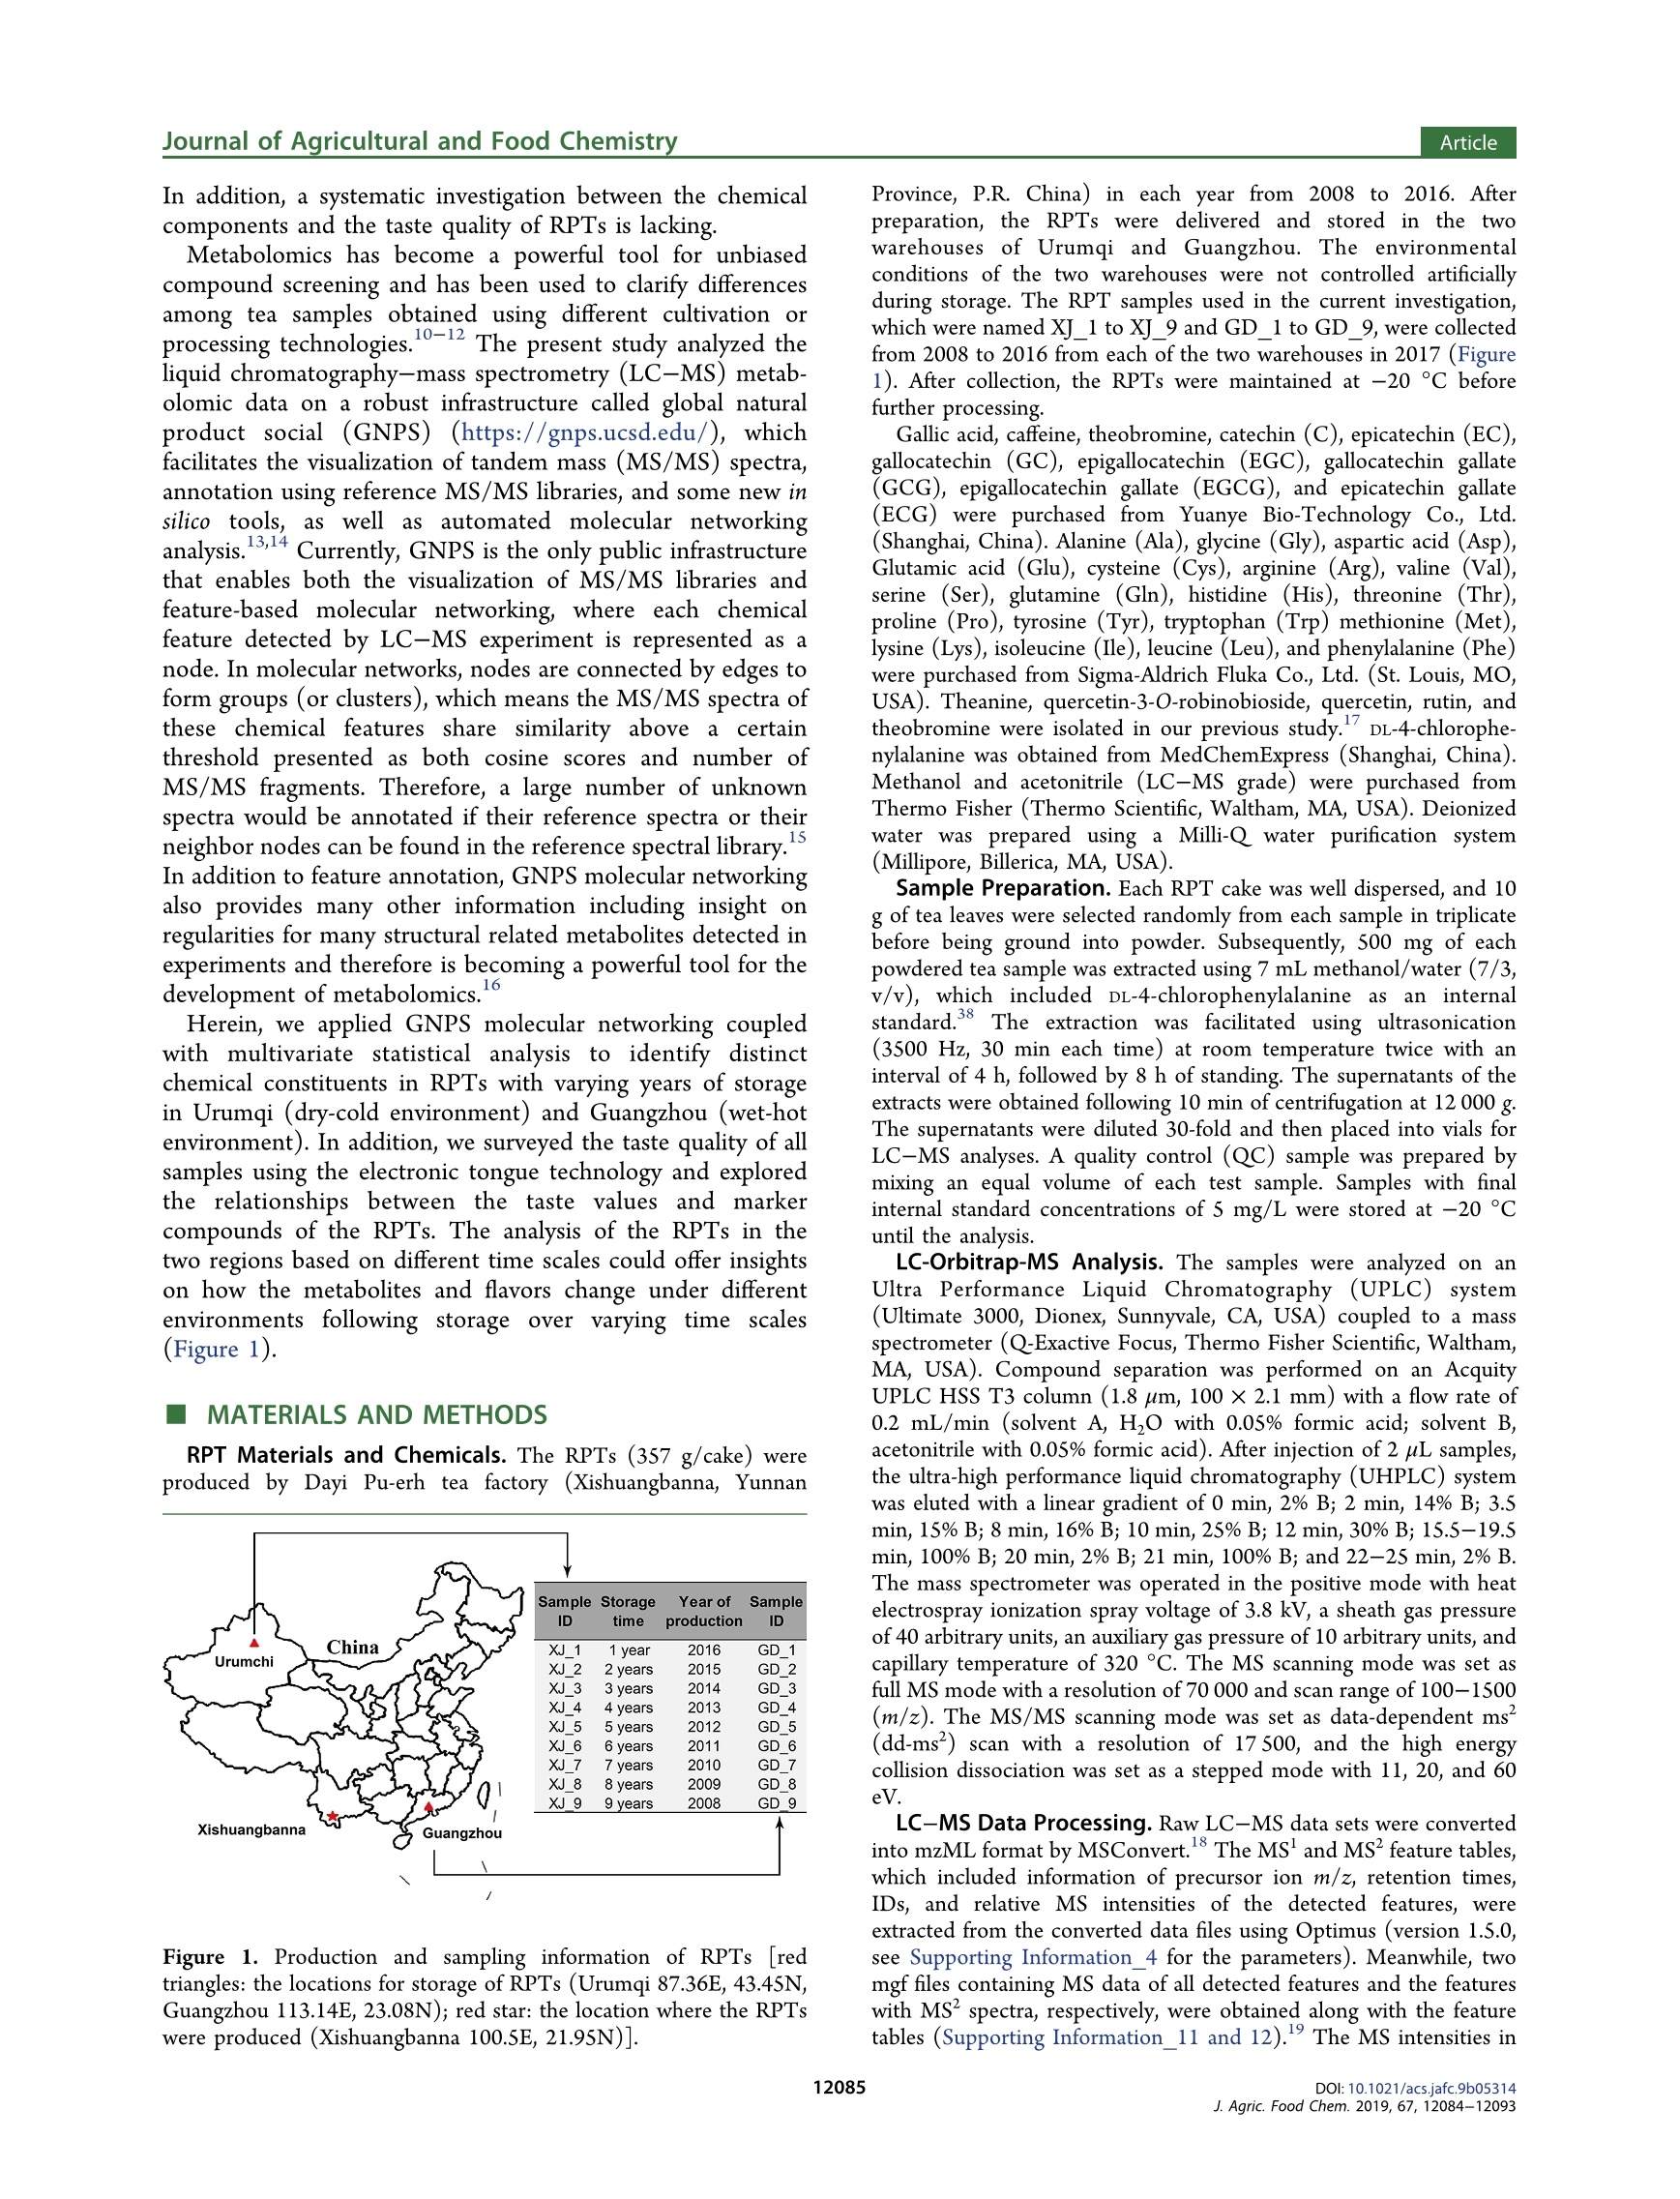
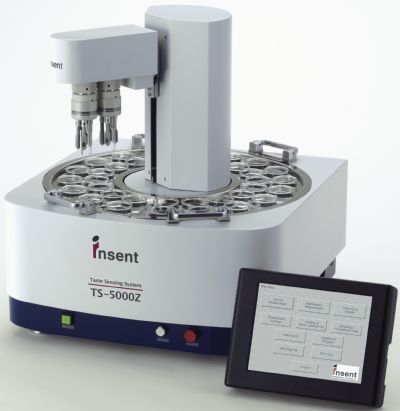
JURNA LAGRICULTURAL ANDFOOD CHEMISTRYArticlepubs.acs.org/JAFCCite This: J. Agric. Food Chem. 2019, 67, 12084-12093 ArticleJournal of Agricultural and Food Chemistry Metabolomics Based on UHPLC-Orbitrap-MS and Global NaturalProduct Social Molecular Networking Reveals Effects of Time Scaleand Environment of Storage on the Metabolites and Taste Quality ofRaw Pu-erh Tea Shanshan Xu, JingJing Wang, Yuming Wei, Wei-Wei DengXiaochun Wan, Guan-Hu Bao,"DZhongwen Xie, Tie-Iun Ling * and ingmi Ning:D State Key Laboratory of Tea Plant Biology and Utilization, Anhui Agricultural University, 130 West Changjiang Road, Hefei, Anhui230036, China SSupporting Information ABSTRACT: Raw Pu-erh tea (RPT) needs ageing before drinking. However, the influence from environment and time ofstorage on chemical profile and flavor of RPT is unclear. In this study, the RPTs stored in wet-hot or dry-cold environment for1-9 years were assessed using metabolomics based on UHPLC-Orbitrap-MS and global natural product social (GNPS) feature-based molecular networking as well as electronic tongue measurement. The results exhibited that the chemical profiles of RPTswere similar at an early stage but started to differentiate from each other at the Sth and the 7th year in wet-hot and dry-coldenvironments. The discriminating features including N-ethyl-2-pyrrolidinone-substituted flavan-3-ols (flavoalkaloids),unsaturated fatty acids, lysophosphatidylcholines, flavan-3-ols, amino acids, and flavonol-O-glycosides among the threechemical profiles were discovered and analyzed by means of multivariate statistics, GNPS multilibraries matching, and SIRIUScalculation. The metabolomic data were consistent with the results obtained through electronic tongue measurement. KEYWORDS: raw Pu-erh tea, storage, environment, time scale, metabolomics, UHPLC-Orbitrap-MS, GNPS, molecular networking,SIRIUS, electronic tongue INTRODUCTION Tea is one of the most popular beverages globally. Itsbiological functions and health properties have been exploredextensively.1-3 Pu-erh tea is a unique postfermented tea withorigins in the Yunnan Province of China. Based on the methodof postfermentation, Pu-erh tea could be classified as raw Pu-erh tea (RPT) and ripened Pu-erh tea. RPT is more like greentea and has a heavy bitter and astringent taste immediatelyfollowing preparation. Therefore, RPT requires a long-termstorage before consumption. RPTs with longer storage time areusually evaluated to a higher rank in the market. In addition,the environment of storage is a key factor to consider whenevaluating and rating RPTs. Hence, the off-site storage of RPTshas developed to an important industry and has attracted moreand more attention all over the world. Basically, the off-site storage of RPTs means that the RPTsproduced by manufacture are transported to some places forstorage before selling. Among these storage places, Urumqi(Xinjiang Autonomous Region, P.R. China) is a historicallyimportant place with a typical dry-cold climate. Generally,people believe that the RPTs stored in Urumqi retain the mostoriginal taste and are more worthwhile to taste. However, itneeds a relative longer storage time (at least 5 years) for theRPTs in Urumqi to achieve a perfect mellow and thick flavor.In recent years, the price of aged Pu-erh tea increaseddramatically with the up-going demand from consumers. Somemerchants realized that RPT stored in Guangzhou (Guang-dong Province, P.R. China), a city with typical wet-hot environment, could have a more accelerated aging rate. Inaddition, these merchants hold a controversial opinion that theRPTs stored in Guangzhou for 3-5 years are equal to thosestored in Urumqi for 5-7 years in both flavor quality andprice. Whatever, it is a consensus that the RPTs after a timescale of storage in both two places are better than the onesbefore storage. However, the precise time points of flavorimprovement for the RPTs during storage in the two places areunknown. Furthermore, it is critical to understand the chemicalbasis corresponding to the flavor change and to validate thechemical and flavor equality between the RPTs stored in thetwo places. There are some literatures concerning the impact of timescale on the change of some main metabolites of RPT duringstorage. For instance, when concentrations of amino acids andflavonoids decrease, those of gallic acid, 2-octanone, and lipidsincrease in a year-dependent manner.-8 On the other hand,the change rule of caffeine during storage of RPT iscontradictory, as the compound was reported to remain stablein ref 7 but decrease in other studies. It could be speculatedthat the consideration of environmental impact on thechemistry of RPT is helpful to avoid the inconsistent results. ( R eceived : August 22,2019 ) ( Re vised: September 22, 2019 ) ( Accepted:1 :September 27, 2019 ) ( P u b lished: S eptember 27, 2019 ) In addition, a systematic investigation between the chemicalcomponents and the taste quality of RPTs is lacking. Metabolomics has become a powerful tool for unbiasedcompound screening and has been used to clarify differencesamong tea samples obtained using different cultivation orprocessing technologies.10-12 The present study analyzed theliquid chromatography-mass spectrometry (LC-MS) metab-olomic data on a robust infrastructure called global naturalproduct social (GNPS) (https://gnps.ucsd.edu/), whichfacilitates the visualization of tandem mass (MS/MS) spectra,annotation using reference MS/MS libraries, and some new insilico tools, as wellllas automated molecular networkinganalysis.13,14 Currently, GNPS is the only public infrastructurethat enables both the visualization of MS/MS libraries andfeature-based molecular networking, where each chemicalfeature detected by LC-MS experiment is represented as anode. In molecular networks, nodes are connected by edges toform groups (or clusters), which means the MS/MS spectra ofthese chemical features share similarity above a certainthreshold presented as both cosine scores and number ofMS/MS fragments. Therefore, a large number of unknownspectra would be annotated if their reference spectra or theirSneighbor nodes can be found in the reference spectral library.In addition to feature annotation, GNPS molecular networkingalso provides many other information including insight onregularities for many structural related metabolites detected inexperiments and therefore is becoming a powerful tool for thedevelopment of metabolomics. Herein, we applied GNPS molecular networking coupledwith multivariate statistical analysis to identify distinctchemical constituents in RPTs with varying years of storagein Urumqi (dry-cold environment) and Guangzhou (wet-hotenvironment). In addition, we surveyed the taste quality of allsamples using the electronic tongue technology and exploredthe relationships between the taste values and markercompounds of the RPTs. The analysis of the RPTs in thetwo regions based on different time scales could offer insightson how the metabolites and flavors change under differentenvironments following storage over varying time scales(Figure 1). MATERIALS AND METHODS RPT Materials and Chemicals. The RPTs (357 g/cake) wereproduced by Dayi Pu-erh tea factory (Xishuangbanna, Yunnan Figure 1. Production and sampling information of RPTs [redtriangles: the locations for storage of RPTs (Urumqi 87.36E, 43.45N,Guangzhou 113.14E, 23.08N); red star: the location where the RPTswere produced (Xishuangbanna 100.5E, 21.95N)]. Province, P.R. China) in each year from 2008 to 2016. Afterpreparation, the RPTs were delivered and stored in the twowarehouses of Urumqi and Guangzhou. The environmentalconditions of the two warehouses were not controlled artificiallyduring storage. The RPT samples used in the current investigation,which were named XJ_1 to XJ 9 and GD_1 to GD 9, were collectedfrom 2008 to 2016 from each of the two warehouses in 2017 (Figure1). After collection, the RPTs were maintained at -20 °C before further processing. Gallic acid, caffeine, theobromine, catechin (C), epicatechin (EC),gallocatechin (GC), epigallocatechin (EGC), gallocatechin gallate(GCG), epigallocatechin gallate (EGCG), and epicatechin gallate(ECG) were purchased from Yuanye Bio-Technology Co., Ltd.(Shanghai, China). Alanine (Ala),glycine (Gly), aspartic acid (Asp),Glutamic acid (Glu), cysteine (Cys), arginine (Arg), valine (Val),serine (Ser), glutamine (Gln), histidine (His), threonine (Thr),proline (Pro), tyrosine (Tyr), tryptophan (Trp) methionine (Met),lysine (Lys), isoleucine (Ile), leucine (Leu), and phenylalanine (Phe)were purchased from Sigma-Aldrich Fluka Co., Ltd. (St. Louis, MO,USA). Theanine, quercetin-3-0-robinobioside, quercetin, rutin, andtheobromine were isolated in our previous study.DL-4-chlorophe-nylalanine was obtained from MedChemExpress (Shanghai, China).Methanol and acetonitrile (LC-MS grade) were purchased fromThermo Fisher (Thermo Scientific, Waltham, MA, USA). Deionizedwater was prepared using a Milli-Q water purification system(Millipore, Billerica, MA, USA). Sample Preparation. Each RPT cake was well dispersed, and 10g of tea leaves were selected randomly from each sample in triplicatebefore being ground into powder. Subsequently, SO0 mg of eachpowdered tea sample was extracted using 7 mL methanol/water (7/3,v/v), which included DL-4-chlorophenylalanine as an internalstandard.8 The extraction was facilitated using ultrasonication(3500 Hz, 30 min each time) at room temperature twice with aninterval of 4 h, followed by 8 h of standing. The supernatants of theextracts were obtained following 10 min of centrifugation at 12 000 g.The supernatants were diluted 30-fold and then placed into vials forLC-MS analyses. A quality control (QC) sample was prepared bymixing an equal volume of each test sample. Samples with finalinternal standard concentrations of 5 mg/L were stored at -20 °Cuntil the analysis. LC-Orbitrap-MS Analysis. The samples were analyzed on anUltra Performance Liquid Chromatography (UPLC) systei(Ultimate 3000, Dionex, Sunnyvale, CA, USA) coupled to a massspectrometer (Q-Exactive Focus, Thermo Fisher Scientific, WalthamMA, USA). Compound separation was performed on an AcquityUPLC HSS T3 column (1.8 um, 100 ×2.1 mm) with a flow rate of0.2 mL/min (solvent A, H,O with 0.05% formic acid; solvent B,acetonitrile with 0.05% formic acid). After injection of 2 uL samples,the ultra-high performance liquid chromatography (UHPLC) systemwas eluted with a linear gradient of 0 min, 2% B; 2 min, 14% B; 3.5min, 15% B; 8 min, 16% B; 10 min, 25% B; 12 min, 30% B; 15.5-19.5min, 100% B;20 min, 2% B;21 min, 100% B; and 22-25 min,2% B.The mass spectrometer was operated in the positive mode with heatelectrospray ionization spray voltage of 3.8 kV, a sheath gas pressureof 40 arbitrary units, an auxiliary gas pressure of 10 arbitrary units, andcapillary temperature of 320 °C. The MS scanning mode was set asfull MS mode with a resolution of 70 000 and scan range of 100-1500(m/z). The MS/MS scanning mode was set as data-dependent ms(dd-ms) scan with a resolution of 17 500, and the high energycollision dissociation was set as a stepped mode with 11, 20, and 60eV. LC-MS Data Processing. Raw LC-MS data sets were convertedinto mzML format by MSConvert. 8 The MS' and MS feature tables,which included information of precursor ion m/z, retention times,IDs, and relative MS intensities of the detected features, wereextracted from the converted data files using Optimus (version 1.5.0,see Supporting Information_4 for the parameters). Meanwhile, twomgf files containing MS data of all detected features and the featureswith MS’ spectra, respectively, were obtained along with the featuretables (Supporting Information 11 and 12). The MS intensities in the MS feature table were normalized by those of the internalstandard using the function of normalization using internal standards inOptimus (Supporting Information_4). The normalized MS feature table was processed using SIMCA-P(version 14.1, Umetrics AB, Umea, Sweden) for principal componentanalysis (PCA, Figure 2), hierarchical cluster analysis (HCA, Figure Figure 2. PCA score plot of RPTs [XJGD _A means combination ofgroups XJ_A (samples XJ_1 to XJ_6) and GD_A (samples GD_1 toGD_4). Group XJ_B includes samples XJ_7 to XJ_9. Group GD_Bincludes samples GD _5 to GD_9]. 3), and orthogonal partial least squares discriminant analysis (OPLS-DA, Supporting Information_3) to investigate the metabolomicprofile attributes of the RPTs. The candidate features distinguishingthe metabolomic profiles of the tea samples were identified usingOPLS-DA modeling with combined thresholds of variable importancein projection (VIP)>2 and Q<0.05. The MS mgf file was uploaded to the GNPS infrastructure formolecular networking. Subsequently, a data set was downloaded byclicking the Download Cytoscape Data tab in the job status page(https://gnps.ucsd.edu/ProteoSAFe/status.jsp?task=facb60281f854d1682f00e94eSlaa0ef) and was imported into Cyto-scape (version 3.7.0) for molecular network visualization (Figure 4).The discriminating features picked by the multivariate statisticalanalysis were annotated by means of authentic standard comparison,GNPS multilibraries matching, and SIRIUS 4, which is an in silico toolfor structure calculation based on MS/MS spectra (SupportingInformation _1 and 2).4 To visualize the relative variation of the discriminating featuresacross the samples, data tables including the feature intensities andannotation results were processed using the “pheatmap"package in Rprogram (version 3.5.1, see Supporting Information_8 for the codes)for heatmaps and clustering illustrations. The cloud plot (Figure 5D)was generated using the bubble chart function in Excel (MicrosoftCorp., Redmond, WA, USA) from a table including the retentiontime, m/z, and fold change of the discriminaties,ng features. Statistical Analyses. The scaling type was set as Par for PCA,OPLS-DA, and HCA in SIMCA-P. The intensity differences for eachfeature among the three clustered groups of chemical profiles wereevaluated according to the Q-values, which were calculated using the Student’s t-test followed by false discovery rate analysis using the"p.adjust" function in R. Difference was considered significant whenthe Q-value was less than 0.05. E-Tongue Measurements for the Taste Strength. The E-tongue (TS-5000Z, INSENT, Japan) which comprises the sensorprobe and the reference probe was dipped into the sample solution orthe standard solution to record the membrane electrical potentialvariation in the measurements. The sensor probe was consisted of alipid/polymer membrane, an Ag/AgCl electrode, and an internalcavity filled with a 3.3 M KCl aqueous solution saturated with AgCl.According to the “Methodology of Sensory Evaluation of Tea", thesuitable proportion of tea to water applied in the measurements is1:50)(g/mL)A total of 3 g of each tea sample was infused with 150mL distilled boiling water for 5 min to obtain a tea soup, which wascooled to40℃ ffor the potentiometricmeasurements. Thisexperiment consisted of three measurement phases: sample detectionphase (120 s), "aftertaste” detection phase (40 s), and cleaning phase(10 s). During sample detection phase, the data from 110 to 120 swere collected to calculate average value to be final result. Then, thetaste strength of tea soup was measured in 4 times to get the averagevalue, and each sample was measured in triplicate on the same day.To assess the correlation between the discriminating features and lE-tongue taste scores, the package "corrplot”in R program(version3.5.1, see Supporting Information_8 for the codes);)wasusedttoperform Spearman correlation analysis (p <0.05). RESULTS AND DISCUSSION Metabolomic Profling. The principal components 1 and2 in the PCA explained 31.7 and 20.0% of the total variance,respectively, for the data in the MS feature table of all RPTs(Figure 2). The QC samples were in the center of the PCAscore plot (Supporting Information_14) which indicated goodreproducibility and stability of the LC-MS measurements. TheHCA provides a visual overview of the sample relationships byplotting the respective dendrogram and their connectionssimultaneously. Based on the results of PCA and HCA, weselected 2000 of the Euclidean distances to be the groupingcriteria which indicated a discrimination of the samples intothree groups (Figure3). The discrimination was validated asreliable by using a permutation test of the OPLS-DA model(Figure S1 in Supporting Information_3). The grouping results indicated that both the storage timeand environment influenced the chemical profile of the RPTs.The first group (XJGD_A) included the samples XJ_1 toXJ6, and GD_1 to GD_4, which indicated that the RPTsstored in the dry-cold and wet-hot environments had similarchemical profiles during their early storage period. However,the chemical profiles in the two environments became distinctwith an increase in the storage time. The other two groups,namely, XJ_B and GD_B, were composed of XJ_7 to XJ_9and GD _5 to GD_9, respectively (Figures 2 and 3). The RPTchemical profiles in the dry-cold environment were discrimi- OADs Figure 4. Feature-based molecular network of metabolites in RPTs detected by the UHPLC-Orbitrap-MS/MS. [The nodes with color representthe discriminating features of the project. The size of nodes and their labels are correlated to the intensities of the corresponding features. The edgewidth represents the cosine score (0.6-1.0) between the two connected nodes. OADs: organic acids and their derivatives; MDSDs:monosaccharides, disaccharides and their derivatives; and UFAs: unsaturated fatty acids]. nated from the 7th year, while the chemical profiles of RPTs inthe wet-hot environment were discriminated from the Sth year.This result indicated that the RPT in wet-hot switched theirchemical profiles earlier than those in dry-cold environment incourse of storage. In addition, XJ_B was clustered closer toXJGD_A than GD _B in the HCA (Figure 3), which indicatedthat XJB had a chemical profile which was more similar tothat of XJGD _A than GDB. Molecular Networking of the Features from RPTSamples. To achieve the goal of a global metabolomic analysis, we implemented GNPS molecular networking for themetabolites in the RPTs. The size of each node is the averageof all samples which correlated to the intensities of thecorresponding features. In the present study, a total of 7471nodes were displayed in the global network (Figure 4,Supporting Information_13), which indicates that the MS/MS spectra of 7471 features were obtained in the UHPLC-Orbitrap-MS analysis. Among them, 33 features wereannotated with level 1, and 429 features were annotated withlevel 2 and level 3. According to 2007 metabolomics standards Figure 5. Information of the 158 discriminating features for the RPTs across GDA and GD_B. (A) Heatmap representing the semiquantitativeresults: (a) VIP values, (b) logz(FC) values, (c) annotation levels, and (d) chemical classes (e) of the 158 discriminating features (the heatmaps ofeach feature were aligned across a-e). (B) Flavoalkaloids (a), theanine (b), and flavan-3-ols (c) as nodes represented in the annotated feature-based molecular network, which is at the bottom of the plot. [The arrows are showing the corresponding relationship between the specific features(5A) and the nodes in the network (SB) one by one. The representation of the nodes in 5B is different from those in Figure 4 or 6C for weimported the semiquantification data from the MS’ feature table into the network and made a ring chart for the nodes to represent the relativequantitation information between groups GD_A and GD_B.] (C) Scatter plots of logz(FC) values of the discriminating gallated and nongallatedflavan-3-ols, as well as gallated and nongallated flavoalkaloids. (D) Cloud plot of the discriminating features which were generated by a slightlymodified method reported in ref 26. [Each bubble is corresponding to a discriminating feature. The total ion chromatograms for all samples and thetime-dependent composition of the mobile phase are illustrated in the plot. The features with increased intensities are showed on the top, whereasthose with decreased intensities are showed on the bottom of the plot. The size of each bubble corresponds to absolute log(FC) value of thefeature. The x and y coordinates of each feature correspond to its retention time and the m/z ratio, respectively. The colors of the features arecoded based on their chemical classes.] (E) Violin plots of absolute values of log(FC) (a) and retention times (b) between the increased anddecreased discriminating features. (The violin plot of SEa shows no significant difference between fold change values of the increased and decreaseddiscriminating features. While that of SEb demonstrates that the retention times of the increased features are significantly higher than those of thedecreased ones.) (F) Figure legends for 5A and SD (**:p<0.01; *: 0.01
-
1/10
-
2/10
还剩8页未读,是否继续阅读?
继续免费阅读全文产品配置单
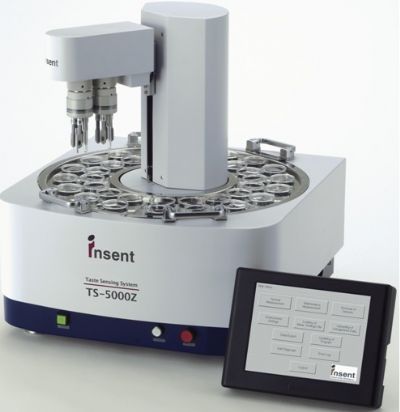
北京盈盛恒泰科技有限责任公司为您提供《普洱茶中品质和风味研究检测方案(感官智能分析)》,该方案主要用于茶叶中营养成分检测,参考标准《暂无》,《普洱茶中品质和风味研究检测方案(感官智能分析)》用到的仪器有日本INSENT味觉分析系统(电子舌)。
我要纠错
推荐专场
感官智能分析系统(电子鼻/电子舌)
更多相关方案


 咨询
咨询