

方案详情文
智能文字提取功能测试中
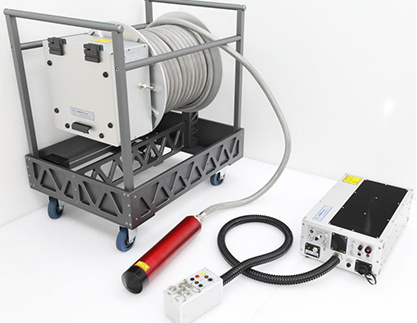
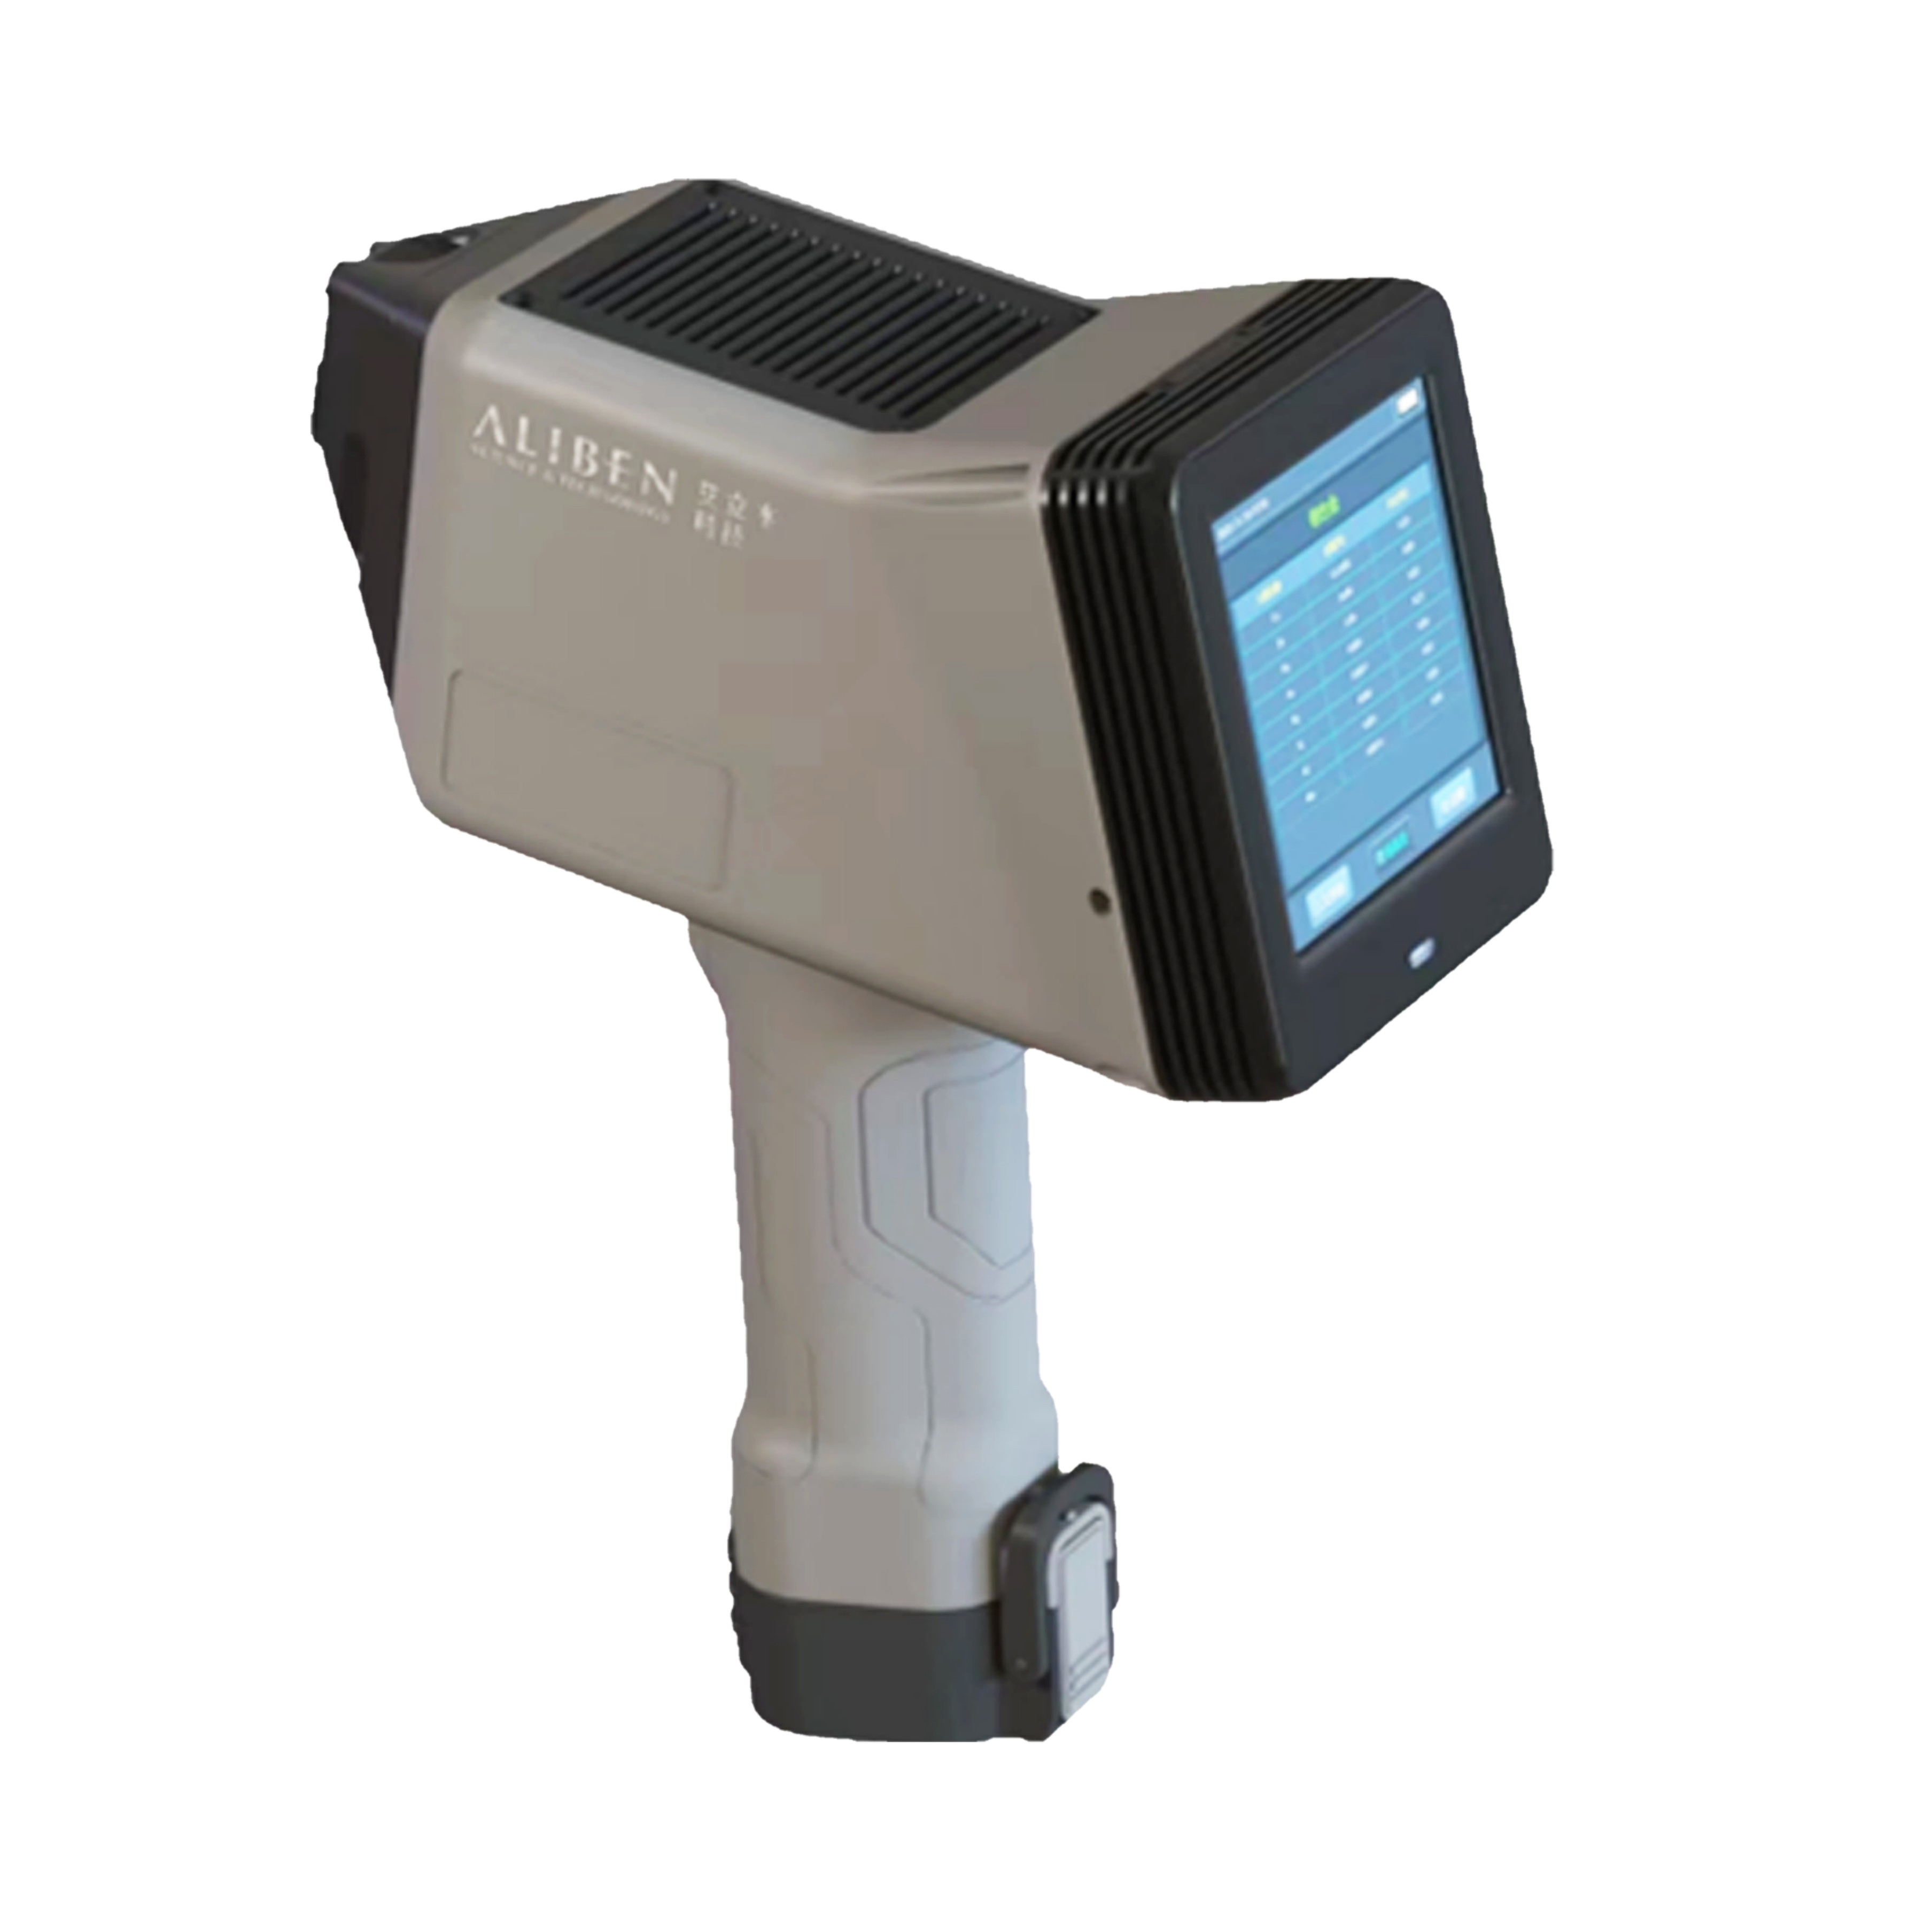
Spectrochimica Acta Part B 112 (2015)10-15Contents lists available at ScienceDirect 11S. Merk et al. / Spectrochimica Acta Part B 112(2015) 10-15 Spectrochimica Acta Part B journal homepage: www.elsevier.com/locate/sab Increased identification rate of scrap metal using Laser InducedBreakdown Spectroscopy Echelle spectra☆ CrossMark S. Merk *, C. Scholz,S. Florek", D. Mory LTB Lasertechnik Berlin GmbH, Am Studio 2c, 12489 Berlin, Germany DISAS Berlin-Leibniz-Institut fiir Analytische Wissenschaften ISAS e.V.,Germany ARTICLEINFO ABSTRACT Article history:Received 22 January 2015Accepted 28 July 2015 Available online 5 August 2015 Keywords: LIBSEchelleClassificationChemometricsIndustrial application In this paper we address the application of an Echelle spectrometer for metal sorting tasks using laser inducedbreakdown spectroscopy in the industrial environment.Echelle spectrometers guarantee the simultaneous de-tection of broad spectral intervals with sufficient spectral resolution, which is highly desirable for LIBS applica-tions. Until today, this benefit was overshadowed by the reduced speed of detection which typically could notexceed 10 frames per second. In this paper we present a newly developed high speed classification setup forscrap metal sorting, equipped with an Echelle spectrometer, capable of classifying 25 samples per second usinga single burst double pulse excitation, a fast EMCCD camera and an externally triggered, chopper based timing.Different multivariate discriminatory techniques (PCA, PLS-DA) are applied and compared to gain maximumuse of the spectra created by this setup. A simultaneous discrimination of 10 classes was done with>90% correct-ness for most classes and an analysis of possible sources of error unique for non-laboratory experiments ispresented. C2015 Elsevier B.V. All rights reserved. 1. Introduction Laser induced breakdown spectroscopy (LIBS) is a well-known ana-lytical tool with one of the major strengths being its speed. Therefore itis a method of choice in high throughput applications where a largenumber of individual analytical information is required within a shorttime [1-4]. Sorting of scrap metal is such an application. In a typicalrecycling situation, pieces of scrap metal are being shred and afterwardssorted by their elemental content. The composition of the material to besorted varies widely and every single piece needs to be analyzedindividually. As LIBS does not require (almost) any sample preparation and is ca-pable of performing contact less analysis [5], it is a promising candidatefor such an application. Several applications of applying LIBS to sortingor generally speaking classification tasks have been reported in the liter-ature already [3,6-12]. Due to the requirement of high sample through-put, detection speed is the limiting factor in most cases. Therefore, up tonow mainly Paschen-Runge or Czerny-Turner spectrometers coupledwith photomultiplier tubes or linear CCD detectors are being widelyused [4,13]. Echelle spectrometers seem to be particularly suitable for LIBS appli-cations due to their high spectral resolution, the broad simultaneously ( ☆ S e lected papers p r esented at the 8th International Conference on Laser-Induced B reakdown Spectroscopy (LIBS) i n Beijing, China,8th-12th September, 2014. * Corresponding author.Tel.: +49 30 912075308. ) ( E-mail address: sv e n . m er k@ l t b - berlin .de (S . Merk). ) ( h t t p://dx. d oi.org/ 1 0. 1 01 6 / j .sa b.2 015.07.0 09 0584-8547/O2015 Elsevier B.V. All rights r eserved. ) detectable wavelength range and the compact setup. But the twodimensional character of the Echelle spectrum pattern requires, particu-larly for high-speed sorting, a fast and sensitive 2D-array detector.Normally ICCD-cameras which provide the required time resolutionto separate the specific atomic emission from the unspecific Brems-strahlung are used as detectors for LIBS Echelle spectrometers. But com-pared to state-of-the-art back-thinned CCD and EMCCD detectors thesecameras are typically expensive, big and are affected by lower spatialresolution and reduced quantum efficiency of the image intensifierphotocathodes. The development of fast and inexpensive 2D EMCCD cameras [14]has allowed us to build the first high speed sorting setup based on re-mote LIBS detection by an Echelle spectrograph. The necessary time res-olution is realized by a fast rotating chopper wheel [15] in front of theentrance slit. In the application shown in this paper the chopper is syn-chronized with the experimental setup and the conveyor belt as an ex-ternal trigger source. Contrary to ICCD cameras, in this way the fullspatial resolution and the high UV quantum efficiency of the CCD detec-tor can beused for high performance spectrum recording [15,16]. Such asystem has a very high versatility for performing different, even varying,sorting tasks which is the first key point of the present work. To make use of the large number of spectral information covered byan Echelle spectrum, multivariate data analysis can be applied. Severalchemometric methods for discriminant analysis of LIBS spectra havebeen shown in the literature [11,17-191. As speed is an issue in sortingapplications, algorithms need to be evaluated not only by their classifi-cation correctness but also by the time needed to apply them to new unknown samples. In the final application of the system, most of thetime will be consumed by the camera readout and only little time isleft for data treatment. Due to this speed issue, we have limited our-selves to the simple chemometric methods principle components anal-ysis (PCA) and partial least squares regression discriminant analysis(PLS-DA). The other key point of this work is the comparison of a dis-crimination based on both techniques when applied to unknownsamples. 2. Theoretical 2.1. Classification by PCA and PLS-DA Details on PCA and PLS-DA algorithms can be found in the literature[11,20-22] and will not be repeated here. In this paper we only want topinpoint the major differences of both techniques that influence the re-sults presented in this work. While PCA is an unsupervised method, PLS-DA is a supervised one. This means, that during training, PCA finds themajor differences in the measured spectra, represented by the principalcomponents. However, the spectral features found by this approach donot necessarily contain any information useful for the application of in-terest. This may effectively result in a grouping of spectra according toother than the required properties. Such a possible grouping failure re-quires a good validation process in order to detect potential systematicmisclassification in the later application. On the contrary, PLS-DA takesin advance the expected grouping as an input and tries to find onlythose features, called factors,(e.g. emission lines) useful for the request-ed task. Still, the classification quality should be evaluated by validation. The typical validation approach for both techniques is cross valida-tion [23,24]. For cross validation, some of the training spectra are leftout during model building and later classified with the model createdusing the remaining spectra. This process is repeated several times, al-ways taking other spectra for the validation set, and classification errorsare estimated. Another validation approach is to create a separate vali-dation set of spectra that is not included in the modeling set. This ap-proach can be applied if a large number of measurements can beperformed. The benefit of this approach is that the separate datasetcan be taken independently of the model spectra and the test thereforecovers repeatability and helps avoiding overfitting. 3. Experimental 3.1. Instrumentation Experiments were carried out using an adapted version of an Aryelle150 spectrometer (LTB, Berlin). This compact spectrograph,which isonly 210 mm in its largest dimension, features an Echelle gratingwhich separates the spectral range from 240 to 550 nm into 45 diffrac-tion orders focused after prism cross dispersion on the 2D EMCCD cameraRolera em-c²(Qimaging, Canada). The spectroscopic potential of theAryelle optical design has been demonstrated already for combined LIBSand Raman investigations using a laser microscope [25] and in a minia-turized version for planetary research applications [26]. The Aryelle 150,which is based on the latter setup, has a focal length of 150 mm andcomes up with a spectral resolving power 入/A入FWHM of 7500, havinga slit width of 50 um and f/7 aperture, on the small detector area of8×8 mm². The 1004×1002 pixel 14 Bit high speed frame transfercamera is synchronized with the chopper wheel and an external triggersignal created by the conveyor belt. For plasma excitation the doublepulse (DP) laser system Twins BSL (Quantel, France) operating at 25 Hzemitting 2×200 mJ at 1064 nm was used. The laser was focused with afocal length of 800 mm; the beam waist position was located approx.10 mm above the conveyor belt surface in order to provide the bestfocus to the majority of samples with the thickness varying between1 and 30 mm. The first laser pulse was intended to remove paint, dirt oroxide layers whereas the second laser pulse was applied to perform the actual measurement. An inter-pulse separation of 20 us was chosen toallow both pulses to overlap on the target moving by 3 ms and minimiz-ing interaction between plasmas created by both pulses. The focal lengthof the collection optics was fixed at 300 mm to have a high tolerance forvarying measurement distance as a result of varying sample size. For aschematic of the detection system see Fig. 1. Single burst (one doublepulse per sample) measurements were performed allowing theidentification and sorting of 25 individual samples per second. The re-sult of the classification is then sent out to a fieldbus system controllingthe actual sample separation based on the classification result. Themaximum time between sample arrival at the detection system andresult arrival at the fieldbus system must not exceed the transit timeof 40 ms. The fastest comparable system for single piece identificationreported in the literature uses a 40 Hz laser, analyzing the createdplasma with a Paschen-Runge spectrometer [4]. The entire system was designed for robustness against physicaldamage by the samples,strong vibrations in the industrial environmentand dust (IP64). Humidity and ambient temperature fluctuation arecompensated by housing the components in insulated boxes equippedwith active heating and cooling devices keeping every part of the sys-tem at its individual optimal operating conditions. The detection system has no moving parts except for the chopper.Instead, upstream arrangement ensures a constant spacing and posi-tioning of the samples and triggering by a sensor in the final assembly. 3.2. Samples Samples used in this study were shredded pieces of metals of differ-ent elemental composition and of different size and shape taken unal-tered from a recycling facility and no further treatment was applied.Sample heights varied between approx. 1 and 30 mm. Most of the sam-ples were covered by a layer of dirt containing significant amounts ofcalcium. Therefore, most spectra were dominated by the intense emis-sion lines Ca II 393.366 and Ca Ⅱ 396.845 along with other Ca lines oflower intensity. Classification was performed for nine different alloyswith a single main element and one secondary alloy (Ag, Al, Cr, Cu, Fe,Ni, Pb, Sn, Zn and brass) that all needed to be separated from eachother. For most classes, at least 100 individual samples were taken toperform model building and validation measurements. For availabilityreasons, Cr and Sn sample sets contained less samples. 3.3. Data treatment for multivariate classification Data treatment and calculations were performed using a self-writtenclassification module for the spectrometer software Sophi (LTB, Berlin).Calculations were separated into a training phase and an applicationphase. During training, spectra were taken in the lab and models based onthem were built and evaluated by validation. As part of the model build-ing appropriate data pretreatment was evaluated and a multivariatemodel was created and validated using saved data. During optimizationof the modeling parameters, pretreatments such as interpolation,spec-tra rejection by threshold, spectral outlier detection for model building,truncation, normalization, Savitzky-Golay smoothing, binning, differ-entiation and polynomial baseline correction were tested. Becausemost pretreatments must not only be applied during model buildingbut also during model application, the time consumption for applyingthem was equally important as the achieved classification correctness.The pretreatment parameters need to be evaluated for every sortingtask and model individually. The model, containing all information about the required pretreat-ment and the final chemometrics, was saved as a file and transferredto the sorting facility where it was loaded into the spectrometer soft-ware and applied to real time measurements. The benefits of this ap-proach are a high flexibility of the sorting instrument as it can be 4. Results and discussion 4.1. Model building For model building, 100 single burst double pulse spectra for everyspectral class were taken. For most classes each spectrum was takenon an individual sample. Only for Cr and Sn repetitive measurementson some samples were necessary. For PLS-DA analysis, spectra were smoothed, truncated in order torange from 242 to 548 nmand vector normalized. Truncation is donein order to stabilize the system against possible spectral shifts in caseof thermal stress. Before normalization, spectra with peak intensitysmaller than 750 counts (approx. three times noise) were rejected,because at this level, the spectra are dominated by noise. In the applica-tion phase, spectra having such a low maximum intensity will beassigned as class number 0, called trash, to designate that no classifica-tion was possible. Number of factors for the PLS-DA was chosen to benumber of classes minus one, so in the presented case, the PLS-DAmodel was calculated for 9 factors.For PCA analysis the spectral pre-treatment differs from the PLS-DA pretreatment due to the unsuper-vised character of the technique. The spectra were as well smoothedand truncated, but additionally, spectral regions dominated by Ca linesoriginating from the dirt layer on the samples had to be removed toavoid grouping according to the contamination level of the samples. Ad-ditionally, the intensity filter for assigning a sample to trash was raisedto 1500 counts (approx. six times noise) because at lower values thepossibility of misclassifications rose significantly. Finally the spectrawere vector normalized.During tests with cross validation, an optimalnumber of 7 principle components was found and used for the presentedwork. For the industrial application, the optimization goal is to have a largepercentage of correct classifications (number of true positives versus anumber of false negatives) and a low percentage of discarded spectra.Another important measure for the quality of a classification is the puri-ty of the output. It is calculated as the percentage of correctly sortedsamples among all samples that were identified to be of the sameclass (true positives versus false positives). This means, a sample that cannot be classified correctly should be tagged and removed ratherthan be grouped with the wrong box thus reducing the purity of thatoutput. 4.2. Validation and testing with saved spectra To avoid overfitting, validation was always performed with a set ofspectra different from the training data. The model was iteratively im-proved by a stepwise validation approach with increasing complexityof the validation data. In a first step, validation was performed using a dataset consisting of1000 spectra of the same samples used for the training data, taken onanother day but with the same instrument and experimental parame-ters. If in this first step a model was found to properly classify the vali-dation set, another, larger validation set containing 8000 spectra takenwith the same instrument during several independent measurementcampaigns was used. During those measurement campaigns the exper-imental parameters (inter-pulse delay (8-20 us), gate delay (by chop-per, 0.3-1 us), gain (500-800), binning (1×1,2×2), distance of thesample to the fixed focal length optics (±2 cm)) were varied and testedagainst the model created with spectra taken with fixed settings. Thepurpose of this test is to simultaneously check model stability againstlong time changes in the system and to avoid overfitted models. Fig. 2 shows the confusion matrices for the classification of thevalidation data using PLS-DA and PCA as classification models. PCAturned out to show a rather poor classification with the setup used,though preliminary tests using a higher resolution (15,000) spectrome-ter (Aryelle 400, LTB) for model building and validation showed a goodclassification power for both PCA and PLS-DA (data not shown). PLS-DAgives a good classification for most alloys.However, silver and brasssamples can only be classified with 78 and 71% correct assignmentsrespectively. The most false assignments of silver are copper andbrass. This is not surprising because most silver samples were silver-ware which is usually made of an alloy of silver with copper. Up to20% copper is not unusual for such samples. Brass is mainly misclassifiedas copper or zinc. This is also not surprising because both are the mainelements forming that alloy. Similar considerations can be made forother misclassifications. Chromium samples from the junk yard are usu-ally chrome plated steel or brass samples. The same applies for nickelsamples.Additionally, both types of plating are often combined. This PCA 86 25 6 4 5 7 3 5 6 21 1 63 0 1 0 1 0 1 1 2 0 0 40 0 0 0 0 0 0 1 10 0 2 75 0 38 1 0 0 0 0 6 41 0 89 1 0 0 0 1 0 0 0 9 0 21 1 0 0 1 0 1 6 0 1 1 80 0 0 0 0 0 0 0 0 0 0 85 1 0 0 1 0 3 1 1 0 0 68 1 0 0 0 0 0 1 3 1 0 28 Fig. 2.Confusion matrix for the validation of the PLS-DA and PCA model using a separate set of spectra generated similar to the model spectra using the same samples. Values within thesquareare the number of classification results for every class. Row trash is the number of discarded spectra for every class, % correct is the percentage of correct results and the averagecorrectness in the right column of that row.The same applies to the% trash row for discarded spectra. indicates the difficulty for the proper application of a sorting task withreal world samples. Fig. 3 depicts the confusion matrix for PCA and PLS-DA analysis ofthe aforementioned larger validation set. For the PLS-DA, no significantchange in the classification capabilities can be observed.This indicates agood robustness of the model against changes (intentional and uninten-tional) of the experimental parameters. The PCA on the other hand is af-fected by a significant drop in the classification capabilities. Correctassignments dropped to values as low as 7% for zinc and 12% for brass.This indicates that the principle components found during model build-ing are not representative for the samples measured but for themeasurements themselves. In other words, a serious overfitting hashappened that was not detected even with the separate validation setused during model development. This test demonstrates a possible pit-fall when building models for the industrial application, where modelrobustness is of major importance if the sorting machinery is supposedto run 24/7 with as few repeated modeling sequences as possible.Simultaneously, the PCA result presents a good example for the impor-tance of distinguishing between classification correctness and finalpurity of the sorted samples. While iron samples can be classified witha correctness of 98%, the purity of iron samples in the output is only28%, due to misclassification of other samples. The vice versa PLS-DA Fig. 3. Confusion matrix for the validation of the PLS-DA and PCA model with spectra generated using the same system but varying experimental settings. Values within the square are thenumber of classification results for every class. Row trash is the number of discarded spectra for every class, % correct is the percentage of correct results and the average correctness in theright column of that row. The same applies to the % trash row for discarded spectra. PCA 1049 205 11 87 12 361 68 62 49 624 4 632 1 1 3 5 0 3 1 23 0 0 248 0 8 0 0 0 0 0 58 0 8 687 1 470 26 0 0 0 78 264 430 59 999 205 103 315 265 150 3 0 1 48 0 242 2 0 0 0 11 1 25 0 1 2 706 0 0 1 0 0 0 0 0 1 663 0 0 1 2 0 8 0 3 2 0 705 1 1 1 0 0 0 0 3 0 0 40 Fig. 4. Confusion matrix of the PLS-DA and PCA model validation using spectra generated with different experimental setup and settings. Values within the square are the number of clas-sification results for every class. Row trash is the number of discarded spectra for every class, % correct is the percentage of correct results and the average correctness in the right column ofthat row. The same applies to the % trash row for discarded spectra. the purity of the PLS-DA model drops in some cases (e.g. Fe, Zn or brass),however for most classes the classification correctness and purity stay atvalues larger than 90% (Fig. 4). PCA results are more or less the same aswith the larger validation set. The outcome of this test is that the PLS-DAmodel can be made extremely robust against external influences bycarefully selecting appropriate pretreatment algorithms and intensevalidation. 4.4. Online sorting results Based on the observations from the previous sections, tests with on-line sorting of fresh untouched samples on site were performed. Sam-ples were manually preclassified and positioned on the conveyor beltin the same way as the machinery does, in a known order to allow theafterward assignment of classification results to the respective samples.Automatic sample positioning would not allow the estimation of theclassification correctness but the purity only. Because the conveyor PLS-DA 220 2 0 0 0 0 0 0 0 2 7 240 2 1 0 6 0 0 0 16 0 2 70 0 0 1 0 3 37 0 3 182 0 51 1 0 0 1 31 11 34 21 36 34 14 1 7 29 9 0 4 4 0 228 3 0 0 1 2 4 5 0 0 1 68 0 0 4 0 1 0 0 5 0 75 2 0 0 1 0 4 0 3 1 2 87 1 8 1 1 0 0 4 5 0 0 141 Fig. 5.Online sorting results applying the previously validated PLS-DA model to fresh sam-ples at the sorting facility. Classification result iron is usually due to laser hitting the con-veyor belt instead of a sample. Such classification results have been removed in thecalculation of the classification correctness. Values within the square are the number ofclassification results for every class. Row trash is the number of discarded spectra forTSfISHevery class, % correct is the percentage of correct results and the average correctness inthe right column of that row. The same applies to the % trash row for discarded spectra. belt is steel plated, laser pulse misses result in a classification of the sam-ples as iron. Therefore, the classification result iron for other classes isignored and not treated as an error. The test was repeated four timeson two days (two runs per day, Cr, Ni and Pb only once per day) withup to 80 samples per class. The accumulated results are shown in Fig. 5. Also in this test, the typical misclassifications of brass and silver ascopper can be observed. Additionally, an increased amount of rejectedresults relative to previous tests (average of 18% compared to approx.10%) is present. This is due to the fresh dirt crust and dust layer on thesamples which was already worn down on laboratory test samples. Es-pecially for zinc (39%) and aluminum (24%), a significant increase oftrash classifications occurred. This is due to the fact that many samplesof those classes are covered with paint which the laser sometimes failsto penetrate with a single burst even with the double pulse laser used.Such samples would require an even stronger cleaning laser or othermeans of sample cleaning. 5.Conclusion A versatile system for the simultaneous classification of 10 differenttypes of scrap metal typically found on junk yards by the use of a newlydeveloped high speed Echelle system capable of performing 25 mea-surements per second was developed. Because single burst measure-ments are done, this speed translates directly into a sampling speed of25 samples per second. Classification has been done using PLS-DAshowing average classification correctness>88% during online analysiswhich was shown to greatly excel a PCA based on the same data. The ap-proach presented in this paper is versatile and can be extended to othersample classes by simply changing the model data. This versatility ismainly achieved by the use of an Echelle spectrometer coveringawide spectral range simultaneously at high resolution. ( References ) [1] D.W. Hahn, N. Omenetto, Laser-induced breakdown spectroscopy (libs), part ii: re-view of instrumental and methodological approaches to material analysis and appli-cations to different fields, Appl. Spectrosc. 66 (2012) 347-419 (http://as.osa.org/abstract.cfm?URI=as-66-4-347). [2]1A.K. Myakalwar,S. Sreedhar, I. Barman, N.C. Dingari, S.V. Rao, P.P. Kiran, S.P. Tewari,G.M. Kumar, Laser-induced breakdown spectroscopy-based investigation and classi-fication of pharmaceutical tablets using multivariate chemometric analysis, Talanta87 (2011)53-59. ( [ 3] R . N oll, V. Sturm, U. Aydin, D. Eilers , C. Gehlen , M. Hohne, A. Lamott, J. Makowe, J. Vrenegor, Laser-induced breakdown spectroscopy-from research to industry, new f rontiers for process control, Spectroc h im. Acta Part B 6 3 (2008 ) 11 59-1 1 66( A col- l ection of papers presented at the Euro Mediterranean Symposium o n Laser Induced ) Breakdown Spectroscopy (EMSLIBS 2007). http://www.sciencedirect.com/science/article/pii/S0584854708002504). [4]P. Werheit, C. Fricke-Begemann,M. Gesing, R. Noll, Fast single piece identificationwith a 3D scanning libs for aluminium cast and wrought alloys recycling,J. Anal.At. Spectrom. 26 (2011)2166-2174. [5]D.W. Hahn,N. Omenetto, Laser-induced breakdown spectroscopy (libs), part i: re-view of basic diagnostics and plasma-particle interactions: still-challenging issueswithin the analytical plasma community, Appl. Spectrosc. 64 (2010)335A-366A(doi:. http://www.ingentaconnect.com/content/sas/sas/2010/00000064/00000012/art00006). [6]J. Gurell, A. Bengtson,M. Falkenstrom, B. Hansson, Laser induced breakdown spec-troscopy for fast elemental analysis and sorting of metallic scrap pieces using certi-fied reference materials, Spectrochim. Acta Part B 74-75 (2012) 46-50 (6th Euro-Mediterranean Symposium on Laser Induced Breakdown Spectroscopy (EMSLIBS2011).ehttp://www.sciencedirect.com/science/article/pii/S0584854712001450). [7] C. Fricke-Begemann, P. Jander, H. Wotruba, M. Gaastra, Laser-based online analysis ofminerals, ZKG Int. 63 (2010)65-70 (http://cat.inist.fr/?aModele=afficheN&cpsidt=24270723 http://www.zkg.de/download/278235/Online_Fricke_Begemann_dt.-eng._final_100914.pdf). [8]R. Harmon, J.Remus, N. McMillan, C. McManus, L. Collins, J. Gottfried, F. DeLucia, A.Miziolek, Libs analysis of geomaterials: geochemical fingerprinting for the rapidanalysis and discrimination of minerals, Appl. Geochem. 24 (2009)1125-1141. [9] I. Gaona,J. Serrano,J. Moros, JJ. Laserna,Range-adaptive standoffrecognition ofex-plosive fingerprints on solid surfaces using a supervised learning method and laser-induced breakdown spectroscopy, Anal. Chem. 86 (2014) 5045-5052. [10] X.Zhu, T. Xu, Q. Lin, L. Liang, G. Niu, H. Lai, M. Xu, X. Wang, H.Li, Y. Duan, Advancedstatistical analysis of laser-induced breakdown spectroscopy data to discriminatesedimentary rocks based on Czerny-Turner and Echelle spectrometers,Spectrochim. Acta Part B 93 (2014) 8-13 (http://www.sciencedirect.com/science/article/pii/S0584854714000020). [11] J.L. Gottfried, R.S. Harmon, F. C. D. Jr., A.W. Miziolek, Multivariate analysis of laser-induced breakdown spectroscopy chemical signatures for geomaterial classification,Spectrochim. Acta Part B 64 (2009) 1009-1019. [12]C. Jirang, H.J. Roven, Recycling of automotive aluminum, Trans. Nonferrous MetalsSoc. China 20 (2010) 2057-2063. [13] R. Noll, C. Fricke-Begemann, M. Brunk,S. Connemann, C. Meinhardt, M. Scharun, V.Sturm, J. Makowe, C. Gehlen, Laser-induced breakdown spectroscopy expands intoindustrial applications, Spectrochim. Acta Part B 93 (2014) 41-51(http://www.sciencedirect.com/science/article/pii/S0584854714000160). [14] N. Savage, Scientific ccd cameras, Nat. Photonics 1 (2007) 351-353(http://dx.doi.org/10.1038/nphoton.2007.91). [15]M. Mueller, I.B. Gornushkin, S. Florek, D. Mory, U. Panne, Approach to detection inlaser-induced breakdown spectroscopy, Anal. Chem.79 (2007)4419-4426 (pMID:17503765). [16] H. Heilbrunner, N. Huber,H. Wolfmeir, E. Arenholz,J. Pedarnig, J.Heitz, Comparison ofgated and non-gated detectors for double-pulse laser induced plasma analysis oftrace1_5elements in iron oxide, Spectrochim. Acta Part B74-75(2012)51-56 (6th Euro-Mediterranean Symposium on Laser Induced Breakdown Spectroscopy (EMSLIBS2011).http://www.sciencedirect.com/science/article/pii/S0584854712001437). [17] J.B. Sirven, B. Bousquet, L. Canioni, L. Sarger, S. Tellier, M. Potin-Gautier, I.L. Hecho,Qualitative and quantitative investigation of chromium-polluted soils by laser-induced breakdown spectroscopy combined with neural networks analysis, Anal.Bioanal. Chem. 385 (2006) 256-262. [18]|: S.R. Goode, S.L. Morgan, R. Hoskins, A. Oxsher, Identifying alloys by laser-inducedbreakdown spectroscopy with a time-resolved high resolution Echelle spectrome-ter, J.Anal. At. Spectrom. 15 (2000) 1133-1138 (http://dx.doi.org/10.1039/B002190N). [19] H. Fink, U. Panne, R. Niessner, Process analysis of recycled thermoplasts from con-sumer electronics by laser-induced plasma spectroscopy, Anal. Chem. 74 (2002)4334-4342 (pMID:12236340.http://dx.doi.org/10.1021/ac025650v). [20] P.R. Peres-Neto, D.A. Jackson, K.M. Somers, Giving meaningful interpretation to ordi-nation axes: assessing loading significance in principal component analysis, Ecology84(2003)2347-2363. [21] W.Kessler, Multivariate Datenanalyse fur die Pharma-, Bio-, und Prozessanalytik,Wiley-VCH, Weinheim, 2007. [22] P. Geladi, B.R. Kowalski, Partial least-squares regression: a tutorial, Anal. Chim.Acta 185(1986) 1-17 (http://www.sciencedirect.com/science/article/pii/0003267086800289). [23]C. Beleites, R. Salzer, Assessing and improving the stability of chemometric modelsin small sample size situations, Anal. Bioanal. Chem. 390 (2008)1261-1271. [24] M. Pontes,J. Cortez, R. Galvao, C. Pasquini, M. Araujo, R. Coelho, M. Chiba, M. Abreu,B. Madari, Classification of Brazilian soils by using libs and variable selection in thewavelet domain, Anal.Chim. Acta 642 (2009) 12-18. ( [25] M . H oehse, D. Mory, S. F lorek, F. Wer i tz, I. Gornushkin,U. Panne, A combined laser-induced breakdown and Raman spectroscopy Echelle system for ele- mental and m o lecular microanalysis, Sp e ctrochim. Ac t a Par t B 64 (2009) 1219-1227 (DOI:. h t tp://www .scie nced i rec t. c o m/s c ie n c e /artic le/ B6THN- 4 XB R4 MB- 1/ 2/180 6 2 a1 8 f 56 943 59 e 6 0cf8 4 16d75 1 b 0 a). ) ( [ 26] S . P avlov, E . J essberger, H. - W. Hubers, S . Schroder, I . R auschenbach, S. Florek, J . N eumann, H. Henkel, S. K l inkner,Miniaturized laser-induced plasma sp e ctrometry f or planetary i n situ analysis-the case for Jupiter’ s moon Europa, A dv. S pace Res. 48 ( 2011) 7 64-778 ( e uropa Lander: S c ience Goals and I m plementation. htt p: / / www.sc ie nce dire ct .com /s c i ence/ a r ticle/pii/S 02 7 3 1 1 77 1 0 0045 2 7) . ) 激光诱导击穿光谱(LIBS)是一种众所周知的分析工具,其主要优点之一是它的速度。因此,在需要在短时间内获得大量分析信息的高吞吐量应用中,它是一种选择方法。对废金属的分类就是这样一个应用。在典型的回收情况下,碎片金属被粉碎,然后按其基本内容分类。要分类的材料的组合变化很大,每一件都需要单独分析。
关闭-
1/6
-
2/6
还剩4页未读,是否继续阅读?
继续免费阅读全文产品配置单
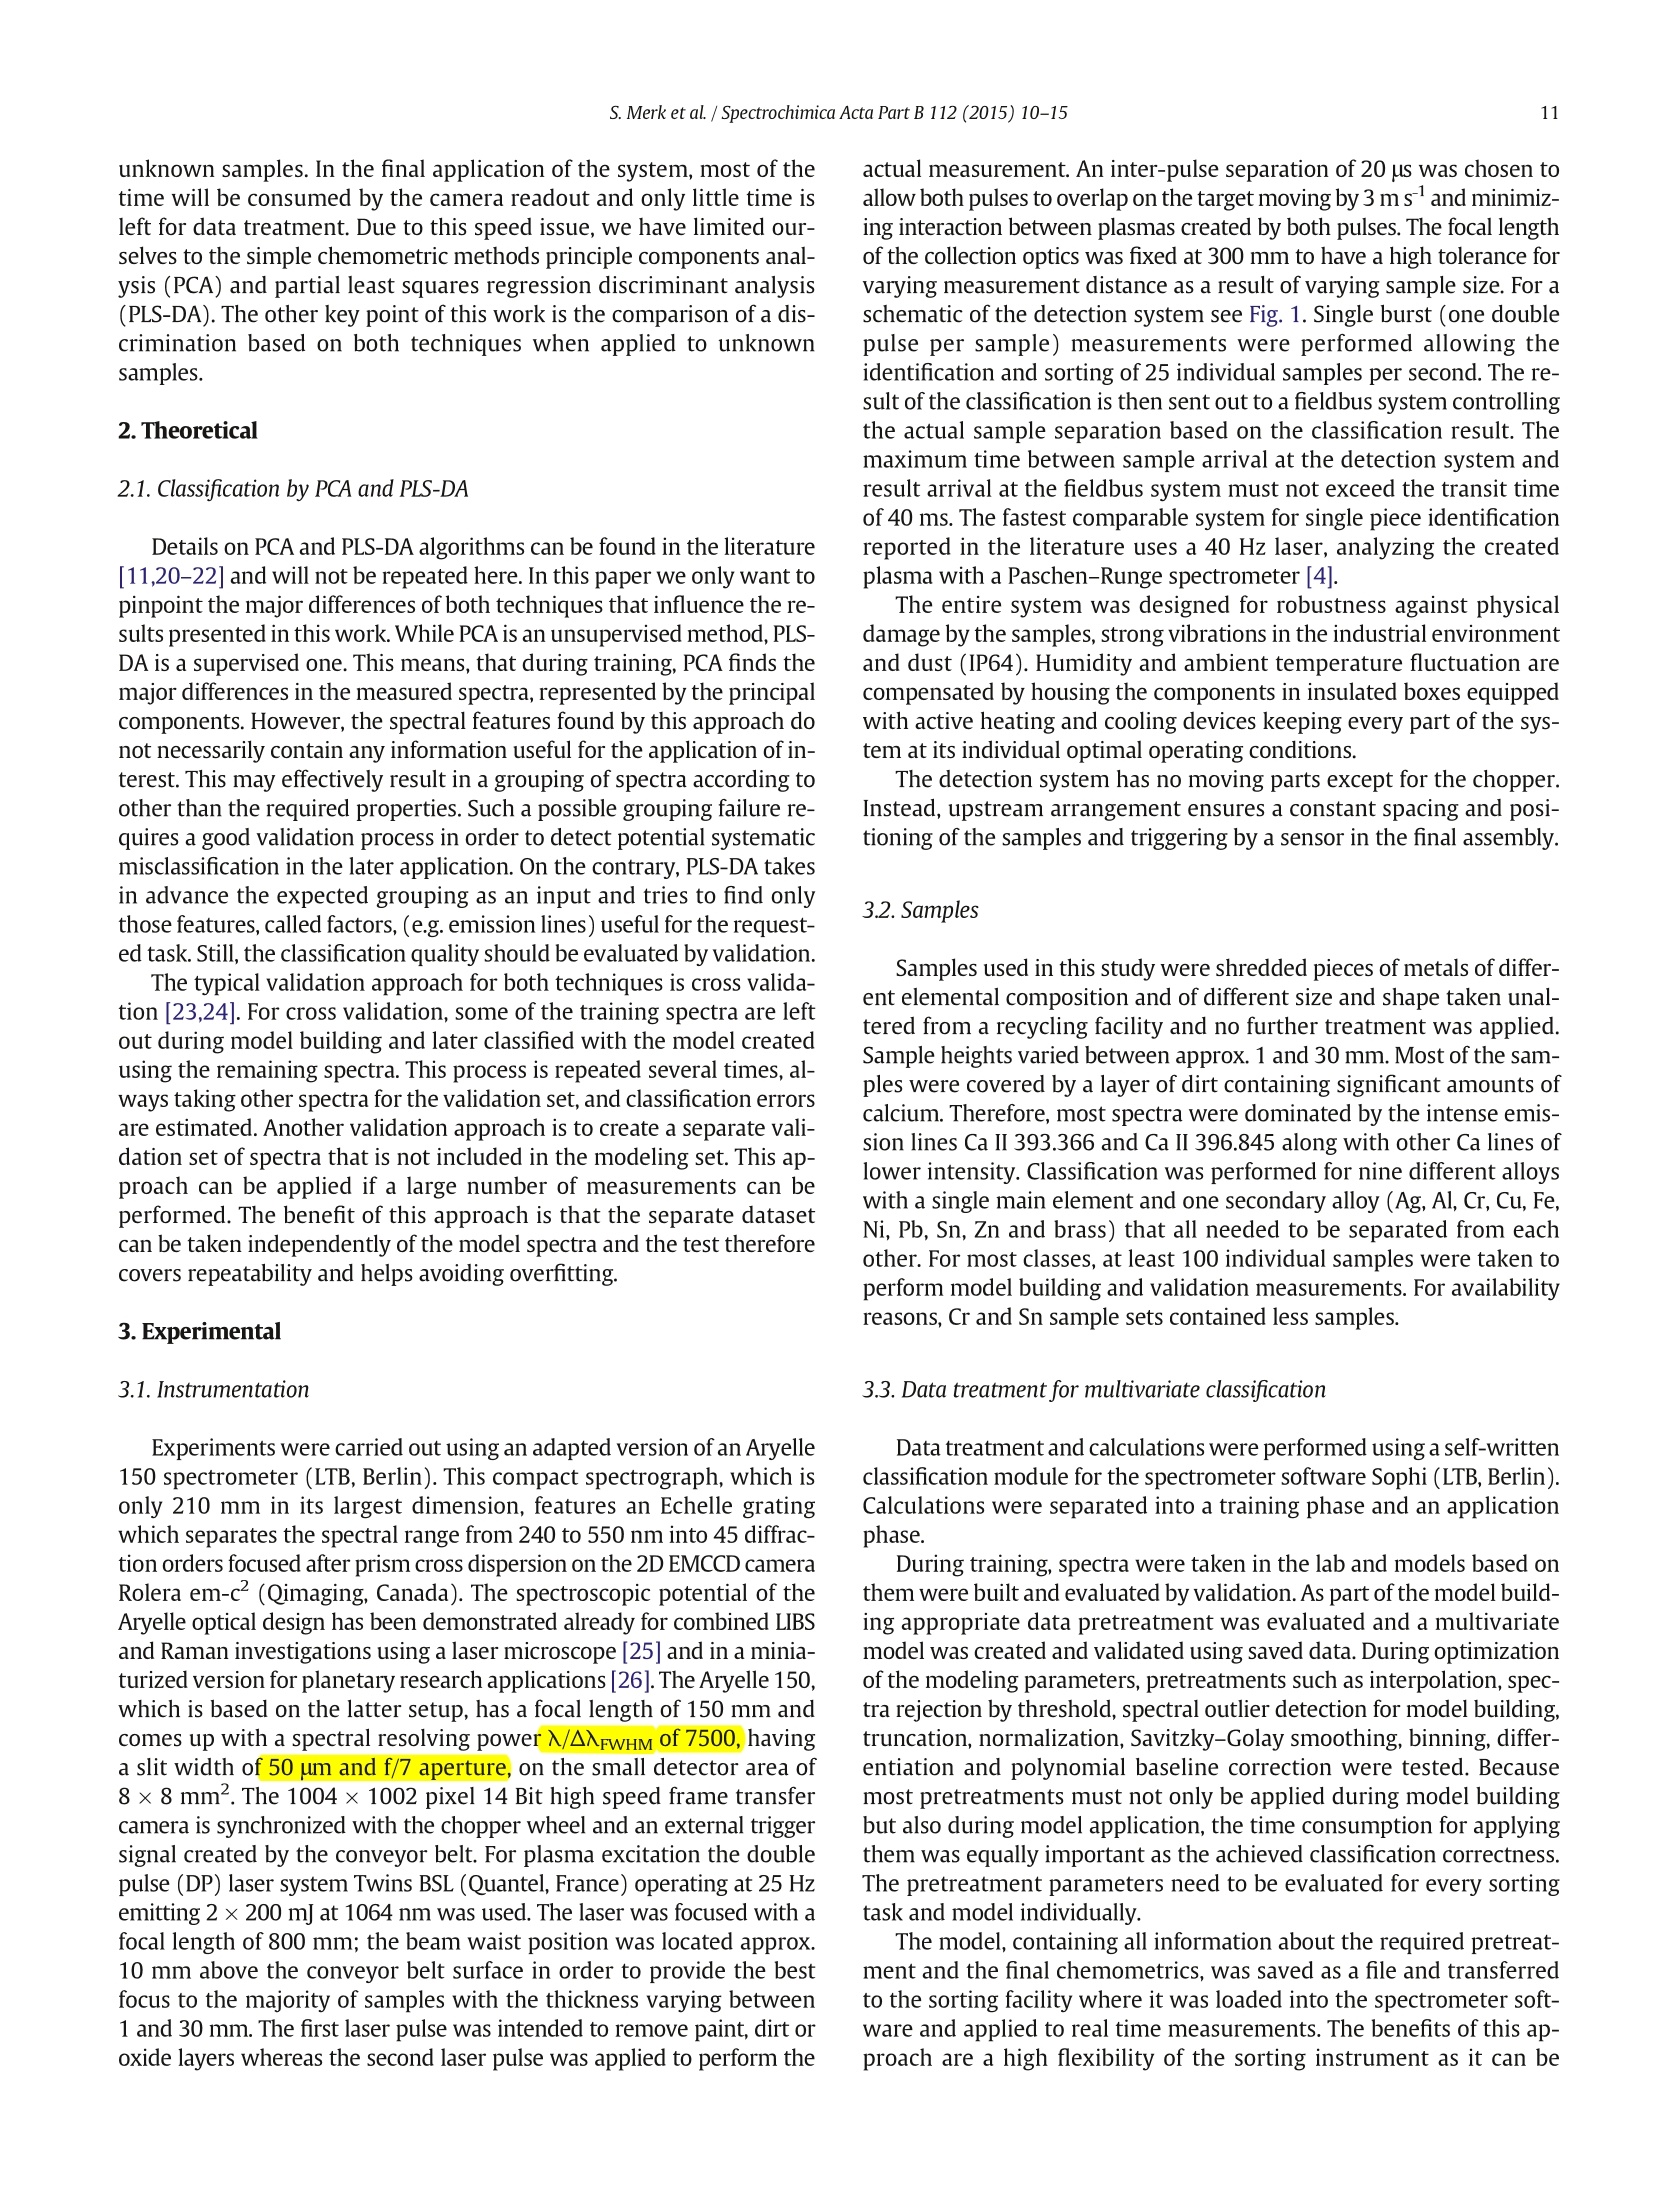
埃德比光子科技(中国)有限公司为您提供《废旧金属中LIBS分类检测方案(激光诱导击穿)》,该方案主要用于其他中其他检测,参考标准《暂无》,《废旧金属中LIBS分类检测方案(激光诱导击穿)》用到的仪器有LTB LIBSorter 激光诱导击穿(LIBS)金属/矿石分选系统。
我要纠错
推荐专场
相关方案
 咨询
咨询