方案详情文
智能文字提取功能测试中
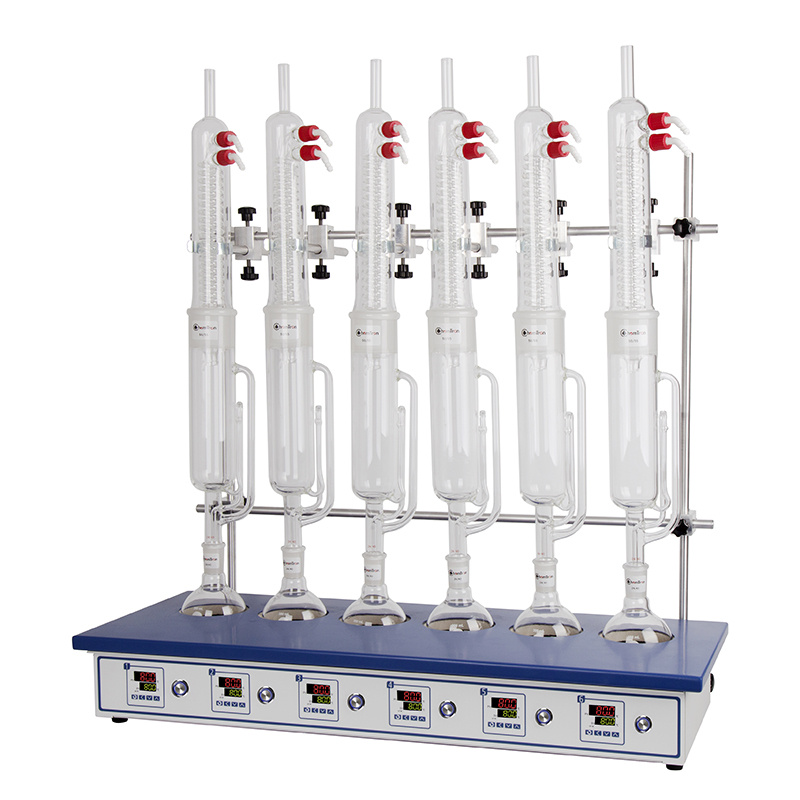
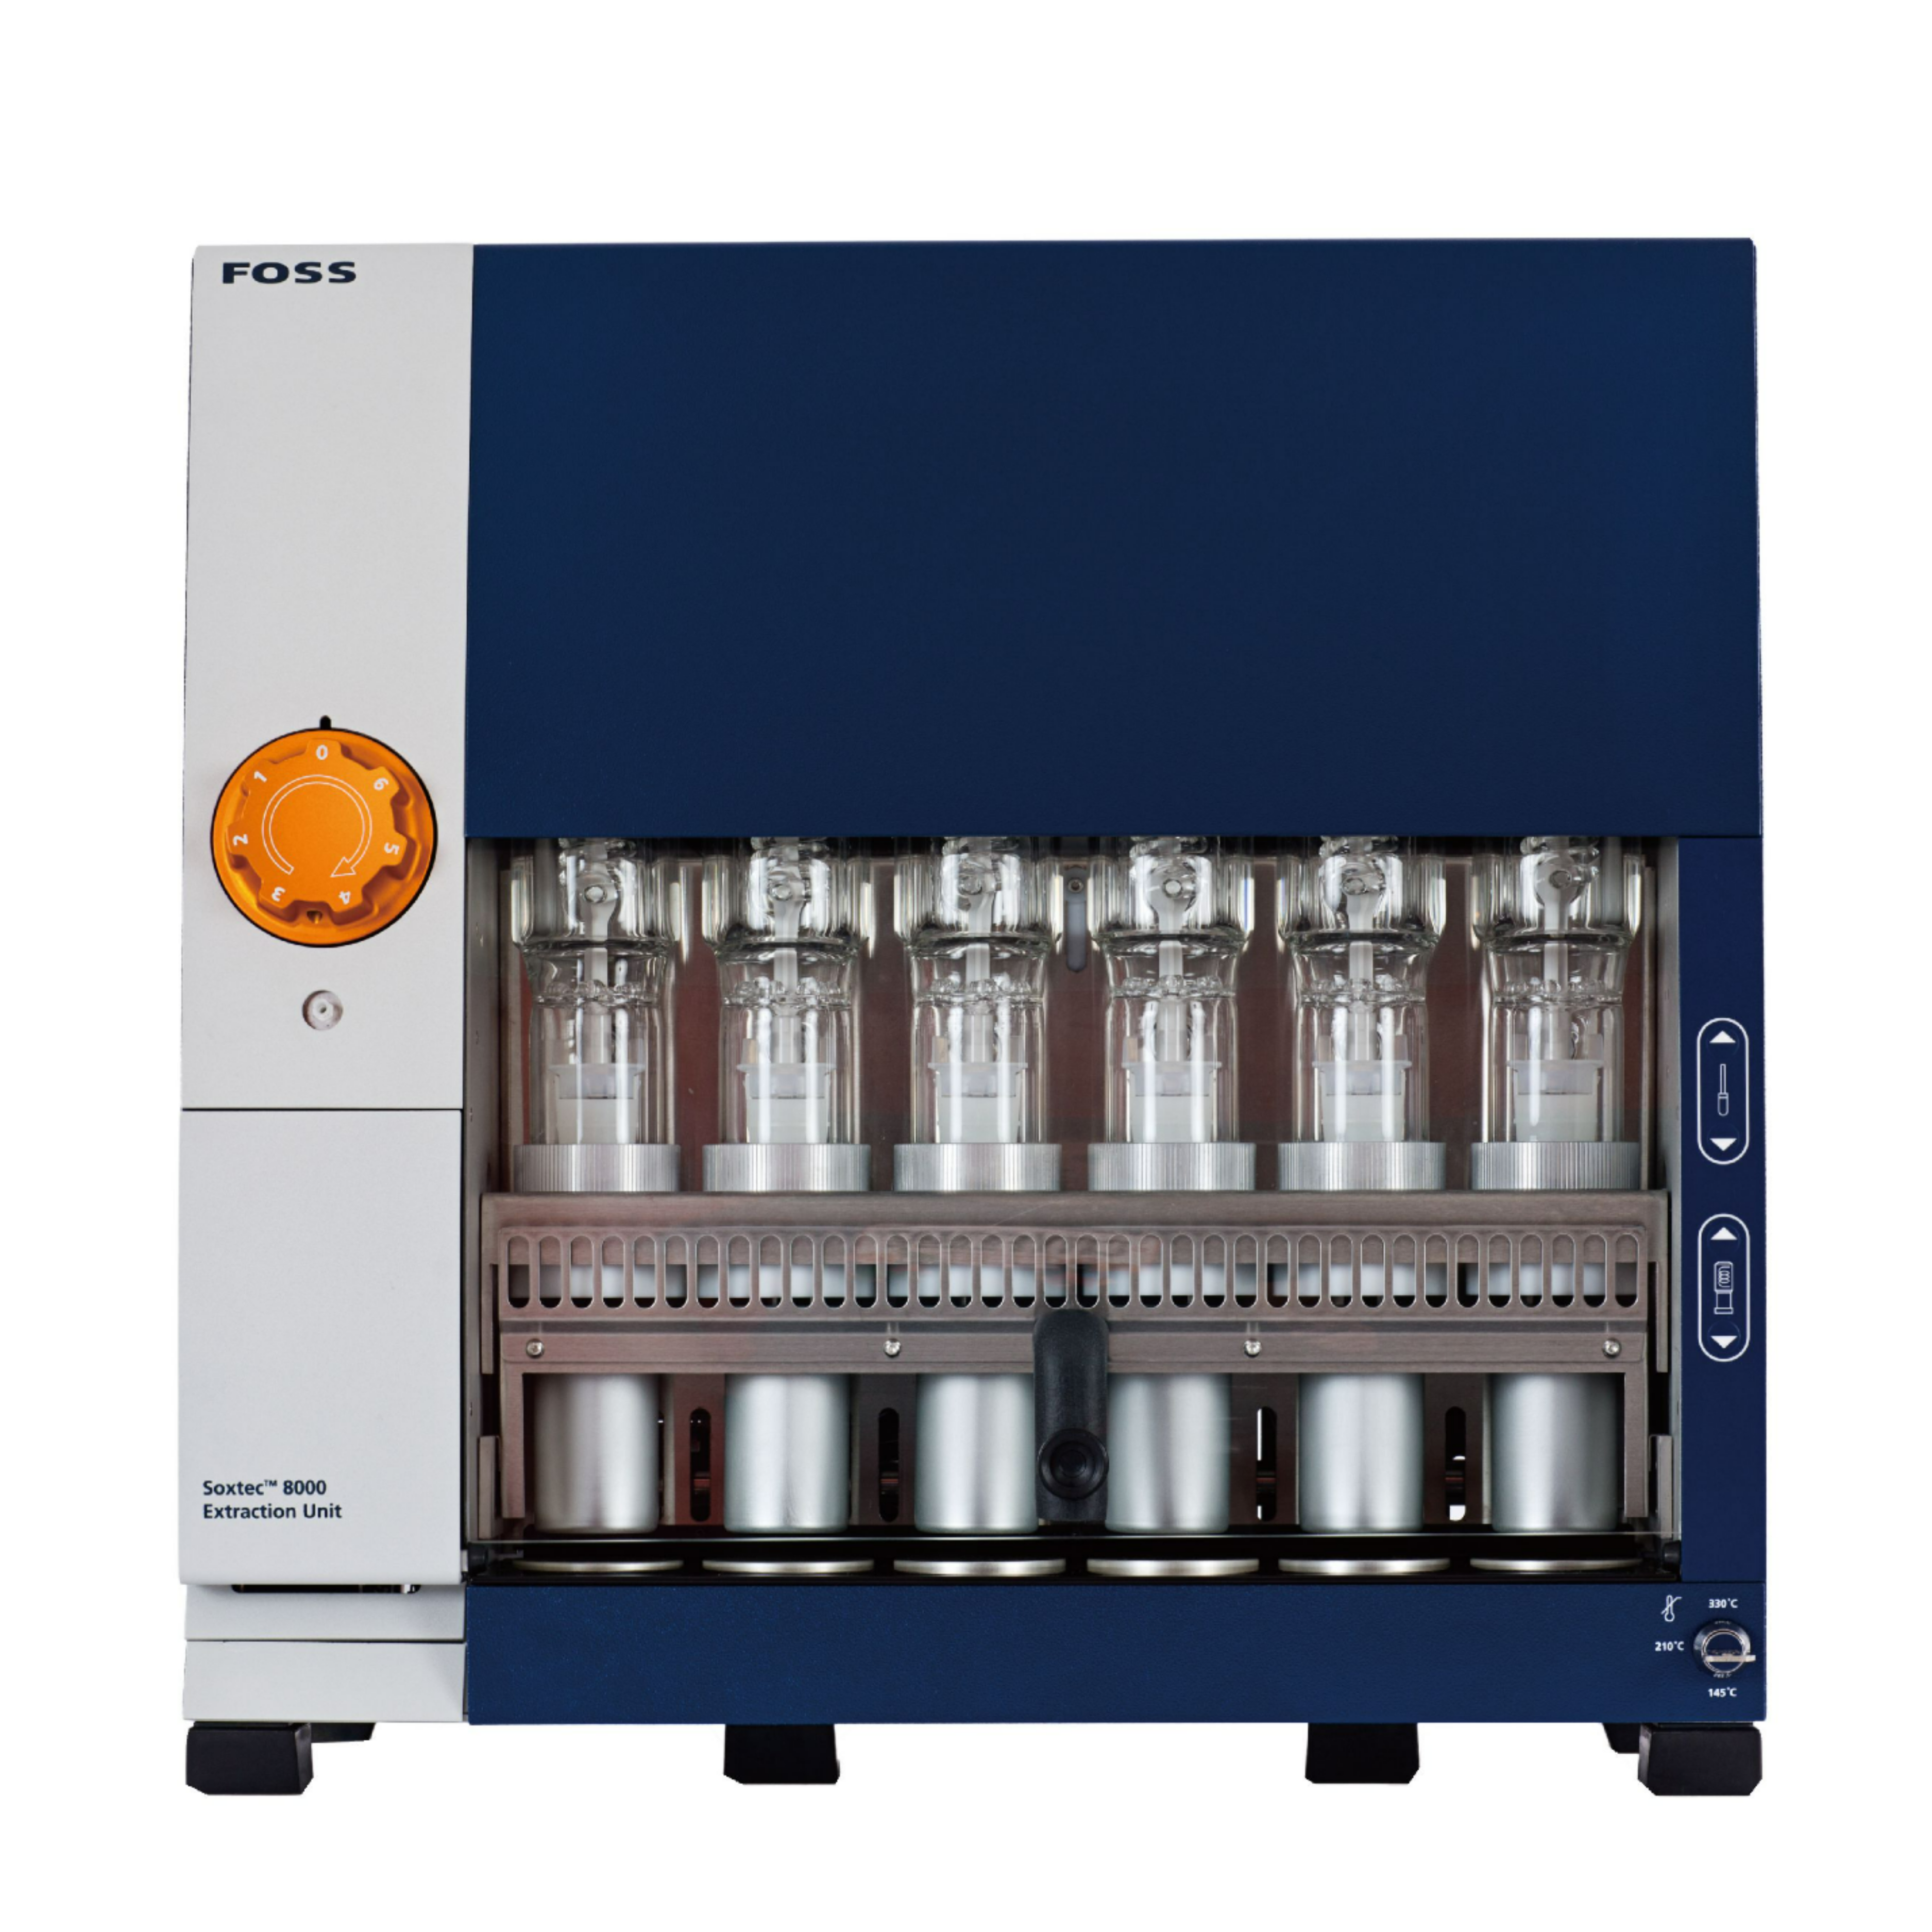
肥尾羊胴体品质的综合研究 A Comprehensive Study of the Quality of Fat-Tailed Sheep Carcasses in Greece.animals 2 of 24Animals 2022,12,1998 Citation: Argyriadou, A.; Tsitsos, A.;Stylianaki,I.; Vouraki,S.;Kallitsis,T.;Economou, V.; Arsenos, G. A Comprehensive Study of the Quality of Fat -Tailed Sheep Carcasses in Greece. Animals 2022, 12, 1998.https://doi.org/10.3390/ani12151998 Academic Editor: Gianluca Negl i a Received: 9 July 2022 Accepted: 5 Augus t 2022 Published: 7 August 2022 Publisher's Note: MDPI stays neutral with regard to jurisdict i onal claims in published maps and institutiona l af fi l -iations. Copyright: @ 2022 by the authors.L i censee MDPI, Basel, Switzerland.This article is an open access article distr i buted under the terms and conditions of the Creative Commons Attribution (CC BY ) l icense (https://creativecommons.org/licenses/by/4.0/) A Comprehensive Study of the Quality of Fat-Tailed Sheep Carcasses in Gr eece Angeliki Argyriadou 1 *D, Anestis Tsitsos2, Ioanna Stylianaki, Sotiria Vouraki 1D, Theodoros Kallitsis 1,Vangelis Economou 2D and Georgios Arsenos 1D 1 Laboratory of Animal Husbandry, School of Veterinary Medicine, Faculty of Health Sciences,Aristotle University, 54124 Thessaloniki, Greece 2 Laboratory of Hygiene of Food of Animal Origin-Veterinary Publ i c Health, School of Veter i nary Medicine,Faculty of Health Sciences, Aristotle University, 54124 Thessaloniki, Greece 3 Laboratory of Pathology , School of Veterinary Medicine, Faculty of Heal t h Sciences, Aristotle University,54124 Thessaloniki, Greece 米 Correspondence: argyrian@vet.auth.gr; Tel.:+30-231-099-9977 Simple Summary: Sheep meat i n Greece is considered a by-product of dairy production, associated with undefined quality and low revenues. Production is based on slaughtering of young lambs and consists of l ight carcasses. Heavy carcasses are scarce and mainly derived from rams and ewes that are no longer appropriate for dairy farming due to age, health or productivity issues; no dietary treatments or fattening protocols are implemented prior t o slaughter. Improving production sustainability implies more efficient use of available resources, including local fat-tailed sheep that are reared in high numbers for their milk, although their carcasses are undervalued; supportive research data are scarce. Hence, we used objective methods to assess the quality of carcasses of fat-tailed sheep slaughtered at different l ive weights (representing five developmental stages, from young lambs to adult sheep) and to compare them with carcasses of thin-tailed sheep, which are considered superior.We found that quality of fat-tailed sheep carcasses was equal or higher compared to thin-tailed.Differences between sexes and developmental stages existed. Slaughtering of f at-tailed sheep at higher l ive weights (50-70% of the average adult sheep weight) will benefit production quality and quantity, i mproving profitability and sustainability of the sector. Abstract: Sheep farming in Greece is focused on milk production. Meat is considered a by-product and consists mainly light carcasses of undefined quality. The main challenge of the sector is to ensure sustainability, and hence efforts are towards efficient use of available resources, including undervalued carcasses of local fat-tailed sheep. The objective here was twofold: (i) to assess the carcass quality of fat -tailed sheep slaughtered at different l ive weights and (ii) to compare them with carcasses from thin-tailed sheep. In total, 146 fat-tailed and 97 thin-tailed dairy sheep were used. They belonged to f i ve l ive-weight categories (LWC), representing 25%, 35%,50%,70% and 100% of mature body weight. Carcass length/weight/yield/pH and wither height were recorded.Muscle f i ber minimum Feret’s diameter and meat color/tenderness/moisture/l ipid and protein content were determined. Sex and LWC differences in fat-tailed sheep were assessed. Parametric and non-parametric tests were used to compare with t hin-t ailed sheep, considering the effects of LWC, sex and t heir interactions with sheep population (fat-tailed/thin-tailed). Most traits were significantly different (p<0.05) between groups of fat-tailed sheep. Carcass yield of fat-tailed sheep was significantly higher compared to t hin-tailed (p <0.01). Interactions of sheep populat i on with LWC or sex affected wither height, carcass pH, meat color and tenderness (p<0.05). Fat-tailed sheep meat quality is equal or higher compared to t hin-tailed. Finishing weights corresponding to 50 and 70% LWC may improve capitalization of fat-tailed carcasses. Keywords: fat-tailed sheep; thin-tailed sheep; carcass; meat quality; dairy sheep 1. Introduction Sheep meat production in Greece comprises more than one-fourth (27.2%) of domestic non-poultry meat production [1] and one-tenth (11.7%) of total EU sheep meat production.Despite the size of the sector, sheep meat in Greece is considered a by-product of dairy production associated with very low revenues [2]. Most slaughtered animals are young lambs (approximately one to three months old). Other categories include ewes and rams removed from production due to age or health problems without any specific dietary treatment prior to slaughter. Hence, the quality of their carcasses is poor, with large variation regarding classification. In practice, such carcasses are sold whole or in halves.Smaller cuts and marketable sheep meat products are scarce. Hence, consumption is mostly seasonal and related to religious or festive occasions [3,4]. In Greece, consumption of sheep meat shows a constant decline and is being replaced by other types of meat (bovine, swine, poultry), for which Greece is less self-sufficient and their production i s less sustainable [5]. One of the major goals of the EU agricultural outlook for the next decade is to achieve more efficient production systems [6]. Regarding meat production in Greece, the notion is that efficient use of available resources will increase self-sufficiency and limit imports. In this context, production of heavier sheep carcasses will allow year-round market supply and will increase the marketability of sheep meat [2,7]. However, production of heavier sheep carcasses requires implementation of special management practices and designated nutrition, considering the large variation in breeds and their crosses comprising the national f lock in Greece that is oriented towards milk production. Moreover, the national flock involves fat-tailed dairy sheep in significant numbers (mostly animals of Chios and Lesvos breeds) that show remarkable resilience in challenging habitats in terms of food availability and temperature fluctuations [8], but their meat production is generally undervalued. To achieve efficient use and better capitalization of sheep meat production in Greece,it is neces sary to define the baseline quality of produced carcasses, without any dietary or other interventions. Special attention should be drawn to fat-tailed sheep carcasses, which are largely considered of lower quality compared to thin-tailed, a perception that affects their marketability, despite the scarcity of supportive scientific evidence. Investigation of possible differences between the two sheep populations of the national flock, fat-tailed and thin-tailed, also considering sex and weight variation, will highlight the strong and weak points of meat production in each case and reveal potential for improvement through the implementation of customized management practices. In this study our objective was twofold: (i) to characterize and assess the carcass quality of fat-tailed sheep reared in Greece and slaughtered at different live weights and (ii) to perform a comparison with carcasses of thin-tailed sheep. 2. Materials and Methods 2.1. Animals and Study Design A total of 146 fat-tailed and 97 thin-tailed dairy sheep of both sexes were used. Animals were selected with the aim of better representing the sheep populations reared in Greece.Fat-tailed sheep were mainly Chios purebreds or their crosses, whereas thin-tailed sheep were crossbreds of the various thin-tailed dairy sheep breeds that are common in Greece.The population of the latter i s greatly diverse, with undefined genetic background;although in some Greek dairy sheep farms, thin-tailed sheep of speci f ic breeds are present or even exclusively bred, most farms use sheep of more than one breed and their crosses. The selected animals came from semi-intensively reared flocks, which represent the most common sheep farming system in Greece; sheep were grazing daily during spring and summer months in natural grasslands, and their diet also i ncluded roughage (wheat straw and alfalfa hay) and a concentrate mix of 16% total protein content, consisting mainly of soya and corn. They were slaughtered at different l ive weights and allocated into f ive different live-weight categories (LWC), representing 25%, 35%,50%,70%and 100% of mature weight,which ranges approximately from 55-80 kg, considering both sexes (Table 1). Table 1. Weight range per live-weight category (LWC). Live-Weight Categories (% of Mature Body Weight) 25% 35% 50% 70% 100% Weight Range (kg) <17.5 17.6-27.5 27.6-39.5 39.6-55 >55.1 Slaughtering took place in two approved commercial abattoirs in Greece, according to EU standards [9]. Prior to slaughter, all animals were weighted (live weight), and their wither height was measured. Carcasses were commercially dressed; light carcasses (25%,35% and 50% of mature weight) included head and viscera (heart, l ungs, liver, internal fat and kidneys). Following carcass dressing and prior to refrigeration, hot carcass weight was recorded; then, carcass yield was calculated as the ratio of carcass weight to live weight. With carcasses suspended by the hind legs, carcass l ength from the base of the tail to the base of the neck was measured [10]. One hour after refrigeration, carcass pH was measured non-destructively, using a portable pH meter (FiveGo pH meter F2, Mettler Toledo, Zaventem, Belgium), on the medial side of the right leg, following muscle incision.The average of t wo consecutive measurements on the same point of incision was calculated.Prior to use, the instrument was calibrated following the manufacturer’s instructions, with two buffer solutions of standard pH, 4.00 and 7.00. 2.2. Sample Collection Samples of randomly selected carcasses from each LWC and sex were obtained for further analysis. Specifically, samples from a standardized area of the psoas major muscle were collec t ed immediately after slaughter, for histological and morphometrical evaluation.In total , 76 samples were collected, 34 of which were from fat-tailed sheep. Furthermore,approximately 24 h after slaughter, meat samples 1-2 cm thick were obtained from the 13th rib of the lef t side of cold carcasses and from a standardized area of the quadriceps muscle in the left hind leg. A total of 99 meat samples from the 13th rib (58 of which were obtained from fat-tailed sheep carcasses) were vacuum-packed and stored at 4°C for six days until t hey were subjected to quality assessment. Last, meat samples from the thigh region (M. quadriceps femoris), 43 in total (27 of which were f rom fat-tailed sheep carcasses)and approximately 100 g each, were vacuum-packed and stored at-20°C until they were used for physicochemical analyses. 2.3. Muscle Histomorphometry 2.4. Meat Quality Assessment Qual i ty assessment of meat samples from the 13th rib included texture profile analysis (TPA), pH measurement and colorimetry. Meat color parameters (lightness-L*, redness一 a*,yellowness-b*) were measured on freshly exposed meat samples directly after unpack-ing, using a colorimeter (CR-410 Chroma meter, Konica Minolta, New Jersey, USA) with 50 mm aperture size, illuminant C and 2°observer. Prior to scanning, calibration of the colorimeter was performed according to the manufacturer's instructions with a white tile of standard parameters (Y: 94.8/X: 0.3130/y: 0.3190). Three consecutive scans perpendicular to the myof i brils were performed at the same position on each sample; between scans, the measuring head of the colorimeter was rotated 90 degrees clockwise. Measured values of L*, a* and b* were averaged over the three scans of each sample, and the mean values were considered for statistical analyses. Mean a and b* values of each sample were used to calculate chroma and hue angle according to the following formulae, as described by the American Meat Society Association [13]: Meat pH measurement and TPA were performed as described previously by [14].Briefly, a portable pH meter (FiveGo pH meter F2, Mettler Toledo, Zaventem, Belgium)was used. The average value of two consecutive measurements on the same point of each sample was used for statistical analyses. A Stable Micro Systems TA.HD plus Texture Analyser with a flat-faced cylindrical 1.27 cm diameter probe and the Exponent software (version 6.1.16.0, Stable Micro Systems Ltd., Surrey, UK) were used for TPA. Oval-shaped pieces (1-2 cm thick) were extracted f rom the center of meat samples and used in a double-compression cycle test. Probe pre-test speed of 1.00 mm/s and test and post-test speed of 5.00 mm/s were i mplemented, achieving a 40% deformation in each cycle. Time be-tween cycles was 2.02 s. The calculated parameters included"Hardness 1","Hardness 2", “Cohesiveness", "Springiness" and "Chewiness" as previously described by Skaperda et al . [14]. The f irst two represented the hardness of meat samples during the f irst and second bite, respectively. Cohesiveness and springiness i ndicated resistance to deformation and capacity of recovering after deformation, respectively, whereas chewiness represented the energy required to chew samples until they can be swallowed [15,16]. 2.5. Physicochemical Properties of Meat Physicochemical analyses of meat samples from the thigh region included measure-ments of total lipid, protein and moisture content. Samples were first comminuted with a Warring laboratory blender. For the estimation of moisture content, 3 g of meat were placed on an aluminum pan and analyzed at 105 °C with a dedicated moisture analyzer (MB27,Ohaus, Parsippany, NJ, USA), according to the manufacturer’s i nstructions.Total lipid content was estimated with the Weibull-Stoldt method, with hydrolysis as the first step and extraction in Soxtherm, according to AOAC method 991.36. In brief, a meat sample of 10 g was placed i nto a beaker.The protein of the sample was digested with boil i ng hydrochloric acid (4 mol/L) in order to break the lipo-protein bonds. Immediately after hydrolysis, the digestion mixture was filtrated with a pleated f ilter moistened with water.After dry in g , the remaining fat was extracted from the filter with petroleum ether of 40 to 60 °C boiling range. Following solvent evaporation, the samples were dried and weighed.Total l ipid content was calculated based on the difference between the i nitial sample weight and the weight at the end of analysis. Total protein was determined according to AOAC Officia l Method 928.08. In brief , 1.5 g of meat was placed in digestion tubes. The organically bound ni t rogen of the sample was digested at 400 °C, with concentrated sulphuric acid and a catalyst, and broken down to ammonium sulphate. After the addition of 32% sodium hydroxide, ammonia was released by water stream distillation and trapped i n a 2% solution of boric acid. The solution was then titrated against a 0.1 mL/L hydrochloric acid solution.The total protein content of the sample was calculated by multiplying the tota l nitrogen content by 6.25. 2.6. Statistical Analyses Data were analyzed with R programming language (software version 4.1.2, R core team, Vienna, Austria) [17]. Descriptive statistics were calculated using "psych" and “dplyr" statistical packages [18,19]. Regarding body (live weight, wither height, muscle fiber minimum Feret's diameter), carcass (hot carcass weight, carcass yield/length/pH)and meat quality traits (meat pH/moisture/protein content/lipid content, TPA parameters— hardness 1, hardness 2, springiness, cohesiveness, chewiness-and meat color traits-L*,a*, b*, chroma, hue angle) of fat-tailed sheep, differences between sexes and LWCs were assessed with non-parametric Mann-Whitney U tests and Kruskal-Wallis one-way analyses of variance, respectively. Following Kruskal-Wallis analyses, Dunn’s tests with Bonferroni correction were used to detect statistically significant differences between groups. The latter analyses were not performed on muscle f iber minimum Feret’s diameter due to the limited number of observations i n some LWCs of fat-tailed sheep (less than four per LWC). Mann-Whitney U tests were also performed to compare fat-tailed and thin-tailed sheep concerning the above traits. The effec t of sheep population (fat-tailed or thin-tailed)on the above traits, when accounting also for the effects of LWC or sex and their interaction with sheep population, was assessed with two-way analyses of variance (ANOVA). The models for the latter analyses were of the following general form: where Yghi is the dependent variable (one of the body, carcass or meat quality t raits,as presented above), u is the overall population mean, SPg is the f ixed effect of sheep population (2 levels: fat-tailed , thin-tailed), LSh is the f ixed effect of LWC (5 l evels: 25, 35,50,70,100% of mature weight) or sex (2 levels: male, female), SPgLSh is the fixed effect of the i nteraction between sheep population and LWC or sex, and eghi is the residual error. Tukey's range tests were performed for post hoc testing to allow for pairwise com-parisons between groups. ANOVA and Tukey's tests including LWC and the interaction effects were not performed on meat moisture, protein content, lipid content and muscle fiber minimum Feret’s diameter, due to lack of observations (less than or equal to 1) in some groups. Homogeneity of variances and normality of distributions were assessed with Levene's test and Kolmogorov-Smirnov test, respectively (p>0.05). Residuals ver-sus fitted and Q-Q plots of the analyses were considered, as well. In the case that the assumptions of homoscedasticity and normal i ty of ANOVA residuals were not met, a non-parametric equivalent Scheirer-Ray-Hare test was performed. Specifically, the effects of LWC, sheep population and thei r i nteraction on l ive weight, carcass length, hot carcass weight , carcass yield, carcass pH, L*, a*, chroma, meat pH and cohesiveness were assessed with Scheirer-Ray-Hare tests. The same applied for the effects of sex, sheep population and their interaction on l ive weight , carcass length, hot carcass weight, carcass yield,carcass pH,muscle fiber minimum Feret’s diameter, meat pH, hardness 1 and 2, chewiness, moisture and l i pid and protein content. Stat i st i cal packages"stats"and"rcompanion" [17,20] were used for the above analyses, and level of statistical significance was set at p = 0.05. 3. Results 3.1. Descriptive Statistics and Quality Assessment of Fat-Tailed Sheep Carcasses Descriptive statistics of all studied traits for both fat-tailed and thin-tailed sheep P P per LWC and sex are presented in Table 2 (a and b, respectively). Mann-Whitney U tests revealed statistically signi f icant differences between female and male fat-tailed sheep re-garding live weight (W= 3184, p<0.05), carcass yield (W=1803,p < 0.001), muscle fiber minimum Feret's diameter (W=59,p<0.01),L*(W=271.5,p<0.05)and hue angle (W=274,p<0.05). The medians of the above traits were lower for females than males; the only excep-tion was l ive weight. Furthermore, larger interquartile ranges were observed for females,except for muscle f iber minimum Feret’s diameter (Table 3). Results of Kruskal-Wal l is one-way analyses of variance show statistically significant differences between different LWCs of f at-tai l ed sheep (Table 4) regarding al l body (live weight: H(4)= 138.39, wither height: H(4)=120.37-p<0.001) and most carcass (carcass length: H aSS (4)=118.27, hot carcass weight: H(4)= 132.36, carcass yield:H(4)=85.46-p<0.001) and meat quality traits (L*:H(4)=24.526-p<0.001, hue angle: H(4)=10.646—p<0.05, meat pH: H(4)=12.333-p<0.05,hardness 1: H(4)= 14.017-p<0.01, hardness 2: H(4)=13.978—p < 0.01, springiness:H(4)= 11.405-p<0.05, chewiness: H(4)= 16.796-p<0.01). Statis t ically significant (p <0.05) pairwise comparisons between mean ranks of LWC for each of the above traits are presented in Figure 1. Regarding body and carcass traits, almost all differences between LWC were significant; the exceptions were 50% with 70% and 70% with 100% LWC. More-over, wither height , carcass l ength and weight of 35% were not significantly different from that of 50% LWC, nor were carcass yields of 25% and 35% LWC. Few significant pairwise comparisons were observed regarding meat color and tenderness traits, most of which were observed for L*and meat chewiness; L* of 25% and 35% LWC differed from that of 70% and 100%, whereas meat chewiness of 25% was different from 35% and 50% LWC and that of 50% from 100% LWC. Differences regarding physicochemical characteristics of meat were not statistically significant (p>0.05). 3.2. Comparison of Fat-Tailed and Thin-Tailed Sheep Carcasses 3.2.1. The Effect of Sheep Population Mann Whitney U tests revealed statistically significant differences between fat-tailed and thin-tailed sheep regarding carcass yield (W=8544.5,p<0.01) and a* (W=923.5,p<0.05). The median carcass yield of fat-tailed sheep was 53.74% compared to 48.77% for thin-tailed sheep, whereas for a*, the respective values were 12.44 and 13.13 (Table 5). 3.2.2. Effects of the Interaction of Sheep Population with LWC Statistically significant results of the two-way ANOVA, inc l uding the effects of the interactions of sheep population with LWC on the studied traits, are presented in Table 6.A detailed version of the table also containing non-significant results can be found in the supplementary materials section (Table S1a). In the aforementioned analyses, the effect of sheep population was statistically significant for wither height (f(1)= 5.53, p<0.05);compared to fat-tailed sheep, thin-tailed sheep were on average shorter by 0.01 m. The re-spec t ive significant effects of the Scheirer-Ray-Hare tests are presented i n Table 7 (detailed version of the table provided in the supplementary materials section-Table S2a); results show that sheep population significantly affected carcass yield (H(1)=7.44, p<0.01) and a*(H(1)=4.23,p<0.05). ANOVA results indicate also t hat t he interaction of sheep population with LWC had significant effects on wither height (f(4)= 3.45, p< 0.01), b* (f(4)=2.56,p<0.05), hue angle (f(4)= 4.63, p<0.01) and springiness (f(4)=3.77,p<0.01). Tukey’s post hoc tests revealed statistically significant pairwise differences between groups, as shown in Figure 2.Scheirer-Ray-Hare tests showed tha t meat cohesiveness (H(4)=11.84, p<0.05) and carcass pH (H(4)=9.80, p< 0.05) were significantly affected by the interaction of sheep population with LWC. Table 2. (a). Descriptive statistics for body, carcass and meat quality traits of fat-tailed and thin-tailed sheep per live-weight category (LWC). (b) Descriptive statistics for body, carcass and meat quality traits of fat-tailed and thin-tailed sheep per sex. Live-Weight Category (% of Mature Body Weight) 25% 35% 50% 70% 100% Trait Sheep 11 Mean (SD) 11 Mean (SD) 11 Mean (SD) 11 Mean (SD) 11 Mean (SD) Fat-tailed 27 13.90(2.176) 38 23.20(2.874) 25 33.46(4.106) 24 46.96(4.646) 32 69.77(10.758) Live weight (kg) Thin-tailed 25 14.07(2.241) 13 21.22(2.365) 14 34.12(3.619) 18 48.57(3.973) 27 67.08(12.135) Fat-tailed 27 0.52 (0.034) 38 0.62(0.047) 25 0.69 (0.055) 24 0.75 (0.037) 32 0.79(0.057) Wither height (m) Thin-tailed 25 0.53(0.040) 13 0.56 (0.046) 14 0.67 (0.055) 18 0.74 (0.039) 27 0.77(0.043) Fat-tailed 25 0.55 (0.039) 38 0.64 (0.041) 25 0.71(0.061) 19 0.80 (0.029) 30 0.90(0.045) Carcass length (m) Thin-tailed 25 0.54 (0.038) 13 0.61 (0.057) 13 0.74(0.055) 12 0.81(0.058) 21 0.87 (0.050) Fat-tailed 27 8.52(1.289) 38 13.48(1.731) 25 16.98(1.891) 24 22.20(3.133) 32 31.59 (5.863) Hot carcass weight (kg) Thin-tailed 25 8.57(1.523) 13 11.09(1.298) 14 17.00(2.315) 18 20.60(2.130) 27 29.66(7.263) Fat-tailed 27 61.59 (5.369) 38 58.27 (4.836) 25 51.41(7.854) 24 47.23 (4.231) 32 45.28(4.878) Carcass yield (%) Thin-tailed 25 60.84(4.294) 13 52.67(7.014) 14 50.09 (6.533) 18 42.42(2.907) 27 43.92(4.460) Muscle fiber minimum Feret's Fat-tailed 1 NA 2 19.57 (0.515) 3 19.28(1.445) 12 23.91(4.484) 16 22.81(6.172) diameter (um) Thin-tailed 8 17.34(1.960) 5 20.52(3.996) 7 22.75(2.891) 5 20.55(2.463) 17 22.97 (5.657) Fat-tailed 25 6.31(0.208) 37 6.49 (0.206) 23 6.36(0.246) 22 6.43 (0.286) 32 6.43 (0.345) Carcass pH Thin-tailed 25 6.35(0.230) 13 6.26 (0.216) 14 6.27(0.277) 16 6.46(0.324) 26 6.48 (0.254) Fat-tailed 7 37.84(2.947) 15 36.30(1.966) 15 35.00(1.901) 11 32.55(2.393) 10 32.69(1.865) Lightness—L* Thin-tailed 10 37.66(1.996) 3 37.35(1.257) 8 35.75(4.141) 8 34.19(1.784) 13 34.25(3.505) Fat-tailed 7 11.65(1.464) 15 12.41 (0.727) 15 12.66 (0.678) 11 12.50(1.219) 10 12.37(1.945) Redness—a* Thin-tailed 10 12.96(1.234) 3 12.35(1.193) 8 13.72(1.541) 8 12.79(1.200) 13 12.22(2.666) Fat-tailed 7 3.17(0.962) 15 4.11(0.907) 15 3.94(0.788) 11 3.40 (0.885) 10 3.15(1.142) Yellowness—b* Thin-tailed 10 4.10(1.291) 3 3.39(0.724) 8 2.96(1.314) 8 3.62(0.988) 13 3.71(1.394) Fat-tailed 7 12.10(1.484) 15 13.10(0.789) 15 13.27(0.791) 11 12.97(1.359) 10 12.79(2.145) Chroma Thin-tailed 10 13.63(1.469) 3 12.81(1.328) 8 14.07(1.747) 8 13.31(1.368) 13 12.79(2.910) Fat-tailed 7 0.27(0.074) 15 0.32 (0.066) 15 0.30(0.051) 11 0.26(0.051) 10 0.24(0.054) Hue angle Thin-tailed 10 0.30(0.074) 3 0.27(0.035) 8 0.21(0.071) 8 0.27(0.059) 13 0.29(0.058) Table 2. Cont. 12 8 8 12 (225.129) 1076.70 8 (547.251) 12 (709.939) Live-Weight Category (% of Mature Body Weight) (224.746) (291.320) 0.75 (0.073) 10 12 0.77(0.091) (343.354) 61.16(4.825) 5 60.21(4.281) 5 0.74(0.097) 4 6 66.14(4.893) NA 0.49 (0.083)0.48(0.053) 61.92(3.957) 2 118 0.51(0.064)0.50 (0.027) 10 12 0.53(0.040) 0.51(0.051) Mean (SD) Fat-tailed 7 5.90 (0.487) 15 5.60 (0.046) 15 5.59 (0.038) Meat pHThin-tailed 10 5.60 (0.062) 3 5.66 (0.044) 8 5.94(0.503) 8 3 11 5.55 (0.041) 5.54(0.049) 13 61.53(7.719) M(70.736) (970.328)(eat hardness7266.121) 1 (g)1117.26 1248.02 1255.87 Thin-tailed 10 3 8 (981.417) (483.990) (533.473) 9.11(6.721) NA 5 3 6.80 (5.764) 4 6 5.04(2.608) Meat hardness 2 (g) 5 22.79 (3.108) 822.40 1306.8015(584.397) (664.038)1000.27 11.59(13.774) 10 8.75 (6.756) Thin-tailed 4 23.40(2.215) Meat springiness Fat-tailedThin-tailed 710 0.88 (0.087)0.79(0.073) 23.71(2.810) Meat cohesiveness Fat-tailedThin-tailed 10 0.43 (0.082)0.53 (0.073) Meat chewiness 7 (366.955) Meat moisture (%) Fat-tailed Thin-tailed 7 7 62.94(3.312) 63.48(6.743) Meat lipid content (%) Fat-tailedThin-tailed 77 Meat protein content (%) Fat-tailedThin-tailed 7 7 Table 2. Cont. Female Male Total Trait Sheep 11 Mean (SD) 1 Mean (SD) 11 Mean (SD) Live weight (kg) Fat-tailed 77 40.34(20.245) 69 34.02(21.351) 146 37.35(20.943) Thin-tailed 58 42.42(22.011) 39 34.11(21.848) 97 39.08(22.213) Wither height (m) Fat-tailed 77 0.69(0.100) 69 0.66 (0.112) 146 0.67 (0.106) Thin-tailed 58 0.68(0.106) 39 0.64(0.114) 97 0.66 (0.111) Fat-tailed 70 0.73 (0.138) 67 0.70 (0.118) 137 0.72(0.130) Carcass length (m) Thin-tailed 45 0.72(0.147) 39 0.68(0.138) 84 0.70(0.143) Hot carcass weight (kg) Fat-tailed 77 19.22(8.296) 69 17.84(9.197) 146 18.56(8.730) Thin-tailed 58 19.38 (9.696) 39 16.52(8.414) 97 18.23 (9.264) Fat-tailed 77 50.91 (9.164) 69 55.44(6.566) 146 53.05(8.330) Carcass yield (%) Thin-tailed 58 48.08 (7.854) 39 53.02(9.216) 97 50.07 (8.727) Muscle fiber minimum Feret's diameter (um) Fat-tailed 22 20.52(2.959) 12 26.22(6.499) 34 22.53 (5.224) Thin-tailed 23 20.45(3.269) 19 22.29 (5.777) 42 21.28(4.609) Carcass pH Fat-tailed 74 6.39 (0.276) 65 6.43 (0.258) 139 6.41(0.268) Thin-tailed 57 6.42(0.267) 37 6.31(0.261) 94 6.38(0.269) Lightness—L* Fat-tailed 26 34.04(3.197) 32 35.45(2.276) 58 34.82(2.793) Thin-tailed 21 34.62(3.328) 21 36.49(2.847) 42 35.56(3.202) Redness—a* Fat-tailed 26 12.27(1.076) 32 12.49(1.283) 58 12.39(1.190) Thin-tailed 21 12.10(2.062) 21 13.50(1.325) 42 12.80(1.852) Yellowness—b* Fat-tailed 26 3.39(1.092) 32 3.87 (0.834) 58 3.65(0.979) Thin-tailed 21 3.08(0.917) 21 4.16(1.325) 42 3.62(1.253) Chroma Fat-tailed 26 12.76(1.226) 32 13.09(1.375) 58 12.95(1.310) Thin-tailed 21 12.50(2.159) 21 14.16(1.529) 42 13.33(2.030) Table 2. Cont . Sex (b) Female Male Total Trait Sheep 11 Mean (SD) 1 Mean (SD) 11 Mean (SD) Hue angle Fat-tailed 26 0.27(0.072) 32 0.30(0.052) 58 0.28 (0.063) Thin-tailed 21 0.25 (0.054) 21 0.30 (0.076) 42 0.27(0.069) Meat pH Fat-tailed 26 5.66(0.272) 32 5.60 (0.103) 58 5.63 (0.198) Thin-tailed 21 5.74(0.354) 21 5.58 (0.066) 42 5.66 (0.264) Meat hardness 1 (g) Fat-tailed 1083.37 1036.00 1057.23 26 (728.458) 32 (740.972) 58 (729.320) 1242.28 1297.61 1270.62 Thin-tailed 20 (860.706) 21 (735.765) 41 (789.523) Fat-tailed 26 868.72 32 809.92 58 836.28 Meat hardness 2 (g) (568.620) (510.389) (533.249) Thin-tailed 20 983.81 (656.025) 21 1041.41 (571.015) 41 1013.31 (606.881) Meat springiness Fat-tailed 26 0.78 (0.096) 32 0.77 (0.113) 58 0.78(0.105) Thin-tailed 20 0.79 (0.101) 21 0.79 (0.096) 41 0.79(0.098) Meat cohesiveness Fat-tailed 26 0.51 (0.057) 32 0.49 (0.076) 58 0.50(0.068) Thin-tailed 20 0.50 (0.054) 21 0.52(0.048) 41 0.51(0.052) 428.51 379.73 401.59 Meat chewiness Fat-tailed 26 (304.327) 32 (226.493) 58 (262.905) Thin-tailed 20 467.90 (308.323) 21 541.58 (298.459) 41 505.64 (301.801) Fat-tailed 11 60.68 (6.833) 14 64.14(4.227) 25 62.62(5.674) Meat moisture (%) Thin-tailed 10 59.65(11.998) 8 61.75(5.600) 18 60.59 (9.501) Meat lipid content (%) Fat-tailed 11 8.82 (5.802) 14 6.43(4.015) 25 7.48(4.921) Thin-tailed 10 8.16(7.441) 8 5.20(5.470) 18 6.84(6.627) Meat protein content (%) Fat-tailed 11 21.59(3.018) 14 20.44 (5.364) 25 20.95(4.441) Thin-tailed 10 22.28(3.764) 8 21.25(1.979) 18 21.82(3.064) NA: Not applicable. Table 3. Results of non-parametric Mann-Whitney U tests performed to compare between sexes of fat-tai l ed sheep (rejection of null hypothesis when p <0.05: Differences between medians of groups are statistically significant, hence groups come from different populations). Traits Female Male 11 Median Interquartile 11 Median Interquartile p-Value Range Range Live weight (kg) 77 39.00 32.00 69 26.50 23.40 <0.05 Wither height (m) 77 0.71 0.13 69 0.65 0.20 0.088 Carcass length (m) 70 0.77 0.21 67 0.66 0.18 0.132 Hot carcass weight (kg) 77 17.80 12.00 69 15.00 9.20 0.143 Carcass yield (%) 77 48.71 13.45 69 56.60 9.02 <0.001 Muscle fiber minimum Feret's diameter (um) 22 19.83 3.68 12 23.98 11.01 <0.01 Carcass pH 74 6.36 0.45 65 6.45 0.33 0.329 Lightness—L* 26 33.75 5.60 32 34.97 2.92 <0.05 Redness—a* 26 12.46 1.50 32 12.37 1.19 0.633 Yellowness—b* 26 3.16 1.74 32 4.01 1.03 0.081 Chroma 26 12.85 1.50 32 13.02 1.44 0.412 Hue angle 26 0.24 0.11 32 0.30 0.06 <0.05 Meat pH 26 5.60 0.08 32 5.59 0.09 0.256 Hardness 1 (g) 26 942.70 1106.05 32 874.54 570.02 0.907 Hardness 2 (g) 26 753.02 815.43 32 713.49 442.66 0.857 Springiness 26 0.79 0.14 32 0.77 0.17 0.790 Cohesiveness 26 0.51 0.07 32 0.51 0.08 0.595 Chewiness 26 357.28 391.83 32 350.22 227.88 0.809 Meat moisture (%) 11 60.50 5.38 14 64.08 4.51 0.106 Meat lipid content (%) 11 7.68 7.93 14 5.34 4.88 0.311 Meat protein content (%) 11 21.92 2.94 14 22.32 3.64 0.891 Table 4. Results of non-parametric Kruskal-Wallis one-way analyses of variance for assessing the statistical significance of the differences between mean ranks of the studied traits for different live-weight categories (LWC-% of mature l ive weight) of fat-tailed sheep (rejection of null hypothesis when p <0.05: There are statistically significant differences between mean ranks of groups). LWC1 Traits 25% 35% 50% 70% 100% p-Value Live weight (kg) 14.000a 46.500b 78.000C 102.833 cd 130.250d <0.001 Wither height (m) 16.611a 48.855b 77.420 bc 106.813 cd 122.719 d <0.001 Carcass length (m) 15.820a 47.434b 70.560 bc 97.184 cd 121.483d <0.001 Hot carcass weight (kg) 14.370a 48.303b 77.000 bc 102.750 cd 128.641d <0.001 Carcass yield (%) 115.630a 101.605a 65.780 bc 42.667 cd 33.734d <0.001 Carcass pH 52.080a 81.338a 62.609a 71.068a 75.469a 0.055 Lightness—L* 45.429a 39.200a 30.867 ab 14.091b 18.700b <0.001 Redness—a* 21.786a 29.767a 33.233a 30.500a 27.800a 0.674 Yellowness—b* 21.429a 37.100 34.000a 25.500a 21.400a 0.071 Chroma 19.571a 32.000a 33.733a 29.545a 26.300a 0.399 Hue angle 26.714 ab 37.533a 34.467 ab 23.909 ab 18.100b <0.05 Meat pH 43.929a 31.933 ab 28.533 ab 16.364b 31.650 ab <0.05 Hardness 1 (g) 45.714a 27.367 ab 20.867b 25.682 ab 38.500 ab <0.01 Hardness 2 (g) 44.857a 27.400 ab 21.000b 25.182 ab 39.400 ab <0.01 Springiness 46.214a 21.033b 29.900 ab 26.636 ab 33.050 ab <0.05 Cohesiveness 13.500a 28.733a 30.767a 31.136a 38.150a 0.058 Chewiness 46.429a 24.400 bc 21.600 bd 26.000 acd 41.000 ac <0.01 Meat moisture (%) 12.714a 11.000a 9.200a 15.600a 17.000a 0.486 Meat lipid content (%) 11.571a 14.750a 17.000a 11.800a 10.250a 0.617 Meat protein content (%) 10.714a 5.250a 16.400a 15.200a 17.750a 0.082 1 % of mature live weight; ab.cd Mean ranks not sharing any common letter are significantly different according to Dunn's tests (p<0.05). A Kr u sk a l -W al l i s,x (4)=138.39,p=<0.0001,n=146 B Kr us k a l-Walli s,x(4)=120.37,p =<0.0001, n=146 0.9 : 90 0.8 Figure 1. Cont . G Krus k al-Wa llis,x*(4)=10.65,p=0.031.n=146 H K ruska l -Wallis ,x (4)=12.33,p=0.015,n=146 pwc : Du n n tes t p .a djust B on fe rroni Figure 1. Dunn’s post hoc analysis for pairwise comparisons between live-weight categories (LWC)of fat-tailed sheep regarding the tested traits: (A) Live weight-in kg; (B) Wither height—in m;(C) Carcass length—in m; (D) Carcass weight—in kg; (E) Carcass yield-as %; (F) Lightness—L*;(G) Hue angle; (H) Meat pH; (I) Meat hardness 1; (J) Meat hardness 2; (K) Meat springiness; (L) Meat cohesiveness; (M) Meat chewiness. Table 5. Results of non-parametric Mann-Whitney U tests performed to compare fat-tailed sheep to thin-t ailed sheep (rejection of null hypothesis when p <0.05: Differences between medians of groups are statistical l y signi f icant , hence groups come from di f ferent populations). Fat-Tailed Thin-Tailed Traits 11 Median Interquartile Range 11 Median Interquartile Range p-Value Live weight (kg) 30.50 30.38 58 37.00 38.50 0.751 Wither height (m) 77 0.68 0.16 58 0.68 0.20 0.535 Carcass length (m) 70 0.69 0.20 45 0.72 0.26 0.376 Hot carcass weight(kg) 77 16.60 10.95 58 17.00 13.20 0.691 Carcass yield (%) 77 53.74 0.13 58 48.77 0.14 <0.01 Muscle fiber minimum 22 21.26 5.22 23 20.37 6.12 0.318 Carcass pH 6.41 0.41 57 6.37 0.35 0.258 74 3.95 21 35.13 3.84 0.327 Lightness—L* 26 34.55 1.49 21 13.13 1.85 <0.05 Yellowness—b* 26 3.65 1.57 21 3.54 1.61 0.618 Chroma 26 12.96 1.68 21 13.73 1.99 0.088 Hue angle 26 21 0.27 0.09 0.333 26 5.59 0.10 21 5.61 0.13 0.900 Meat pH 934.19 754.52 20 1100.21 1061.88 0.141 Hardness 1 (g) 26 740.98 598.26 20 877.89 853.22 0.131 Springiness 26 0.78 0.16 20 0.78 0.11 0.511 26 20 Cohesiveness 350.22 0.08 0.51 471.23 0.741 Chewiness 26 5.27 10 63.54 8.43 0.815 Meat moisture (%) 11 63.06 5.30 10 3.87 4.51 0.237 11 6.72 3.42 10 22.04 0.777 Meat protein content (%) 11 4.59 Table 6. (a) Statistically signi f icant effects (p< 0.05) of sheep population (fat-tailed or thin-tailed sheep), l ive-weight category (LWC-% of mature l ive weight) and their interaction on studied traits, as estimated based on two-way ANOVA. (b) Statistically signi f icant effects (p<0.05) of sheep population (fat-tailed or thin-tai l ed sheep), sex and their interaction on studied trai t s, as estimated based on two-way ANOVA. (a) Trait Effect Sum of Squares df Mean Square F p-Value Sheep population 0.01 1 0.01 5.53 <0.05 Wither height (m) LWC 2.28 4 0.57 269.96 <0.001 Sheep population x LWC 0.03 4 0.01 3.45 <0.01 Yellowness-b* Sheep population × LWC 11.80 4 2.95 2.56 <0.05 Hue angle Sheep population × LWC 0.07 4 0.02 4.63 <0.01 Meat springiness Sheep population × LWC 0.14 4 0.03 3.77 <0.01 (b) Trait Effect Sum of Squares df Mean Square F p-Value Wither height (m) Sex 0.06 1 0.06 4.97 <0.05 Lightness—L* Sex 64.00 1 64.03 7.69 <0.01 Redness—a* Sex 12.79 1 12.79 6.14 <0.05 Sheep population x Sex 8.40 1 8.40 4.03 <0.05 Yellowness—b* Sex 13.40 1 13.40 12.46 <0.001 Chroma Sex 19.85 1 19.85 8.07 <0.01 Sheep population × Sex 10.76 1 10.76 4.37 <0.05 Hue angle Sex 0.04 1 0.04 9.39 <0.01 Table 7. (a). Statistically significant effects (p<0.05) of sheep population (fat-tailed or thin-tailed sheep),live-weight category (LWC) and their interaction on studied traits, as estimated by Scheirer-Ray-Hare tests. (b) Statistically significant effects (p <0.05) of sheep population (f at-tailed or thin-tailed sheep), sex and their interaction on studied traits, as estimated by Scheirer-Ray-Hare tests. (a) Trait Effect Sum of Squares df H p-Value Live weight (kg) LWC 1,142,662.00 4 231.27 <0.001 Carcass length (m) LWC 787,969.00 4 192.88 <0.001 Hot carcass weight (kg) LWC 1,093,735.00 4 221.39 <0.001 Sheep population 36,751.00 1 7.44 <0.01 Carcass yield (%) LWC 705,885.00 4 142.86 <0.001 LWC 48,815.00 4 10.75 <0.05 Carcass pH Sheep population x LWC 44,529.00 4 9.80 <0.05 Lightness—L* LWC 32,178.00 4 38.23 <0.001 Redness—a* Sheep population 3560.00 1 4.23 <0.05 Meat pH LWC 13,493.00 4 16.07 <0.01 Meat cohesiveness Sheep population x LWC 9767.00 4 11.84 <0.05 (b) Trait Effect Sum of Squares df H p-Value Live weight (kg) Sex 36,855.00 1 7.46 <0.01 Hot carcass weight (kg) Sex 20,769.00 1 4.20 <0.05 Carcass yield (%) Sheep population 36,751.00 1 7.44 <0.01 Sex 93,536.00 1 18.93 <0.001 Muscle fiber minimum Feret's diameter (um) Sex 2569.00 1 5.27 <0.05 Carcass pH Sheep population × Sex 21,223.00 4.67 <0.05 3.2.3. Effects of the Interaction of Sheep Population with Sex When accounting for the effects of the interactions of sheep population with sex,ANOVA results (significant effects presented in Table 6-full version including all effects in Table S1b) show that sheep population had no significant effect on the studied traits (p>0.05). Scheirer-Ray-Hare tests (Tables 7 and S2b present significant effects only and total effects, respectively) showed that thin-tailed sheep had significantly lower carcass yield (H(1)=7.44,p<0.01). Regarding the interaction of sheep population with sex, significant effects were found on a* (f(1)=4.03, p<0.05) and chroma (f(1)=4.37, p<0.05), based on ANOVA. Results of Tukey's post hoc tests that were statistically significant are presented in Figure 3. Moreover,a significant effect of the interaction was found on carcass pH (H(1)=4.67, p<0.05)according to Scheirer-Ray-Hare tests. Figure 2. Tukey’s post hoc tests for pairwise comparisons between groups, following two-way ANOVA, accounting for the effect of the interaction between live-weight categories (LWC -25,35,50,70 and 100% of mature l ive weight) and sheep populations (fat-tailed, t hin-tailed) on the tested traits: (A) Live weight—in kg; (B) Wither height-in m; (C) Carcass length —in m; (D) Carcass weight-in kg; (E) Carcass yield-as %; (F) Lightness—L*; (G) Hue angle; (H) Meat pH; (I) Meat Springiness; (J) Meat Cohesiveness. Superscripts not sharing any common letter between groups indicate statistically significant differences (p<0.05). Figure 3. Tukey’s post hoc tests for pairwise comparisons between groups, following two-way ANOVA, accounting for the effect of the interaction between sex (male, female) and sheep populations (fat-tailed, thin-tailed) on the tested traits: (A) Carcass yield-as %;(B) Muscle f iber minimum Feret’s diameter—in um; (C) Lightness—L*; (D) Redness-a*; (E) Yellowness-b*; (F) Chroma; (G) Hue angle. Superscripts not sharing any common letter between groups indicate statistically significant differences (p<0.05). 4. Discussion 4.1. Quality Assessment of Fat-Tailed Sheep Carcasses Mean values of body and carcass traits of fat-tailed sheep reported herein present both similari t ies and differences compared to respective estimations of relevant studies on Chios and other fat-tailed sheep breeds. Wither height was similar to that reported i n literature (ca. 0.60 m) for Chios crosses of live weight corresponding to 35% LWC of the present study [21,22]. Present results of mean wither height for 70 and 100% LWC are also in general accordance with those of Awassi (Jordan, Turkey), Red Karaman (Turkey), Barki (Libya, Egypt), Ossimi and Rahmani (Egypt); averages ranged from 0.72 to 0.74 m [23-25].However, adult sheep of other fat-tailed breeds reared in the Mediterranean basin, Middle East and Northern Africa had lower mean wither height (0.54-0.70 m) [26]. Studies regarding carcass pH and meat quality parameters (pH/color/tenderness)of Chios sheep are rather scarce. In agreement with the present results, Ekiz et al. [27]reported a mean carcass pH of ca. 6.5, measured approximately 45 min after slaughter,for Chios sheep with mean live weight corresponding to 35% LWC. They also report slightly higher L* and a* and ranging b* values. Relevant studies have reported higher L*, b* and chroma values of meat samples from Awassi, i ndigenous Turkish and Iranian fat-tailed sheep corresponding to 35%, 50% and 70% LWC of the present study [35-37].Higher L* and a* and lower b* values were reported for Kangal Akkaraman sheep [38].Slightly higher values of all color parameters were reported for meat of Awassi sheep in 70% LWC [39]. In all the above cases, measurements were performed in a smaller time interval after slaughter (24 h) and different sample preparation, illuminant, aperture size and observer angle were implemented compared to the present study. Such di f ferences may partly explain the observed discrepancies. This hypothesis is further supported by the f act that in our study, meat color parameters changed among LWCs following trends similar to other studies, i n which heavier carcasses produced darker meat (higher L*), whereas a* and b* were approximately the same regardless of carcass weight [36]. Thus, color parameter differences of other studies and the present one may reflect different methods and equipment settings used. In most of the above studies, meat tenderness was assessed,as well ; Warner-Bratzler shear force tests and cooked meat were used, and hence results are not comparable to the present ones. In agreement with studies on Chios or other fat-tailed sheep [46,47], statistically significant dif f erences between male and female sheep were detected, regarding live weight,carcass yield, muscle fiber minimum Feret’s diameter, L* and hue angle. Interestingly,females presented higher l ive weight; this could be associated with the fact that carcasses of female sheep in the heavier LWC slightly outnumbered those of male sheep. On the contrary, male carcass yield and muscle fiber minimum Feret's diameter were larger. This agrees with the fact that sex-related anatomical differences generally render male sheep more muscular than female. Color parameter differences suggest that meat of female sheep is darker (lower L*) and more reddish (lower hue angle); however, they are very slight and need to be interpreted with caution. Likewise, Yousefi et al. [36] reported that female Chaal lambs had statistically significant higher a*, which also results in more reddish meat. Overall , in previous studies, l argely ranging values were observed for most studied traits. Categorization of sheep and their carcasses according to their weight facilitated comparisons between the present study and other studies. The i mportance of this cate-gorization is underpinned by the fact that the observed differences among LWCs of the present study were statistically significant for most traits. Considering the absence of quality-improving feed interventions prior to slaughter and given that all studied animals are considered"by-products" of dairy production, slaughtered at different live weights and productive stages,large variability was expected regarding the studied traits. However, this indicates t hat there may be space for improving fat-t ailed sheep carcass and meat quality.The different LWCs defined in the present study equally represent very light l amb carcasses (25%LWC) and heavy carcasses of adult sheep (100%LWC), which are mainly produced in Greece, as well as midweight carcasses, which are generally scarce (35, 50, 70%LWC).Comparison with the respective data of other mentioned studies implies improvement potential through implementing appropriate fattening protocols. 4.2. Comparison of Fat-Tailed and Thin-Tailed Sheep Carcasses To support the validity of our i nferences, two different statistical approaches were involved in the comparison of fat-tailed and thin-tailed sheep: Mann-Whitney U tests and either two-way ANOVA or its non-parametric equivalent Scheirer-Ray-Hare tests,depending on compliance of the distribution of each studied trait with the assumptions of ANOVA. Results of Mann-Whitney U tests were further assessed with two-way ANOVA that accounted also for the effects of LWC or sex and their interaction with sheep population;the latter explained part of the observed variation, otherwise attributed only to the sheep population effect. In cases where ANOVA assumptions were violated, Scheirer-Ray-Hare tests were performed to avoid misleading results; as non-parametric, the latter tests were considered more reliable for the interpretation of effects in such cases. Results from the above analyses suggest that fat-tailed sheep carcass yield was higher than that of thin-tailed. This is in accordance with the study of Panopoulou et al . [29], in which the carcass yield of Chios sheep was higher (by 2.2%) compared to a thin-tailed indigenous Greek sheep breed, Karagouniko. On the contrary, Ekiz et al. [27] have found that Chios reared in Turkey yielded less than Merino and Kivircik thin-tailed sheep (by 2.6%). Regarding other fat-tailed breeds, Akkaraman sheep presented consistently higher carcass yield compared to thin-tailed Anatolian Merino under different feeding systems [51].Furthermore, Iranian fat-tailed Chaal and Zandi sheep presented higher carcass yield than thin-tailed Zel sheep or their crosses; however, these differences were not always statistically significant [34,52]. Based on the above, fat-tailed sheep are not consistently presenting higher yields compared to thin-t ailed. This could potentially be attributed to underlying differences among studied populations regarding management practices,sampling methods or sample size variance. However, the present results, supported by the evidence of another study concerning Greek sheep [29], suggest that Chios and their crosses achieve higher carcass yields compared to local thin-tailed populations. Meat of the studied fat-tailed sheep had statistically significant lower a* compared to tha t of thin-tailed, based on statistical analyses performed . These f indings are in accordance with other studies that have also reported respective di f ferences between Chios and thin-tailed Kivircik and Imroz sheep [27] and between fat-tailed Chaal and thin-tailed Zel sheep [52]. Lower a* represents meat color that is more brownish than reddish, hence less desirable to consumers. However, in order to make safe assumptions, a l l color parameters should be considered . Present results indicate tha t chroma, b* and hue angle were affected by t he interaction of sheep population with sex or LWC (p<0.05). This observation is in accordance with Yousefi et al. [52], who have reported significantly different b* between fat-tailed and thin-tailed sheep. Overall, in the present study, sheep population affects meat color; fat-tailed sheep present a trend towards less desirable meat color; however,differences from thin-tailed are minimal. Further investigation of a larger sample size may facili t ate quantifying the overall impact. Wither height was significantly affected by sheep population and i ts interaction with LWC, emphasizing unique morphologica l features between the two populations; fat-tailed sheep were taller than t hin-tailed by approximately 1 cm. However, due to t he scarcity of similar studies concerning this trait, assessing the relevance of our observations is rather difficult. Statistically significant effects of the interaction of sheep population and LWC on meat springiness and cohesiveness were also detected, suggesting that meat of fat-tailed sheep is more tender (lower springiness and cohesiveness) compared to t hat of thin-tailed. Yousefi et al. [52] reported the opposite regarding Iranian thin-tailed Zel and fat-tailed Chaal l a mbs;however, assessment methods were different than those of the present study. Unique features of each population may be the underlying cause for the observed discrepancies. The interactions with LWC and sex had statistically significant effects on carcass pH. Similar significant differences (p<0.05) between carcasses of animals slaughtered at different live weights have been reported in literature for both fat-tailed and thin-tailed sheep, however, i n these cases pH was measured at a larger time interva l of 24 h; differences between sexes were not statistically significant [36,53]. Meat physicochemical characteristics did not differ between sheep populations. On the contrary, Aksoy et al. [37] have reported such differences between fat-tailed and thin-tailed sheep for one or more of the studied traits. In our study, the small sample size used for the relevant analyses may be insufficient for the detection of possible significant differences between groups or overall effects. In f uture studies, assessment of the above effects with a larger sample size may facilitate safe assumptions. Furthermore, evaluation of the fatty acid profile, which is commonly performed in relevant studies [36,37,52,54], may provide further insight. 5. Conclusions The present results i ndicate that carcasses and meat of Chios fat-tailed sheep (and their crosses) reared in Greece present desirable characteristics, in most cases exceeding the performance of local thin-tailed sheep, which are generally considered to produce leaner meat of higher quality. Most of the studied traits were significantly affected by LWC and/or sex. Live weight at slaughter is key to maximizing meat production, capitalizing and minimizing waste. Present results suggest that fattening of lambs until finishing weights corresponding to 50 and 70% LWC could improve the otherwise low marketability of fat-tailed sheep carcasses, therefore contributing to the overall production efficiency and sustainability of the sector. Supplementary Materials: The following supporting information can be downloaded at:htt ps://www.m dp i.com/article/10.3390/ani12151998/s 1, Table S1a: Effects of sheep population (fat -tailed or thin-tailed sheep), l ive-weight category (LWC-% of mature live weight) and their interaction on studied traits, as estimated based on two-way ANOVA; Table S1b: Effects of sheep population (fat-tailed or thin-tailed sheep), sex and their interaction on studied traits, as estimated based on two-way ANOVA; Table S2a: Effects of sheep population (fat-tailed or thin-tailed sheep),live-weight category (LWC) and their interac t ion on studied traits, as estimated by Scheirer-Ray-Hare tests; Table S2b: Effects of sheep population (fat-tailed or thin-tailed sheep), sex and their interaction on studied traits, as estimated by Scheirer-Ray-Hare tests. Author Contributions: Conceptualization, A.A., A.T., I.S., T.K., V.E. and G.A.; methodology, A.A.,A.T., I .S., S.V., T.K., V.E. and G.A.; validation, A.A., A.T ., I.S., V.E. and G.A.; forma l analysis, A.A.;investigation, A.A., A.T., I.S., S.V. and T.K.; resources, T.K., V.E. and G.A.; data curation, A.A.;writing-original draft preparation, A.A.; writing—review and editing, A.A., A.T., I.S., S.V., T.K.,V.E. and G.A.; visualization, A.A.; supervision, V.E. and G.A.; project administration, G.A.; funding acquisition, G.A. All authors have read and agreed to the published version of the manuscript. Funding: This research has been co-financed by the European Union and Greek national funds through the Operational Program Competi t iveness, Entrepreneurship and Innovation, under the call RESEARCH-CREATE-INNOVATE (projec t code: T1EDK-05479—project : Greek Quality Meat一 GreQuM). Institutional Review Board Statement: The study was part of the project Grequm (T1EDK-05479)that was approved for i ts experimental methodologies and ethics by a designated committee of the Greek General Secretary for Research and Innovation following national and European regulat i ons. Informed Consent Statement: Not applicable. Data Availability Statement: The data presented in this study are available on request from the corresponding author Conflicts of Interest: The authors declare no conflic t of interest. References 1. Hellenic Statistical Authority. Livestock and Livestock Products 2019 (in Greek). 2019. Available online: https://www.statistics.gr /el/statistics/-/p ublication/SPK33/-(accessed on 30 March 2022). 2 Zygoyiannis, D.; Kyriazakis , I.; Stamataris, C.; F r iggens, N.C.; Katsaounis, N. The growth and development of nine European sheep breeds. 2. Greek breeds: Boutsko, Serres and Karagouniko. Anim. Sci. 1997,65,427-440. [Cr ossRef ] 3. Mandolesi, S.; Naspetti, S.; Arsenos, G.; Caramelle-Holtz, E.; Latvala, T.; Martin-Collado, D.; Orsini, S.; Ozturk, E.; Zanoli, R.Motivations and barriers for sheep and goat meat consumption in Europe: A means-end chain study. Animals 2020, 10,1105.[CrossRef | 4. Tsitsos, A.; Economou, V.; Arsenos, G.; Kalitsis, T.; Argyriadou, A.; Theodoridis, A. Greek and European consumer behaviour towards beef, lamb and Mutton Meat Safety and qual i ty: A Review. Int . J. Agric. Resour. Gov. Ecol. 2021,17,414-431.[CrossRef ]5. Van Zanten, H.H.E.; Herrero, M.; Van Hal, O.; Roos, E.;Muller, A.; Garnett, T.; Gerber, P.J.; Schader, C.; De Boer, I.J .M. Defining a land boundary for sustainable l ivestock consumption. Glob. Change Biol. 2018, 24, 4185-4194.[CrossRef] [PubMed] 6. European Commission. EU Agricultural Outlook for Markets, Income and Environment , 2021-2031; European Commission, DG Agriculture and Rural Development : Brussels, Belgium; Available online: https://ec .europa.eu/i nfo/si t es/defau l t/files/food-farming-f i sheries/farming/documents/agricultural-outlook-2021-report _en.pdf (accessed on 30 March 2022). 7 Zygoyiannis, D.; Stamataris, K.; Kouimtzis, S.; Doney, J.M. Carcass composition in lambs of Greek dairy breeds of sheep. Anim.Sci. 1990,50,261-269. [CrossRef ] 8. Mastrangelo, S.; Moioli, B.; Ahbara, A.; Latairish, S.;Portolano, B.; Pilla, F; Ciani , E. Genome-wide scan of fat-tail sheep ident i fies signals of selection for fat deposition and adaptation. Anim. Prod. Sci . 2019,59,835-848. [C rossRef ] 9. European Parliament and Council . Council Regulation (EC) No 1099/2009 of 24 September 2009 on the Protection of Animals at the T i me of Killing. Available online: https://eur-l ex.europa.eu/eli/reg/2009/1099 (accessed on 12 May 2022)10. Alvarez, J .M.; Rodriguez Iglesias, R.M.; Garcia Vinent, J.; Giorgetti, H.; Rodriguez, G.; Baselga, M. Introduc t ion of sheep meat breeds in extensive systems: Lamb carcass characteristics. Small Rumin. Res. 2013,109,9-14. [CrossRef ] 11. Briguet, A.; Courdier-Fruh, I .; Foster, M.; Meier, T.; Magyar, J .P. Histological parameters for the quantitative assessment of muscular dystrophy in the MDX-mouse . Neuromuscul Disord. 2004,14,675-682.[CrossRef ] 12. Varian, B.J.; Goureshet t i, S.; Poutahidis, T.; Lakritz, J.R.; Levkovich, T.; Kwok, C .; Teliousis, K.; Ibrahim, Y.M.; Mirabal, S.;Erdman, S.E. Beneficia l bacteria inhibit cachexia. Oncotarget 2016,7, 11803-11816.[CrossRef ] AMSA. AMSA Meat Color Measurement Guidelines;AMSA: Champaign, IL, USA, 2012; ISBN 61820 800-517-2672. Skaperda, Z.; Argyriadou, A.; Nechalioti, P.M.; Alvanou, M.; Makri, S.; Bouroutzika, E.; Kyriazis, I.D.; Tekos, F.; Veskoukis, A.S.; Kallitsis, T .; et al. Redox biomarker baseline levels in cattle tissues and their relationships with meat quality. Antioxidants 2021,10,958. [CrossRef ] Trinh, T . On The Texture Profile Analysis Test. In Proceedings of the Chemeca 2012, Wellington, New Zealand, 23-26 September 2012 Peleg, M. The instrumental texture profile analysis revisited. J. Texture Stud. 2019,50,362-368. [CrossRef] [PubMed ] R Core Team. R: A Language and Environment for Statistical Computing, version 4.1.2; R Foundation for Statistical Computing:Vienna, Austria, 2021; Available online: https://www.R-project.org / (accessed on 31 March 2022). 18. Revelle, W. psych: Procedures for Personality and Psychological Research, version 2.1.9; Northwestern University: Evanston, IL, USA,2021. Available online: https://CRAN.R-p roject.or g/pa cka ge=ps ych (accessed on 31 March 2022). 19. Wickham, H.; Francois, R.; Henry, L.; Muller, K. dplyr: A Grammar of Data Manipulation, R Package version 1.0.8; 2022. Available online: https://CRAN.R-proj e ct.org/package=dply r (accessed on 31 May 2022). 20. Mangiafico, S. Rcompanion: Functions to Support Extension Education Program Evaluation, R Package version 2.4.13;2022. Available online: https://CRAN.R-project .org/packa ge =rcom pa nion (accessed on 31 May 2022). 21. Obeidat, M.D.; Abdullah, A.Y .; Kolib, S.; Obeidat, B.S.; Jawasreh, K.; Subih, H.S. Pre-weaning growth performance and carcass traits of Awassi and Chios-awassi lambs. S. Afr . J. Anim. Sc i. 2019,49,140.[CrossRef ] 22. Irim, I.; Akbas, A.A.; Saatci, M. Determination of fertility traits of sheep and growth characteristics of Chios crossbred male lambs reared under local breeder conditions. J. I s tanb. Vet. Sci . 2020,4,102-108.[CrossRef ] 23. Topal , M.; Yi l diz, N.; Esenbuga, N.; Aksakal, V.; Macit, M.; Ozdemir, M. Determination of best f itted regression model for estimation of body weight in Awassi sheep. J . Appl . Anim. Res.2003, 23,201-208. [CrossRef ] 24. Topai, M.; Macit, M. Prediction of body weight from body measurements in Morkaraman sheep. J. Appl. Anim. Res. 2004,25,97-100.[CrossRef ] 25. Abdel-Moneim, A.Y. Body and carcass characteristics of Ossimi, Barki and Rahmani ram lambs raised under intensive production system. Egypt . J. Sheep Goat Sci . 2009, 4,1-16. 26. Pourlis, A.F. A review of morphological characteristics relating to the production and reproduction of fat-tailed sheep breeds.Trop. Anim. Health Prod. 2011, 43, 1267-1287.[CrossRef ] 27. Ekiz, B.; Yilmaz, A.;Ozcan, M.; Kaptan, C.; Hanoglu, H.; Erdogan, I.; Yalcintan, H. Carcass measurements and meat quality of Turkish Merino, Ramlic , Kivircik, Chios and Imroz Lambs raised under an i ntensive production system. Meat Sc i. 2009,82,64-70.[CrossRef l 28. Kocak,O.; Ekiz, B.; Yalcintan, H.; Yilmaz, A. Slaughter and carcass qual i ty characteristics of Chios × Tahirova crossbred lambs under intensive, tradi t ional and organic produc t ion systems. Ank. Univ. Vet. Fak. Derg. 2016,63,187-193. 29. Panopoulou, E.; Deligeorgis , S.G.; Papadimit r iou, T.; Rogdakis, E. Carcass composition, size of fat cells and NADPH-generating dehydrogenases activity in adipose t issue of the fat-tailed Chios and the thin-tailed Karagouniko sheep breed. J . Anim. Breed.Genet. 1989,106,51-58. [CrossRef ] 30. Hadjipanayiotou, M.; Koumas, A. Carcass characteristics of equally mature Chios lambs and Damascus kids. Small Rumin. Res.1994, 13,71-77.[C rossRef ] 31. Soycan Onene , S.; Ozdogan, M.; Erdogan Atac, F; Taskin, T. Fattening performance and carcass traits of Chios male l ambs fed under traditional and intensive feeding conditions. Trop. Anim. Health Prod. 2012,44,1057-1062.[CrossRef ] [PubMed ] 32. Mohapatra, A.; Shinde, A.K. Fat-tailed sheep-an important sheep genetic resource for meat production in tropical countries: An overview. Indian J. Small Rumin. 2018,24,1-17. [CrossRef] 33. Abdullah, A.Y.; Qudsieh, R.I. Carcass characteristics of Awassi ram lambs slaughtered at different weights. Livest. Sc i . 2008,117,165-175.[CrossRef ] 34. Kashan, N.E.J.; Manaf i Azar, G.H.; Afzalzadeh, A.; Salehi , A. Growth performance and carcass quality of fattening lambs from fat-tailed and tailed sheep breeds. Small Rumin. Res. 2005,60,267-271. [CrossRef ] 36. Yousefi, A.R.; Sadeghipanah, A.; Kohram, H.; Zare Shahneh, A.; Dadashpour Davachi, N.; Aghashahi , A.; Ponnampalam,E.N.Determination of optimum carcass weight for meat quality and fatty acid composition in fat-tailed male and female Chal l lambs.Trop. Anim. Health Prod. 2019,51,545-553.[CrossRef ] 37. Aksoy, Y.; Cicek, U.; Sen, U.; Sirin, E.; Ugurlu, M.; Onenc, A.; Kuran, M.; Ulutas, Z. Meat production characteristics of Turkish native breeds: II. meat quality, fatty acid, and cholesterol profile of lambs. Arch. Anim. Breed. 2019,62,41-48. [CrossRef ] 38. Ekiz, B.; Di l ara Kecici , P.; Ziya Ograk, Y.; Yalc i ntan, H.; Yilmaz, A. Evaluation o f the functional i ty of EUROP carcass classi f ication system in thin-tailed and fat-tailed lambs. Meat Sci . 2021,181,108603.[CrossRef ] 40. Liu, D.; Fan, W.; Xu, Y.; Yu, S.; Liu, W.; Guo, Z.; Huang, W.; Zhou, Z.; Hou, S. Genome-wide association studies demonstrate that TASP1 contributes to increased muscle fiber diameter. Heredity 2021, 126,991-999.[CrossRef ] [PubMed ] 41. Duconsei l le, A.; Francois, O.; Bruno, P .; Lambert, C.; Peyron, M.A.; Hennequin, M. Measuring the effects o f in vi t ro mastication on bolus granulometry of shredded meat: A proposal for a new methodological procedure. Food Res. Int. 2019, 116, 1266-1273.[CrossRef ][PubMed]1 42. Kokoszynski, D.; Steczny, K.; Zochowska-Kujawska,J.; Sobczak, M.; Kotowicz, M.; Saleh, M.; Fik, M.; Arpasova, H.; Hrncár, C.;Wlodarczyk, K. Carcass Characteristics, Physicochemical Properties,and Texture and Microstructure of the Meat and Internal Organs of Carrier and King Pigeons. Animals 2020, 10, 1315. [CrossRef ] [PubMed ] 43. Chian, F.M.; Kaur, L.; Astruc, T; Venien, A.; Stubler, A.S.; Aganovic, K.; Loison, O.; Hodgkinson, S.; Boland, M. Shockwave processing of beef brisket in conjunction with sous vide cooking: Effects on protein structural characteristics and muscle microstructure. Food Chem. 2021,343,128500.[CrossRef ] 44. Meunier, B.; Normand,J.;Albouy-Kissi, B.;Micol, D.; El Jabri, M.; Bonnet, M. An open-access computer image analysis (CIA)method to predict meat and fat content from an android smartphone-derived picture of the bovine 5th-6th rib. Methods 2021,186,79-89. [CrossRef] [PubMed ] 45. Ruedt, C.; Gibis, M.; Weiss,J. Influence of muscle type and microstructure on i ridescence i n cooked, cured pork meat products.J. Food Sc i . 2021, 86,3563-3573. [CrossRef ] [P ubMed ] 46. Abdullah, A.Y.; Kridli, R.T .; Shaker, M.M.; Obeidat, M.D. Investigation of growth and carcass characteris t ics of pure and crossbred Awassi lambs . Small Rumin. Res. 2010,94, 167-175.[CrossRef ] 47. Tabbaa, M.J .; Al-Atiyat , R.M.; Abdullah, B.M. Evaluate purebreeding and crossbreeding strategy for better carcass and non-carcass traits of Awassi, Chios and their reciprocal crossbred lambs. Jordan J . Agric . Sci . 2019,15,65-79. 49. Carpenter, C.E.; Cornforth, D.P; Whittier, D. Consumer preferences for beef color and packaging did not affect eating satisfaction.Meat Sci. 2001, 57,359-363. [CrossRef ] 50. Dilara Kecici, P.; Ziya Ograk, Y.; Yalcintan, H.; Ozturk,N.; Kocak, O.; Demir, K.; Yilmaz, A.; Ekiz, B. Effec t of slaughter weight on slaughtering and carcass characteristics i n l ambs from thin-tailed Kivircik and fat-tailed Kangal Akkaraman breeds. Small Rumin.Res. 2021, 205, 106563. [CrossRef ] 51. Ates, S.; Keles, G.; Demirci, U.; Dogan, S.; Kirbas, M.; Fi l ley, S.J.; Parker, N.B. The effects of feeding system and breed on the performance and meat quality of weaned lambs. Small Rumin. Res. 2020,192,106225.[CrossRef ] 52. Yousefi, A.R.; Kohram, H.; Zare Shahneh, A.; Nik-khah, A.; Campbell, A.W. Comparison of the meat quality and fatty acid composition of traditional fat-tai l ed (Chal l ) and tailed (Zel ) Iranian sheep breeds. Meat Sci. 2012,92, 417-422. [CrossRef ][PubMed ] 53. Miguel, E.; Blazquez, B.; Ruiz de Huidobro, F. Liveweight and sex effects on instrumental meat quality of Rubia de El Molar autochthonous ovine breed. Animals 2021,11,1323. [CrossRef ]
关闭-
1/24
-
2/24
还剩22页未读,是否继续阅读?
继续免费阅读全文产品配置单


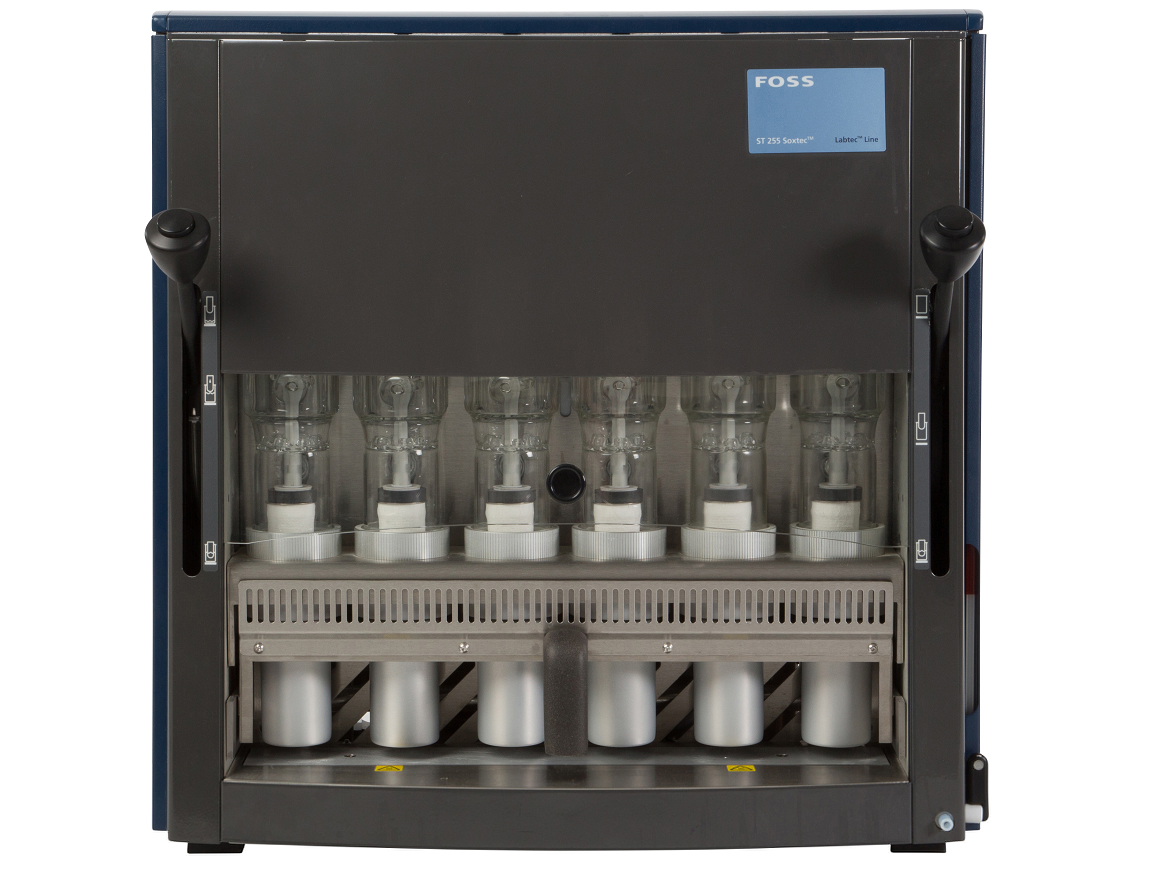
中国格哈特为您提供《肥尾羊肉总脂肪和总蛋白质含量的检测》,该方案主要用于畜禽肉及副产品中营养成分检测,参考标准《GB 5009.6 食品中脂肪的测定》,《肥尾羊肉总脂肪和总蛋白质含量的检测》用到的仪器有格哈特全自动超级总脂肪测定系统HT6+SOX416、格哈特凯氏消化系统KT8S、格哈特维克松废气实验室废物处理系统涤气VS、格哈特带自动进样器凯氏定氮仪VAP500C、德国加液器MM、滤纸筒。
我要纠错


相关方案
 咨询
咨询