用于LA-ICP-MS分析的基质匹配标准品制备的通用方法——通过液态标准物质的喷雾进行标准加入
检测样品 薄膜材料
检测项目 聚酰亚胺膜中硫、锌、银、铟和铅的含量的测定

 白金会员
124 篇解决方案
白金会员
124 篇解决方案
方案详情文
智能文字提取功能测试中
近年来,LA-ICP-MS已成为分析各种研究领域的固体样品的一种有吸引力的技术。然而,在材料科学中的应用常常受到适当的认证标准物质的有限可用性的限制,这是准确定量的先决条件。因此,通常使用与样品成分相匹配并包含所需浓度水平的所有感兴趣元素的内部制备的标准物质。然而,制备和表征这样的标准通常是费时费力的。本文提出了一种基于标准加入概念的制备基质匹配标准的新方法。在第一步中,使用液态标准物质和喷雾装置将感兴趣的分析物均匀沉积在样品表面上。在分析测试中,生成的薄层与下面的样品同时被剥离。因此,可以避免剥离过程和粒子传输中的偏差。结果表明,所开发的方法具有高度通用性,并且可以很容易适应实际需求。使用硅、碳化硅、铜、铝和玻璃作为基质,发现元素Zn、Ag、In和Pb的观察信号强度与沉积量之间存在极好的线性相关性(R2值大于0.99)。该方法被应用于确定商业Kapton®聚酰亚胺膜中硫、锌、银、铟和铅的含量。通过样品消解后的常规液体ICP-MS分析,可以基于均匀分布的硫来验证所获得的结果,显示出类似的精度和准确性。发现铅在Kapton®膜中显示出非常不均匀的分布,在大多数测量位置的浓度低于LOD,并且不规则出现具有显着较高浓度的斑点。最后,测量了Kapton®膜中硫的定量深度剖面,以评估气象实验后SO2的吸收。 LA-ICP-MS测量 使用来自Elemental Scientific Lasers(美国蒙大拿州博兹曼)的“imageGEO193”激光剥蚀系统和“iCAP Q” ICP-MS系统进行LA-ICP-MS测量,使用PTFE管道和800 ml/min的氦流量。在消融NIST SRM 612作为标准参考的同时,每天对仪器进行最大115In信号的调谐。反复优化喷涂参数,以确保标准的均匀应用。使用10×10μm2正方形光斑、1 J/cm2的能量、100 Hz的重复频率和100μm/s的扫描速度,在硅和玻璃基板上记录1.5×1.5 mm2的图像。对于不同基板材料的校准,使用不同水平的In、Ag、Zn和Pb制备的样品区域在每个标准上进行了五次线扫描(每次长度为6 mm)。 在反应模式下对Kapton®样品中的硫进行测量,以克服光谱干扰。使用氧气作为反应气体,硫被确定为32S16O在m/z 48,碳作为剥离的聚合物质量的标记为13C16O在m/z 29。在分析前,将质谱调到m/z 48的最大信号,同时使用200Hz激光脉冲频率测量天然Kapton®膜。为了分析校准标准,使用20个单独的点测量每个浓度水平。在突发模式下进行测量,使聚合物膜能够在大约2秒内完全穿透,从而产生一个瞬态信号。将一个没有添加标准的样品位置用于空白测量。1 J/cm2的激光光强低于硅片的剥离阈值,以确保没有对m/z 29信号的贡献。在Kapton®上的Zn、Ag、In和Pb的多元素校准采用与硫测定相同的激光剥蚀程序进行,但ICP-MS参数与不同基板上的喷雾标准相同(表1),并额外采集13C进行标准化。Talanta 256 (2023) 124305Contents lists available at ScienceDirectjournal homepage: www.elsevier.com/locate/talanta J. Willner et al.Talanta 256 (2023) 124305 Talanta A versatile approach for the preparation of matrix-matched standards for LA-ICP-MS analysis - Standard addition by the spraying of liquid standards Jakob Willner a b, Lukas Brunnbauer , Silvia Larisegger , Michael Nelhiebel ,Martina Marchetti-Deschmann , Andreas Limbeck a 1,, a TU Wien, Institute of Chemical Technologies and Analytics , Getreidemarkt 9/164-PAC, 1060 Vienna, Austria KAI Kompetenzzentrum Automobil-und Industrieelektronik GmbH, Technologiepark Villach -EuropastraBe 8, 8524 Villach, Austria ARTICLEINFO ABSTRACT Handl i ng Editor: J .-M. Kauffmann Keywords:LA-ICP-MS Matrix-matched standards Sulfur in polymers Thin layer deposition In the last years, LA-ICP-MS has become an attractive technique for analyzing solid samples from various research fields. However, application in material science is often hampered by the limited availability of appropriate certi f ied reference materials, which are a precondition for accurate quantification. Thus, frequently in-house prepared standards are used, which match the sample’s composition and include all elements of interest at the required concentration l evels. However, preparing and characterizing such stand a rds is often labor-intensive and time-consuming. This work proposes a new approach for the fabrication of matrix-matched standards based on the concept of standard addi t ion. In the f irst step, t he analytes of interest are homogeneously deposited onto t he sample surface using liquid standards and a spraying device. For analysis, the generated thin layer is ablated simultaneously with the underlying sample. Thereby deviations in the ablation process and particle transport can be avoided. It could be shown that the developed method is highly versati l e and could be easily adapted to the actual needs.Using silicon, silicon carbide, copper, aluminum, and glass as a matrix, excellent linear correlations between observed signal i ntensities and deposited amounts were found for t he elements Zn, Ag, I n, and Pb (R2-values greater than 0.99). The method was applied to determine the content of sul f ur, zinc, silver, indium, and lead in a commercial Kapton@ polyimide film. The obtained results could be verified based on the homogeneously distributed sulfur by conventional l iquid ICP-MS analysis after sample digestion, showing similar precision and accuracy. Lead was found to show a very inhomogeneous distribution in the Kapton@ fi l m, with concentration below the LOD at most measured locations and irregularly occurring spots with significantly higher concentrations. Finally, a quantitative depth profile of sulfur in a Kapton@ film has been measured to assess the uptake of SO2 after a weathering experiment. The development of analytical techniques and instruments is always pushed further to meet the increasing demands for technological ad-vances in all kinds of industries and research fields. Nevertheless, aside from instrumental improvements, the development of suitable methods is essential to enable the extraction of the desired information for the respective question with the necessary confidence. These methods require thorough adjustment and optimization to the utilized instrument and the investigated material. Polymers are nowadays used in a large variety of industries and products. In many appl i cations, polymers contain additives such as pigments, stabilizers, plasticizers, anti-oxidizing agents, flame re-tardants, and ant i static agents to tune their physical and chemical properties [1]. These polymer additives cover a wide range of organic and inorganic substances and must be monitored in production regarding their content and distribution to ensure the desired product properties [2]. Not only deliberately added substances but also unin-tended contaminations must be monitored, as they could negatively impact product quality or must not exceed certain limits specified by legal authorities [3]. In addition to these necessities in production, some applications also require analysis of the i nteraction of a polymer product Available online 26 January 2023 0039-9140/C 2023 The Authors. Published by Elsevier B.V. This is an open access article under the CC BY license (h t tp://creativecommons.org/l i censes/by/4.0/). with the environment (e.g., uptake, accumulation, or emission of sub-stances [4,5], stabi l ity, aging, and degradation characteristics [6]),which can be essent i al either f rom a technological or an environmental point of view. Thus, polymer analysis is an i mportant area in Analytical Chemistry. The applications of polymer materials cover relatively trivial uses l ike (one-way) packaging materials for consumer goods and con-struction materials [7]. Yet nowadays, they also have found their way into more demanding fields, such as the electronic and semiconductor industries [8]. There , polymers are often employed as an encapsulation materia l or protective layer to prevent devices from the influence of light and atmosphere. While operational conditions in an average home or office environment are not as critical, device protection is of high importance in harsh environments, e.g., in devices used in industrial-or automotive applications, where usually gases such as hydrogen sulfide or sulfur dioxide are present at higher concentrations [9,10]. Develop-ment and capabil i ty studies of such coatings require sensitive determi -nation of sulfur levels. Conventional approaches for elemental analysis in polymers are based on sample digestion or combustion, followed by liquid ICP-MS/OES analysis [11,12]. While offering reliable quant i tative results,these approaches come with certain drawbacks. They usually result in a substantial dilution of the sample, which might become a problem regarding t he required sensitivity of analysis, and they provide only bulk information. Further, t i me-consuming sample preparation, which also increases contamination risk, and the need for hazardous and expensive reagents, make direct solid sampling techniques such as LIBS and LA-ICP-MS more attractive. Since more than 30 years ago, LA-ICP-MS has been used to determine natural and synthetic specimens’elemental composition [13]. This analytical method offers vast applicability for direct solid sampling analysis with minimal sample preparation in analyzing major, minor,and trace const i tuents over a wide elemental range and performing laterally- and depth-resolved microanalysis without requiring vacuum or conducting samples [14]. With a l i near dynamic range of up to 10orders of magnitude, excellent limits of detection, and high sample throughput,LA-ICP-MS finds application i n various research fields (e.g.,for analyzing biological, medical, geological, and technological samples [14-20]). Additionally, LA-ICP-MS has already been successfully applied for elemental analysis of polymer materials several times [21-24]. sample under investigation. The best and most straightforward way to achieve reliable quant i-tative data is by using certi f ied reference materials (CRM) with identical compositions. However, their availability is limited to specific sample matrices, making this approach impossible for many research questions,especially i f newly developed materials are investigated. To compensate for these l imitations, several new approaches have been developed in the past, using in-house prepared matrix-matched standards [14,30-33]or different concepts of standard addition [14,34,35]. However, the production and characterization of suchstandards are usually work-intensive and time demanding. A possible method for preparing matrix-matched standards of poly-mer samples i s by spiking polymer solutions with dif f erent amounts of the elements of interest and subsequently evaporat i ng the solvent after shaping via casting or spin-coating [24]. However, this requires some a priori knowledge about the composition of the investigated polymer, and i t further must be assumed that the properties of the prepared standards are stil l similar to those of the origina l sample. A method that allows standard addition directly onto solid samples is dried droplet quantifi -cation, where a defined volume of liquid standard with known con-centration is deposited on the sample surface. After solvent evaporation,the residue is analyzed simultaneously with the sample substrate. Thus,deviations in the ablation process between sample and standard could be avoided. Using multiple droplets with different concentration levels results in a calibration function. Although the dried droplet approach represents an attractive method for matrix-matched calibration, this method bears some disadvantageous aspects. In the drying process, the “coffee ring” effect and size discrimination [36,37] lead to inhomoge-neous deposition of residue on the surface. This can be compensated by complete ablation of the entire residue. Considering the size of the droplet residues, which can be up to several mm’ depending on the applied volume and the hydrophobicity of the substrate, the ablation can be rather time-consuming. Additionally, prepared dried droplet stan-dards can only be analyzed once, which is undesirable, as LA-ICP-MS needs to be calibrated for each analysis. This work presents a new approach for matrix-matched standard cal i bration with LA-ICP-MS, circumventing significant drawbacks of conventional dried droplet quanti f ication or standard addi t ion tech-niques that use sample spiking. For this purpose, a commercial spraying device is used to homogeneously deposit thin l ayers of standards with di f ferent concentration levels onto the sample surface. The applicability of the proposed procedure is demonstrated by the analysis of selected elements in polymer films. Further, it is shown that the developed method can also be applied to other sample materials. 2. Experimental 2.1. Preparation of spraying standard solutions Al l sample intake and dilution steps were performed gravimetrically.Certified single-element ICP-MS standards (1 mg/ml) of indium, euro-pium, gadolinium, sulfur, zinc, silver, and lead were acquired from Merck Mil l ipore. 30% isopropanol (v/v) was prepared using Mi l liQ water (18.2 MQecm) freshly dispensed from a Barnstead EASYPURE II water system from ThermoFisher Scientific (Marietta, OH, USA) and isopropanol (p.a.) from Merck (Darmstadt, Germany). The spraying standard solutions were prepared by combining two stock solutions and 30% isopropanol in the respective ratios, where stock A contained the matrix and interna l standard, and stock B the elements of interest . Stock A was prepared by dissolving 1 g of polyethylene glycol (PEG) with an average molecular weight of 10,000 Da (Honeywel l FlukaTM,≥99%) and addition of 1 g of a 1 mg/g europium ICP standard i nto 98 g of the 30%isopropanol, resulting in an approximately 30% isopropanol solution wi t h 1% PEG and 10 rg/g europium. Stock B was prepared by addition of 2.5 g of an in advance prepared ICP-MS standard mix, containing the elements of interest with the desired concentrations, into 97.5 g of the 30% isopropanol. For each experiment, 5 g of Stock A was mixed with varying amounts of stock B and 30% isopropanol to obtain 10 g of each spraying standard solution, ultimately containing approximately 30%isopropanol, 0.5% PEG , 5 pg/g Eu, and the desired concentration of the target elements. For the i nitial experiments for the opt i mization of the spraying pa-rameters on Kapton@ as well as the preparation of sulfur standards on Kapton@, the element mix added to Stock B contained 345 mg of 2,2'-Dithio-dipyridine (Sigma-Aldrich, ≥99%), 2 g of a 1,000 pg/g indium ICP standard and 155 mg of 30% isopropanol , resulting in a solution with 1 mg/g sulfur and 3 rg/g indium. The prepared spraying standards (Stock A + Stock B +30% IP) resulted in 5 different levels of S from 10 to 150 ng/g and In from 0.2 to 3 rg/g. For the determination of the deposited mass per sample area via sample digestion and liquid ICP-MS determination, Stock B was prepared containing 20 ug/g indium,result i ng in a spraying standard with 10 pg/g In. For the multielement spraying standards on Kapton@ and on different other substrate mate-rials, Stock B was prepared with 50 ng/g of zinc, silver, indium, and lead,resulting in spraying standards with concentration levels from 0.01 to 25 pg/g· 2.2. Preparation of sprayed standards by aerosol deposition A TM-Sprayer from HTX Technologies LCC (Chapel Hill, NC, USA)was used for applying liquid standards on surfaces. The spraying pa-rameters for aerosol deposition were opt i mized us i ng a Kapton@-pol-yimide film roll with a thickness of 13 um, purchased from Goodfellow GmbH. (Hamburg, Germany, manufacturer: DuPont). A piece of 150 ×40 mm’ was fixed onto a silicon wafer and covered with a 3D-printed mask. The mask left squared areas of 7 × 7 mm’ with rounded corners uncovered, one for each standard level. The uncovered regions were sprayed, each with a different standard concentration level, while all other areas were covered to prevent cross-contamination. The TM-Sprayer was operated under ambient conditions with a flow rate of 30 pl/min, a nozzle velocity of 1,000 mm/min, and a nozzle temperature of 45 °C for all experiments. The nozzle moving pattern was a meander with a 1 mm line distance and was performed for two cycles with a 90°rotation of the spraying pattern. The resulting Kapton@ film then con-tained separate locations with thin layers of different standard addi t ion levels. The spraying process applied to the Kapton@ f ilm is schematically depicted in Fi g. 1. In addition to the Kapton @ f ilms, five other substrate materials have been chosen for spraying tests with mult i element standards. Eight different concentration levels from 0.01 to 25 ug/g and 5 ug/g Eu in-ternal standard were applied on silicon, silicon carbide, glass, copper,and aluminum. To determine the deposited standard mass per area, 12 pieces of 10x10 mm"high-purity silicon wafer from I nfineon Technologies Austria (Villach, Austria) were used as a substrate. They were masked and sprayed analogously, using a standard solution with 10 pg/g indium. 2.3. Weathering experiment The weathering treatment of Kapton@ f ilms with corrosive gases at a defined temperature and relative humidity (r.h.) was performed in an in-house developed mixed-flowing gas (MFG) setup. The test gas (1,000ppm SO2, (v/v)) i s mixed with synthetic air to the desired concentration using mass flow controllers. The relative humidity is adjusted by mixing a dry (0%r . h.) with a humidified (100% r. h.) synthe t ic air stream. The set gas mixture enters a weathering cel l positioned i nside a laboratory oven to adjust the temperature between room temperature and 300°C. A 20×20 mmKapton@ film was attached to the edge of a glass slide with adhesive tape ensuring both sides of the fi l m were exposed to the sur-rounding atmosphere and placed i n the weathering cell . The sample was weathered for 72 h using 100 ppm (v/v) SO2 at 22°C and 90% relative humidity with a gas exchange rate of 4 h -. For LA-ICP-MS measure-ment, the fi l m was fixed onto a si l icon wafer substrate using adhesive tape. 2.4. LA-ICP-MS measurements Measurements of sulfur in Kapton@ samples were carried out in re-action mode to overcome spectral interferences. Using oxygen as reac-tion gas, sulfur was determined as 32s160 at m/z 48 and carbon as a marker f or the ablated polymer mass as 13c160 at m/z 29. Before the analysis, the mass spectrometer was tuned for a maximum signal at m/z 48 while measuring the native Kapton@ f ilm with a laser pulse frequency of 200 Hz. For analysis of calibration standards, each concentration level was measured using 20 individual spots. Measurements were performed in burst mode, enabling a complete penetration of the polymer film in approximately 2 s, resulting in one transient signa l per sample location.A sample location without any added standard was used for blank measurements. The laser fluence of 1 J/cm² was below the ablation threshold of the silicon wafer to ensure no contribution of the substrate to the m/z 29 signal. The mul t ielement calibration of Zn , Ag, In, and Pb on Kapton@ was performed using the same laser ablation procedure as for the sulfur determination, but the ICP-MS parameters as for the spray standards on different substrates (T abl e 1) with additional acquiring 13c Fig. 1. Schematic depiction of the standard preparation via spray application on Kapton@. Table 1LA-ICP-MS instrumental parameters. ICP-MS Plasma power 1,400 W Auxiliary gas flow 0.8 l/min (Ar) rate Cooling gas flow 13.8l/min (Ar) rate Make-up gas flow 0.8 ml/min (Ar) rate Experiment Spray standards on different Kapton@ sulfur spray materials standard calibration Measurement Standard Reaction mode Reaction gas flow 3 ml/min (10%02/He) rate Measured 66Zn,109Ag,115In,208Pb,153Eu (13c160),(32s160),153Eu isotopes Dwell times 10 ms for all isotopes 10 ms (29, 153),20 ms (48) LA Experiment Spray standards on different Spray standard calibration materials Scan type Line scan Spot scan Spot size 40 um (square shape) 200 um (circular shape) Sample fluence 1.0 J/cm 1.0J/cm" Repetition rate 50 Hz 40 Hz for normalization. For evaluation, the obtained transient signals of each spot were integrated using the software OriginPro 2022 (version 9.9.0.225, OriginLab Corp.). The measurement was repeated at five different locations. Instrumental parameters are shown in Ta ble 1. 2.5. Microwave-assisted acid digestion and l iquid ICP-MS measurements For conventiona l liquid ICP-MS analysis, the samples were converted into measurement solutions by performing microwave-assisted acid digestion and subsequent sample dilution. T he digestion was performed with a“Multiwave 5000”with“20SVT50”rotor and PTFE-TFM vessels by Anton Paar GmbH (Graz, Austria), using a mixture of 2.85 ml of concentrated nitric acid (EMSUREQ, p. a., MERK) and 0.15 ml of 30%hydrogen peroxide (Suprapur@, p. a., MERK). The digestion routine consisted of a linear heat i ng ramp from 20 °C to 185 ℃ in 25 min, fol-lowed by a holding time of 20 min at 185°C and a final cooling step down to 60 °C at the maximum rate. After digestion, the content of each vessel was transferred into a 15 ml centrifuge vial. Each digestion vessel was rinsed with 2 ml of MilliQ water, and the wash solution was added to the centrifuge vials. The vials were then filled to 15 ml with MilliQ water, resul t ing in pre-diluted sample solutions. To determine the area-speci f ic deposited mass of the spraying method, the silicon wafers with indium standard applied to the surface were used for digestion. Since the used digestion reagents deliberately did not contain any hydrofluoric acid, only the deposited standard res-idues were digested and t ransferred into the solution, while the si l icon wafers remained unaffected. For analysis, the obtained sample solutions were further di l uted with Mil l iQ water by a factor of 20 and spiked with gadolinium, resulting in solutions containing 1%HNO3and 1 ng/g Gd as internal standard. External calibration standards were prepared using indium ICP standard diluted with 1% HNO3 and addition of Gd as in-ternal standard, resulting in calibration standards with l evels of 0.1,0.5,2, and 10 ng/g In, and 1 ng/g Gd . For the reference measurement of the bulk concentrations of the KaptonQ fi l m, twelve replicates, with a sample intake of 50 mg Kapton@each, were used for digestion. Before ICP-MS analysis, the pre-diluted sample solutions were further diluted with MilliQ water by a factor of two and spiked with gadolinium ICP-MS standard, resulting in mea-surement solutions containing 10% HNO3 and 1 ng/g Gd. For the sulfur determination in reaction mode, external calibration standards were prepared using sulfur ICP-MS standard di l uted with 10% HNO3 adding again Gd as internal standard. For the determination of Zn , Ag, In, and Pb i n standard measurement mode, the named single-element ICP-MS standards were combined i nto a multielement stock solution and diluted , analogous to the sulfur standards. 3. Results and discussion 3.1. Method development and optimization In the first step, the spraying standard solution composition and the parameters of the spraying instrument were optimized. The primary goal was a satisfying thin layer deposition regarding adhesion and ho-mogeneity. This was achieved by varying the organic solvent content and the content of PEG, the latter facil i tating f i lm formation and inhibi t ing inhomogeneous crystal formation and aggregation. The so-lutions were applied to the Kapton@ polymer surface, varying the spraying instrument’s flow rate, nozzle temperature, nozzle veloc i ty,and line distance of the nozzle moving pattern. The dried residues were studied by optical microscopy using a VHX 5000 from Keyence (Mechelen, Belgium) and measured with LA-ICP-MS to evaluate the homogeneity of the deposited residues. To investigate the applicability of the optimized spraying method regarding various target elements and other substrate materials, stan-dards containing levels of 0.01-25 pg/g of Zn, Ag, In, Pb, and 5 pg/g Eu were sprayed onto silicon, silicon carbide, copper, aluminum and glass.To indicate the variant characteristic of the residual film deposited on di f ferent materials, which could be observed on the microscopic images,1.5×1.5 mm²LA-ICP-MS maps were measured on t he substrates silicon and glass with 5 rg/g of all elements in the applied spraying solution.The elementa l maps were co-registered and fused with the previously recorded microscopic images using the software ImageLab (version 4.21, Epina GmbH), resul t ing i n the hyperspectral images shown in Fi g . 2. The intensities of 5Eu (internal standard) are displayed in blue.It can be observed that the deposited film on Si is more uniform, with some locations where no standard residues are present, whereas, on glass, the residues are shaped in the form of separated islets. To test the homogeneity of the standards on both substrates, the images (150 × 150 pixels) were sub-divided into ten equally sized horizontal stripes, and the 153Eu-normalized i ntensities of the measured elements in the resul t ing groups were compared with a one-way ANOVA. With a significance level of 0.05, the null hypothesis cannot be rejected, indicating no significant difference between the group means and, thus, a homogeneous distribution of the standard residues by the applied spraying procedure. Each ANOVA group is equivalent to a measured area of 0.225 mm’. Therefore, sampling an area of at l east that size should be representative of the respective standard concentration with the present standard homogeneity . This implies that despite the Fig. 2. Hyperspectra l images of silicon (a) and glass (b) after spray deposi t ion of standards . 153Eu signal intensities above a threshold of 10 cps are overlayed in blue. different behavior in the shaping of the residues during the rapid drying of the solvent on di f ferent materials, a reliable and reproducible cali-bration can be achieved simply by sampling a sufficiently large area by either using mul t iple spot measurements or l ine scans. 3.2. Determination of absolute analyte mass in fabricated standards The 10 × 10 mm² silicon wafer pieces, which were spray coated using a 10 rg/g indium spraying standard solution with optimized conditions solely to an unmasked area of 45.86 mm, were digested and analyzed for their indium content using conventional liquid ICP-MS.Derived findings were used to calculate the masses of each element deposited per area as a function of the concentration in the applied standard solution. The determination of indium resulted in an absolute mass of 19.2 ±0.4 ng per sample. Consequent l y, the deposited mass of In after spraying a standard solution with 10 pg/g is equivalent to 418 ±9 pg/mm. For al l the other sprayed standards, the absolute mass of each added element per area i s calculated by multiplication of 41.8 ±0.9pg/mm" with the respective concentration in the applied standard solution in pg/g. Hence, the calculated coverage of the multielement standards on different substrates corresponds to approximately 418 fg/mm² for the lowest concentrated solution (10 ng/g) and 1.045 ng/mm’ for the highest (25 rg/g). For the fabricated standards on Kapton@, the applied solution concentrations from 10 to 150 pg/g of sulfur correspond to a coverage of 0.41-6.27 ng/mm². For zinc, silver, indium, and lead, the applied solution concentrations from 0.01 to 25 rg/g correspond to a coverage of 418 fg/mm²- 1.04 ng/mm’ for each of the individual elements. 3.3. LA-ICP-MS calibration of the multielement standards on different substrates The average intensities for In, Ag, Zn, and Pb of five l ine scans (6mm) on each standard show an excellent linear correlation with the concentration of the applied standard solution on al l investigated sub-strates. Correlat i on coefficients go f rom R2= 0.994 to 0.99999 with F-values from 1495 to 645,961, with one exception for Zn on the substrate aluminum (R²=0.973,F=251). These results provide evidence for the applicabil i ty of the spraying deposition method for mul t ielement cal i -bration over more t han three orders of magnitude on different sample material s . As a prerequisite for the presented approach, it was assumed that by using constant spraying parameters, the deposited mass of the target element per area is directly proportional to its concentration in the applied solution, provided that the concentration is negligibly low compared to the main solution constituent (50 mg/g PEG). This was now confirmed by the calibrations measured for In, Ag, Zn, and Pb on various substrates with deposited analyte masses going as low as 418 fg/mm (10 ng/g i n applied solution), where a single line scan (0.3 mm"ablated area) corresponds to a sampled mass of 125.4 fg. Relative standard de-viations between 5 repetitive line scans were from 0.5 to 5% for con-centrations higher than 0.5 ug/g (in applied solution) and 1-10% for concentrations from 10 to 500 ng/g (in applied solution). A quintupli-cate measurement of one standard only took 30 s, corresponding to a sampled area of 1.5 mm . This is beneficial compared to conventional dried droplet ablation, which requires total ablation of the area of the droplet , which can be up to 20 mm’ and more, for only one replicate.Further, each standard can be reused multiple t imes, which is a considerable advantage, as LA-ICP-MS requires calibration for each analysis and after regular time intervals. T able 2 shows the slopes of the calibration functions and the l imit of detection (LOD) calculated as the absolute mass required for detection normalized to one mm. The LODs were calculated using the calibration approach and reach from 0.17 fg/mm² (In on glass substrate) to 8.7 fg/mm(Zn on Al substrate). The variation of the slopes of each element on the different substrates (i .e., matrices) indicates differences in the sensi t ivity, which derive from matrix effects in ablation, transport, and ionization efficiency. Blank measurements indicated the presence of Zn and Pb i n the glass and the aluminum substrate and the presence of Ag in the copper substrate. In contrast, in silicon and silicon carbide, which are ultrapure materials in semiconductor manufacturing quality, none of the measured elements could be detected in the blank substrates. The results in this chapter demonstrate the general applicability of the spraying procedure on di f ferent material types. For quantitative analysis resulting in concentration values, the ablated sample mass or the analyzed volume must be known or determined, which is demon-strated for the Kapton@ f ilm in chapter 3.4. 3.4. Quantification of selected trace elements in Kapton@ and method validation Each ablation event completely penetrated the Kapton迟 film.Therefore, the sample mass ablated with each spot is calculated from the diameter of the laser spot (200 um), the material density (1.38 g/cm³),and the fi l m thickness (13 um). The deposited masses of sulfur, zinc,silver, indium, and lead for each ablation event and each standard level were calculated from the laser spot area, the area-specific mass depo-sition, and the respective concentrat i ons i n the applied solutions. The resulting standard addition levels are listed in Ta b le 3. The measured signal intensities accountable to each element are generated from the native content of the Kapton@ film plus the masses deposited on the surface of the respective standard level. The transient signals of each ablation event were baseline subtracted and integrated. To account for the spot-to-spot variabi li ty, the obtained 32s160 signals of each measured spot were corrected with the internal standard signals of 53Eu after previous blank correction. Subsequent l y,the signal derived from sulfur was normalized to the corresponding Table 2 Slopes and LODs (5 measurements per concentration level) of Zn, Ag, In, and Pb on different substrate materials. Substrate material Si SiC Cu Al Glass Zn Slope 0.79 0.77 2.23 1.42 1.61 LOD” 2.06 3.57 1.22 8.70 0.63 Ag Slope 8.00 7.74 7.70 10.48 11.29 LOD' 1.93 2.97 2.39 2.09 0.49 In Slope 26.63 28.64 31.37 32.98 39.20 LOD 0.64 2.19 1.02 0.17 0.40 Pb Slope 26.82 29.37 32.23 29.91 38.47 LOD 1.22 0.61 0.60 1.09 1.26 a In 10°cts/(fg/mm²). Absolute mass required for detect i on in fg/mm². Calculated according to the calibration approach from 3.3 times the standard error of the regression divided by the slope. Added concentrations of the prepared Kapton@ standards. Kapton@ Concentration in Added Additional standard applied solutions element concentration of level Lug/g」 masses per resulting standard [pg/ area g] 1 0.01 0.42 pg/mm 0.023 2 0.05 2.09 pg/mm 0.117 3 0.25 10.45 pg/mm 0.583 4 0.50 20.90 pg/mm 1.165 5 1.50 62.70 pg/mm 3.495 6 5.00 209.00 pg/ 11.650 mm 7 10.00 0.42 ng/mm 23.300 8 25.00 1.04 ng/mm 58.300 9 50.00 2.09 ng/mm 116.500 100.00 4.18 ng/mm 233.000 150.00 6.27 ng/mm 349.000 a The standard levels 1 to 8 were measured for the determination of Zn, Ag, In,and Pb. For the determination of sulfur, the standard levels 7 to 11 were measured. DCalculated from absolute element masses in relation to the polymer mass (564 ng) ablated pe r spot burst measurement with an area of 0.0314 mm²and complete ablation of the 13 um thick f i lm with a density of 1.38 g/cm. The calculated concentration is added additionally to the unknown native concen-tration of the KaptonQ f ilm. 13c60 signal , r epresenting a marker of the amount of carbon ablated from the polymer. The linear regression of the received calibration points showed a correlation coefficient of R²=0.993 (F =812).Calculating the bulk concentration of the Kapton@ f i l m from the cali-bration function using the slope and the intercept , with the error derived from the slope error, results in 32.4±1.2 rg/g of sulfur. Alternatively,by calculating it from the native Kapton@ measurements and the slope of the cal i bration function, with the error representing the standard devi-ation of the 20 consecutive blank measurements, the bulk sulfur con-centration of the Kapton@ f ilm is 35.5 ± 2.3 pg/g. The reached limit of detection of 0.116 rg/g is excel l ent compared to reported literature for the quant i tative determination of sulfur via LA-ICP-MS (10-100 ug/g in glasses, minerals, and melt inclusions [38,39]). To the best of the au-thor’s knowledge, no LOD for the determination of sulfur in polymers using laser ablation in combination with quadrupole ICP-MS has been reported so far. The results were veri f ied by applying sample digestion and liquid ICP-MS determination of sulfur in the Kapton@ film as a reference method. The average sulfur concentration in 12 diluted sample digests resulted in 43.7 ±3.6 ng/g, being well above the limi t of quantification (6.3 ng/g) calculated from ten times the standard deviation of 10 blank measurements divided by the slope of the external calibration curve.After accounting for the sample intake and the dilution by the digestion reagents and MilliQ water prior to the measurement of each sample, the average sulfur concentration of the Kapton@ film was 31.6 ±2.0 pg/g.This result is in good agreement with the results derived from LA-ICP-MS using the newly developed spray standard addition method for quanti-fication. To statistically support this statement, the uncertainty was calculated f or both determination methods by multiplying the standard deviation with the respective factor of the student t distribution for a 95% confidence level, n = 20 for the LA method (t =2.09) and n =12 for the reference method (t=2.20). The resulting average values and un-certainties of 35.5±4.7 and 31.6± 4.1 overlap. Therefore, the values cannot be significantly distinguished. This provides proof of concept for the developed method and confident evidence of val i dity and reliability through agreement with the results of a wel l -establ i shed reference method. The transient signals of Zn, Ag, In, and Pb were determined in a second analysis in standard measurement mode. The evaluation was analogous to sulfur, including Eu correction and normalization to car-bon. The measurements of the fabricated standards resulted in an excellent l inear signal response with the concentration of the respective standard. The received calibration functions had correlation coefficients from R²=0.996 to 0.999 (F =1563 to 14,810). T a bl e 4 shows the calculated LODs, and the determined concentrations in the blank Kap-ton@ film. No signals for Zn, Ag and In could be measured in the blank KaptonQ fi l m, indicating the absence of measurable amounts of these elements. For Pb, it was observed that no signal was detected at most measured spots, whereas some delivered comparably higher Pb signals.Therefore, 180 additional spots were measured and included in the evaluation of Pb. Of the total of 200 measured spots, 112 spots delivered signals below the limit of detection (0.023 pg/g), while the maximum value was as high as 0.943 rg/g. This indicates a highly inhomogeneous distribution of Pb in the Kapton@ film, which is also reflected in the relative standard deviation of 183%. For liquid ICP-MS reference measurements of Zn, Ag, In, and Pb, the solutions of the digested samples and external calibration standards were also measured in a second run in standard measurement mode. The obtained results match those acquired using LA-ICP-MS,regarding that the signals for Zn, Ag, and In the digested sample solutions were not different from those of the acid blank measurements (10% HNO3). Re-sults for Pb show a substantial variation between the digested samples,ranging from 0.063 to 1.499 ug/g with an RSD of 76% (n =12).Contamination dur i ng the sample digestion and di l ution can be excluded, as the procedure was addi t ionally performed with acid blanks,which consistently resulted in values below the limit of detection in the ICP-MS analysis. Since the RSDs of repeated measurement of the same digested sample (n = 3) were below 1.5% for each element, it is indi -cated that the variations in the Pb concentration are derived from the sample's contents rather than from contamination or errors in the measurement. To further investigate the strong scattering and incon-sistent results for Pb of the LA-ICP-MS method (0.056±0.103pg/g ) and the reference method (0.726 ±0.553 ug/g), the distribution of Pb was analyzed by measuring four large elemental mappings on the blank Kapton@ film via LA-ICP-MS. For each i mage, an area of 2×2 mm² was measured using a 50 × 50 um’ square-shaped spot with 97% over-lapping shots, a f luence of 1.5 J/cm , 200 Hz repetition rate, and ICP-MS parameters as used for the spot measurements of the standards via LA-ICP-MS (Tab l e 1). The chosen overlap enabled nearly complete pene-tration of the Kapton@ film during the measurement. Therefore, the concentrations obtained for each pixel can be considered good estimates for the locally occurring bulk content. F i g. 3 shows the derived distri-bution i mages, indicat i ng that most of the area contains Pb concentra-tions lower than the LOD (0.023 ng/g). In contrast, “hot spots” of Pb with concentrations of approximately 0.5 pg/g and higher occur irreg-ularly. The visualization in F ig. 3 conf i rms the inhomogeneous distri-butions of Pb i n the Kapton@ film, which was already suggested after the evaluation of the LA-ICP-MS spot measurements and the reference measurements of the digested samples. Compared to the sample mass that was used for one sample digestion (50 mg), the calculated total sampled mass of all four images of approximately 290 rg is more than a factor of 170 less, and thus still not sufficient for the determination of representative bulk contents. For these reasons, no match of the results of the developed LA-ICP-MS method and the reference method can be achieved for the determined Pb bulk concentration. The shown results of the different lead determination methods Table 4 LODs and determined concentrations (n = 20) of selected trace elements in KaptonQ. Z.n Ag In Pb LOD"[ug/g] 0.126 0.050 0.083 0.046 0.023 Cblank [ug/g] 35.5±2.3
-
1/9
-
2/9
还剩7页未读,是否继续阅读?
继续免费阅读全文产品配置单
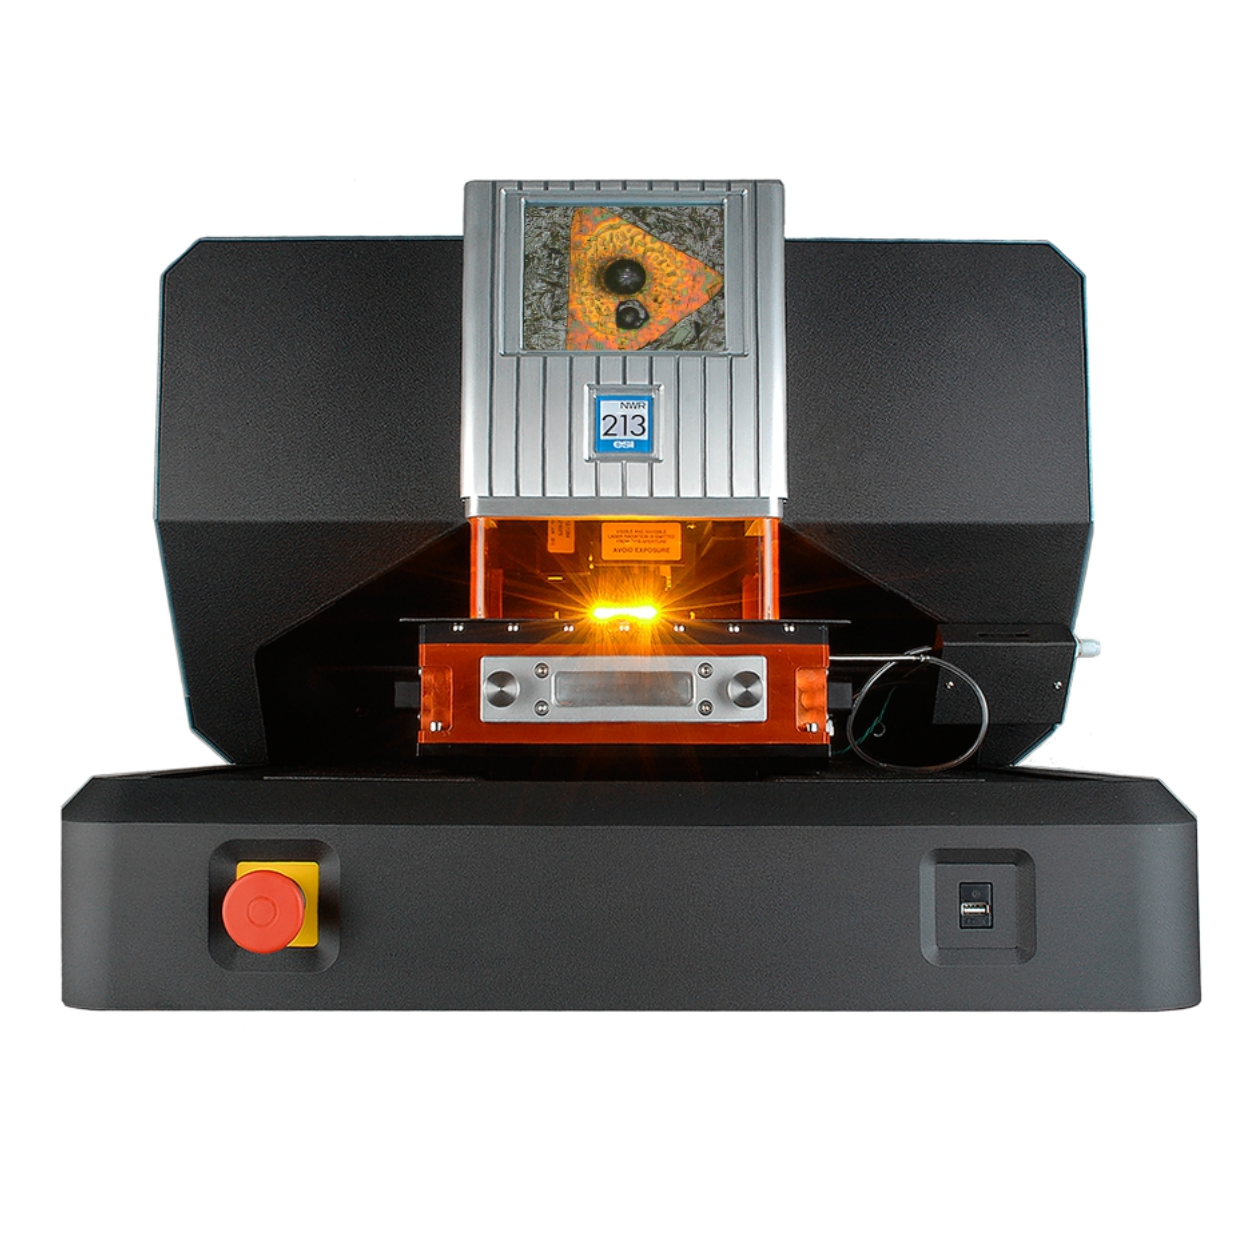
上海凯来仪器有限公司为您提供《用于LA-ICP-MS分析的基质匹配标准品制备的通用方法——通过液态标准物质的喷雾进行标准加入》,该方案主要用于薄膜材料中聚酰亚胺膜中硫、锌、银、铟和铅的含量的测定检测,参考标准《暂无》,《用于LA-ICP-MS分析的基质匹配标准品制备的通用方法——通过液态标准物质的喷雾进行标准加入》用到的仪器有ESLimageGEO 激光剥蚀系统(地质成像)。
我要纠错
推荐专场
相关方案
 咨询
咨询