

方案详情文
智能文字提取功能测试中
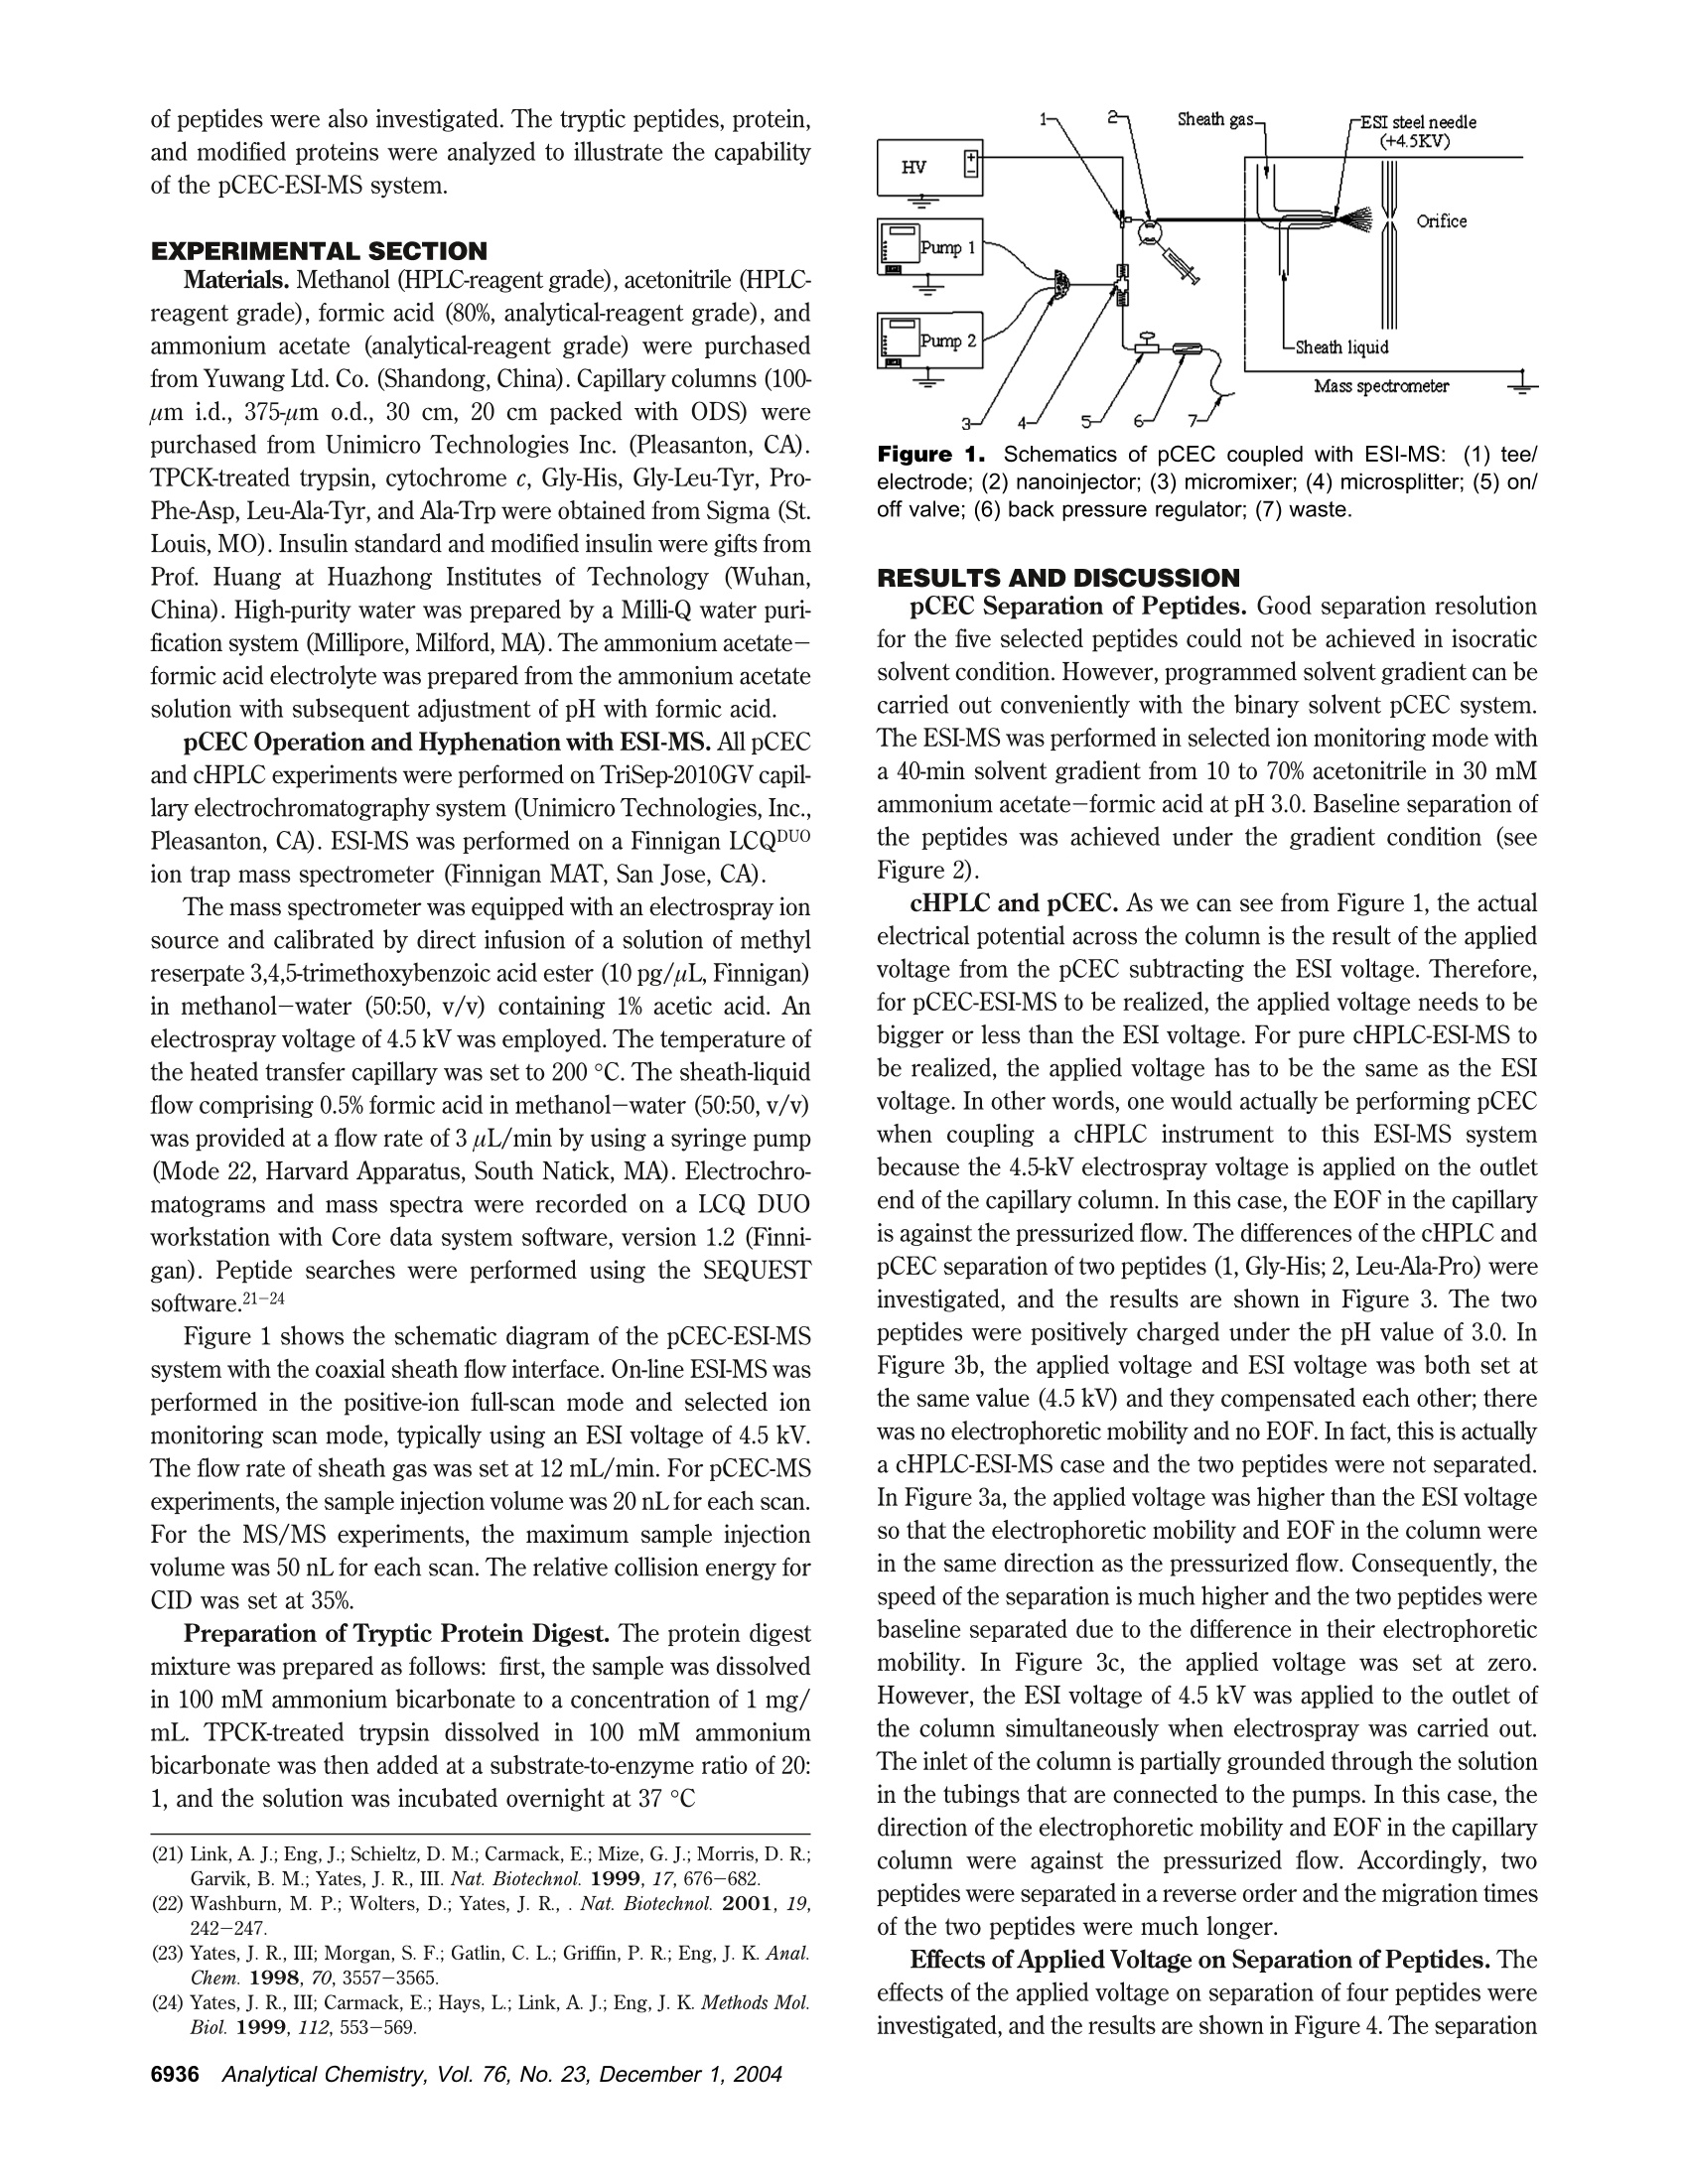
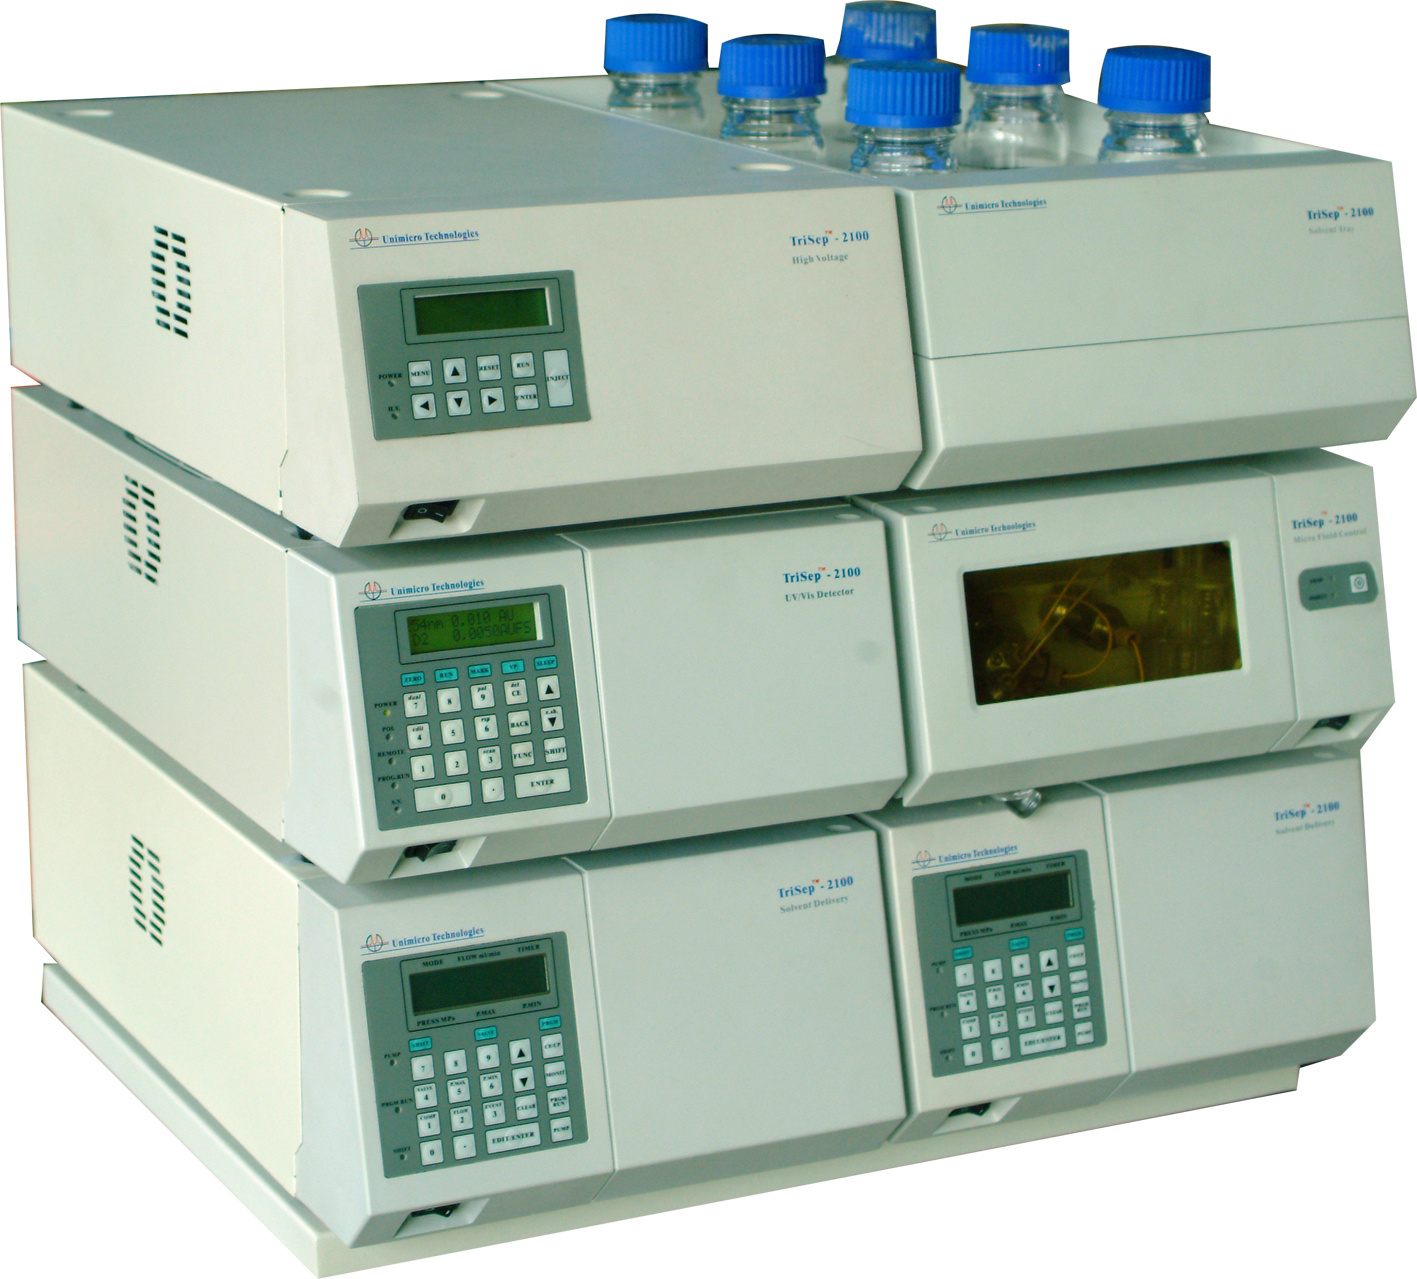
Anal. Chem. 2004, 76,6935-6940 Pressurized Electrochromatography Coupled withElectrospray lonization Mass Spectrometry forAnalysis of Peptides and Proteins Zhen Liang,t Jicheng Duan,t Lihua Zhang,t Weibing Zhang,t Yukui Zhang,t and Chao Yan*,t,# National Chromatography Research & Analysis Center, Dalian Institute of Chemical Physics, Chinese Academy of Sciences,Dalian 116011, China, and Unimicro Technologies, Inc., 1257 Quarry Lane, 105, Pleasanton, California 94566 Pressurized capillary electrochromatography (pCEC) wascoupled with electrospray ionization mass spectrometry(ESI-MS) using a coaxial sheath liquid interface. It wasused for separation and analysis of peptides and proteins.The effects of organic modifier and applied voltage onseparation were investigated, and the effects of pH valueof the mobile phase and the concentration of the electro-lyte on ESI-MS signal were investigated. The resolutionand detection sensitivity with different separation methods(pCEC, capillary high-performance liquid chromatogra-phy) coupled on-line with mass spectrometry were com-pared for the separation of a peptide mixture. To evaluatethe feasibility and reliability of the experimental setup ofthe system, tryptic digests of cytochrome c and modifiedprotein as real samples were analyzed by using pCEC-ESI-MS. Capillary electrochromatography (CEC) combines the bestfeatures of capillary electrophoresis (CE) and capillary high-performance liquid chromatography(cHPLC): high separationefficiency of CE and the versatile selectivity and large samplecapacity ofcHPLC.1-2 However, in practice, when CEC was usedwithout pressure, often on a commercial CE instrument, therewere problems and difficulties associated with bubble formationand column dry-out. These problems can be solved by a pressur-ized CEC (pCEC) system, in which a mobile phase is driven byboth a pressurized flow and an electroosmotic flow (EOF). In sucha system, pressure is applied to the capillary column to suppressbubble formation. Quantitative sample introduction in pCEC canbe achieved through a rotary-type injector. The EOF can eitherbe in the same direction as, or against, the pressurized flow.Therefore, the sample elution order may be manipulated. Mostimportantly, it is amenable for a solvent gradient mode, similarto that in HPLC,by programming the composition of eluents.34With pCEC, the promises of CEC can be fully exploited. *Correspondingauthorr. .EE-mail: chaoyan@unimicrotech.com.1.Tel.:925-846-8638. Fax: 925-846-3687. tDalian Institute of Chemical Physics. ( *Unimicro Technologies, Inc. ) (1) Knox, J. H.; Grant, I. H. Chromatographia 1991,32,317. ( ( 2) Colon, L. A.; Burgos, G.; M a loney, T. D .; Cintron, J. M.; Rod r iguez, R. L.Electrophoresis 2000, 21,3965-3993. ) ( ( 3) Zhang, K .; J iang,Z.; Yao, C.; Gao, R.; Yan, C. J. Chromatogr.,A. 2003,987, ) ( 453. ) ( (4) Jiang, Z.; Gao, R.; Zhang, Z.; Wang, Q.; Yan, C . J , Microcolumn Sep. 2001,13(5),191. ) ( 1 0.1021/ac0491410 CCC:$27.50 @ 2004 American Chemical Society Published on Web 1 1 /03/2004 ) Mass spectrometry (MS) provides high sensitivity and reliabledetection for various samples, particularly in biochemical applica-tions where the sample amount is very limited.5 Moreover, it offerssignificant information on the structure and identity of the analytes.Therefore, pCEC-MS plays an important role in the analysis ofbiological samples. However, the interface between pCEC and MSmight affect the performance of such hyphenation. Among all thedeveloped interfaces, an electrospray ionization (ESI) interfacepermits the mass spectrometric analysis of large biomolecules withmasses up to several hundreds of thousands within the low-massscan range, and it proves to be suitable for the coupling withHPLC, CE, CEC, and pCEC.6-20 Bayer et al.19,20 coupled pCEC with MS by using an ESIinterface for analysis of a crude extract of ergot fungus andenantiomers. They demonstrated convincingly the usefulness andpower of pCEC using the laboratory-made modular system. Inour report, cHPLC-ESI-MS and pCEC-ESI-MS were carried outusing the same experimental setup. The effects of the pH andthe concentration of the electrolyte in pCEC on ESI-MS signalintensity were studied experimentally and theoretically, and theeffects of applied voltage and the organic modifier on separation ( (5) Andren, P . E.; Emmett, M . R. ; Caprioli, R. M. J. Am. S o c. M a ss Sp e ctrom.1994, 5,867 - 869. ) ( (6) Whitehouse, C. M.; Drey e r, R. N .; Yamashita, M.; Fenn,J. B. Anal. Chem.1985,57,675-679. ) (7) Tomer, K. B.; Deterding, L. J.; Parker,C. E. Adv. Chromatogr. 1995,35,53-99. (8) Cai, J.; Henion, J. D. J. Chromatogr., A 1995, 703, 667-692. (9) Niessen, W. M. A.;Tjarden, U. R.; Van der Greef, J. J. Chromatogr. 1993,636,3-19. (10) Smith, R. D.; Udseth, H. R.; Wahl, J. H.; Goodlett, D. R.; Hofstadler, S. A.Methods Enzymol. 1996,271,448-486. (11) Smith, R. D.; Wahl, J. H.; Goodlett, D. R.; Hofstadler, S. A. Anal. Chem.1993,65,574A-584A. (12) Banks, J. F. Electrophoresis 1997, 18, 2255-2266. ( ( 13) H ugener, M.; T inke, A. P . ; Niessen, M. A . ; Tjaden, U. R.; V a n de r Gr e ef, J.J. Chromatogr.1993, 647,375- 3 85. ) (14) Lane, S. J.;Boughtflower,R.; Paterson, C.; Underwood, T. Rapid Commun.Mass Spectrom. 1995, 9,1283-1287. ( (15) Lane, S. J; Boughtflower, R. ; Paterson, C.; Morris, M. Rapid Commun. MassSpectrom. 1996, 1 0,733-7 3 6. ) ( ( 16) Y a n, C.; Schaufelberger, D .; Erni, F. J. Chromatogr . , A 1994, 670 ( 1-2 ) , 15. ) ( (17) Schmeer, K.; Behnke, B.; Bayer, E. An a l. Chem. 1995,67,3656-3658. ) ( ( 18) Wu,J. T .; Huang, P. Q .; Li,M. X.; Lubman, D . M . Anal. Chem. 1 9 97, 69,2908-2913. ) (19) Stahl, M.; Jakob, A.; Brocke, A.V.; Nicholson, G.; Bayer, E. Electrophoresis2002, 23, 2949-2962. (20) Brocke, A. V.; Wistuba, D.; Gfrorer, P.; Stahl, M.; Schurig, V.; Bayer, E.Electrophoresis 2002,23,2963-2972. of peptides were also investigated. The tryptic peptides, protein,and modified proteins were analyzed to illustrate the capabilityof the pCEC-ESI-MS system. EXPERIMENTAL SECTION Materials. Methanol (HPLC-reagent grade), acetonitrile (HPLC-reagent grade), formic acid (80%, analytical-reagent grade), andammonium acetate (analytical-reagent grade) were purchasedfrom Yuwang Ltd. Co. (Shandong, China). Capillary columns (100-um i.d., 375-um o.d., 30 cm, 20 cm packed with ODS) werepurchased from Unimicro Technologies Inc. (Pleasanton, CA).TPCK-treated trypsin, cytochrome c, Gly-His, Gly-Leu-Tyr, Pro-Phe-Asp, Leu-Ala-Tyr, and Ala-Trp were obtained from Sigma (St.Louis, MO). Insulin standard and modified insulin were gifts fromProf. Huang at Huazhong Institutes of Technology (Wuhan,China). High-purity water was prepared by a Milli-Q water puri-fication system (Millipore, Milford, MA). The ammonium acetate-formic acid electrolyte was prepared from the ammonium acetatesolution with subsequent adjustment of pH with formic acid. pCEC Operation and Hyphenation with ESI-MS. All pCECand cHPLC experiments were performed on TriSep-2010GV capil-lary electrochromatography system (Unimicro Technologies, Inc.,Pleasanton, CA). ESI-MS was performed on a Finnigan LCQDUOion trap mass spectrometer (Finnigan MAT, San Jose, CA). The mass spectrometer was equipped with an electrospray ionsource and calibrated by direct infusion of a solution of methylreserpate 3,4,5-trimethoxybenzoic acid ester (10 pg/uL, Finnigan)in methanol-water (50:50, v/v) containing 1% acetic acid. Anelectrospray voltage of 4.5 kV was employed. The temperature ofthe heated transfer capillary was set to 200 ℃. The sheath-liquidflow comprising 0.5% formic acid in methanol-water (50:50, v/v)was provided at a flow rate of 3uL/min by using a syringe pump(Mode 22, Harvard Apparatus, South Natick, MA). Electrochro-matograms and mass spectra were recorded on a LCQ DUOworkstation with Core data system software, version 1.2 (Finni-gan). Peptide searches were performed using the SEQUESTsoftware.21-24 Figure 1 shows the schematic diagram of the pCEC-ESI-MSsystem with the coaxial sheath flow interface. On-line ESI-MS wasperformed in the positive-ion full-scan mode and selected ionmonitoring scan mode, typically using an ESI voltage of 4.5 kV.The flow rate of sheath gas was set at 12 mL/min. For pCEC-MSexperiments, the sample injection volume was 20 nL for each scan.For the MS/MS experiments, the maximum sample injectionvolume was 50 nL for each scan. The relative collision energy forCID was set at 35%. Preparation of Tryptic Protein Digest. The protein digestmixture was prepared as follows: first, the sample was dissolvedin 100 mM ammonium bicarbonate to a concentration of 1 mg/mL. TPCK-treated trypsin dissolved in 100 mM ammoniumbicarbonate was then added at a substrate-to-enzyme ratio of 20:1, and the solution was incubated overnight at 37 C ( (21) Link, A. J; E n g, J.; Schie l tz, D. M.; Carmack,E. ; Mize, G. J. ; Mo r ris,D. R.;Garvik, B. M.; Yates, J. R., III. Na t . Biotechnol. 1999 , 17,676-682. ) (22) Washburn, M. P.; Wolters, D.; Yates,J. R.,. Nat. Biotechnol. 2001,19,242-247. ( (23) Yates, J. R ., I II; Morgan, S. F.; Gatlin, C. L.; Gr i ffin, P. R. ; En g , J. K . Anal.Chem. 1 998, 7 0,3557-3565. ) ( (24) Yates, J. R., III; Carmack, E.; Hays, L .; Link, A. J; Eng, J. K. Methods Mol.Biol . 1999,112, 5 53-569. ) Figure 1. Schematics of pCEC coupled with ESI-MS: (1)tee/electrode; (2) nanoinjector; (3) micromixer; (4) microsplitter; (5) on/off valve; (6) back pressure regulator; (7) waste. RESULTS AND DISCUSSION pCEC Separation of Peptides. Good separation resolutionfor the five selected peptides could not be achieved in isocraticsolvent condition. However, programmed solvent gradient can becarried out conveniently with the binary solvent pCEC system.The ESI-MS was performed in selected ion monitoring mode witha 40-min solvent gradient from 10 to 70% acetonitrile in 30 mMammonium acetate-formic acid at pH 3.0. Baseline separation ofthe peptides was achieved under the gradient condition (seeFigure 2). cHPLC and pCEC. As we can see from Figure 1, the actualelectrical potential across the column is the result of the appliedvoltage from the pCEC subtracting the ESI voltage. Therefore,for pCEC-ESI-MS to be realized, the applied voltage needs to bebigger or less than the ESI voltage. For pure cHPLC-ESI-MS tobe realized, the applied voltage has to be the same as the ESIvoltage. In other words, one would actually be performing pCECwhen coupling a cHPLC instrument to this ESI-MS systembecause the 4.5-kV electrospray voltage is applied on the outletend of the capillary column. In this case, the EOF in the capillaryis against the pressurized flow. The differences of the cHPLC andpCEC separation of two peptides (1, Gly-His; 2, Leu-Ala-Pro) wereinvestigated, and the results are shown in Figure 3. The twopeptides were positively charged under the pH value of 3.0. InFigure 3b, the applied voltage and ESI voltage was both set atthe same value (4.5 kV) and they compensated each other; therewas no electrophoretic mobility and no EOF. In fact, this is actuallya cHPLC-ESI-MS case and the two peptides were not separated.In Figure 3a, the applied voltage was higher than the ESI voltageso that the electrophoretic mobility and EOF in the column werein the same direction as the pressurized flow. Consequently, thespeed of the separation is much higher and the two peptides werebaseline separated due to the difference in their electrophoreticmobility. In Figure 3c, the applied voltage was set at zero.However, the ESI voltage of 4.5 kV was applied to the outlet ofthe column simultaneously when electrospray was carried out.The inlet of the column is partially grounded through the solutionin the tubings that are connected to the pumps. In this case, thedirection of the electrophoretic mobility and EOF in the capillarycolumn were against the pressurized flow. Accordingly, twopeptides were separated in a reverse order and the migration timesof the two peptides were much longer. Effects ofApplied Voltage on Separation of Peptides. Theeffects of the applied voltage on separation of four peptides wereinvestigated, and the results are shown in Figure 4. The separation 40 Tre jHir) Figure 2. pCEC-ESI-MS analysis of five peptides. pCEC conditions: column, 100-um i.d., 375-um o.d., 30-cm total length, 20 cm packedwith ODS; mobile phase, (A) acetonitrile; (B)30 mM formic acid-ammonium acetate; gradient, 10% A to 70% A in 40 min.; pressure, 7000 kPa;Applied voltage, 10 kV; injection volume, 20 nL. MS conditions: sheath gas, 12 unit/min; spray voltage, 4.5 kV; sheath liquid, 0.5% formic acidin methanol-water (50:50, v/v), 3 uL/min; scan range, 200-2000 u. Sample: 1, Gly-His; 2, Leu-Ala-Pro; 3, Pro-Phe-Asp; 4, Ala-Trp; 5, Gly-Leu-Tyr. rummlmn) Figure 3. Comparison of cHPLC and pCEC for separation of peptides. Conditions: mobile phase,70% acetonitrile in 30 mM ammoniumacetate-formic acid; sample, 1, Gly-His; 2, Leu-Ala-Pro; 20-50 ug/mL each. Other conditions as in Figure 2. of four peptides was improved by changing the applied voltage.When the applied voltage increased from 4.5 to 15 kV, theresolution of the separation of the four peptides became better.When the applied voltage decreased from 4.5 to 0 kV, theresolution of the separation of the four peptides also becamebetter. We could make a conclusion that the separation of sampleswould improve with the increase of the separation voltage. Theresolutions of peak pairs 1 and 2 and 2 and 4 were calculated,and the results are listed in Table 1. Effects of pH Value of the Mobile Phase on ESI-MS Signal.In ESI, the number of ions that escape from a droplet is relatedto the charge on the droplet, which can be derived from the spray ( (25) Liang, Z. ; Yang , Q.; Zhang, W. B.; Zhang, L . H.; Zhang, Y. K . C hro-matographia 2003, 57,617-621. ) current measurement. Formic acid-ammonium acetate buffershould be considered as a trinary-electrolyte system. We have25proposed equations for a trinary-electrolyte system. where Is is the S+ ion signal at MS detection; In is the H+ ion 0 2 4.5 8 10 15 RS1,2 0.58 0.36 0.18 0.43 1.71 2.72 RS2,4 2.22 1.17 0.81 0.15 0.65 1.70 signal at MS detection; INH is the NH+ion signal at MS detection;f represents the fraction of charges on the droplet that areconverted to the gas-phase ions; p is the fraction of gas-phase ionstransported into the mass analyzer; ks, kH, and knH are respectivelythe sensitivity coefficients for S+, H+, and NH4t; Ispray is totaldroplet current (spray current); and [S+], [H+],and [NH4+] arethe concentrations of S+, H+, and NH4t. For an increasingconcentration of electrolytes in solution, the spray currentincreases weakly with conductivity,26,27 where n <1. The effects of pH value of the electrolyte on the sample ionssignal intensity have been investigated, and the results are shownin Figure 5. It can be seen that the sample ion signal intensity ofGly-His increases with the increase of electrolyte pH value from2.5 to 2.7 and reduces as the increase of the electrolyte pH valuefrom 2.7 to 3.3. This phenomenon can be explained by eq 1. When ( ( 26) K ebarle, P .; Ho, Y . In Electrospray Ionization Mass Spectrometry; Co l e, R. B ., Ed.; Wiley: New York, 1997. ) ( (27) Van Berkel, G . J . In Electrospray Ionization Mass Spectrometry; Cole. R. B..Ed.; Wiley: New Y ork, 1997. ) Figure 5. Effects of pH value of the mobile phase on ESI-MS signal.Conditions: applied voltage, 19kV; mobile phase, 50 mM ammoniumacetate-formic acid/70% acetonitrile, pH 2.5-3.3.Other conditionsas in Figure 2. the electrolyte pH increases from 2.5 to 2.7, the sample ion hasbeen fully ionized and there is residue [H+] in the system. In thispH range, [H+] is the dominant factor on the intensity of thesample ions signal. Accordingly, eq 1 can be further modified asthe following. When the pH of the electrolyte increases from 2.5 to 2.7, kH[H+]decreases. Accordingly, Is increases. When the electrolyte pH Figure 6. Effects of the concentration of the mobile phase on ESI-MS signal. Conditions: applied voltage, 19 kV; mobile phase, 10-70 mM ammonium acetate-formic acid/70% acetonitrile, pH 3.0.Other conditions as in Figure 2. increases from 2.7 to 3.3, the sample ions are not fully ionized,and [NH4+] is the dominant factor on the sample ion signal intens-ity. Consequently, eq 4 can be further modified as the following. In this pH range, Ks[S+] decreases and kNH [NH4+] increases. Is is reduced with the increase of [NH+] concentration. For Pro-Phe-Asp, the sample ions signal intensity reduces in the investi-gated pH range, which could also be explained by eq 6. Effect of Electrolyte Concentration on ESI-MS Signal.Theeffect of the electrolyte concentration on the ESI-MS signal hasbeen investigated, and the results are shown in Figure 6. For Gly-His, maximum sample signal intensity was achieved with 50 mMformic acid-ammonium acetate at pH 3.0. At lower concentrationsof 10 and 30 mM formic acid-ammonium acetate, the samplesignal intensity decreased. One possible explanation for thisbehavior is that at lower concentration the 5potential of the capil-lary surface increases and therefore enhances the adsorption ofpeptides to the capillary surface, which leads to band broadening.Accordingly, the sample ions signal intensity is reduced. Whenthe electrolyte concentration increased from 50 to 70 mM, thesample ions signal intensity decreased too. This might be causedby the high NH4t concentration, which competed with the sampleions in the conversion process from solution to gas-phase ions. pCEC-ESI-MS Analysis of Tryptic Peptides. Separation andidentification of a tryptic digest of cytochrome c were chosen totest the applicability of pCEC-ESI-MS. A background mobile phasecomposed of 5% acetonitrile in 50 mM ammonium acetate-formicacid at pH 3.0 was selected as the initial condition, where all ofthe peptides were protonated. The direction of the electroosmoticflow and electrophoretic mobility in the mobile phase was thesame. ESI-MS detection conditions of the tryptic peptides shouldbe divided into three sections. First, ESI-MS was performed inthe positive-ion, full-scan mode to detect all the ions from theheated capillary to the ion trap. Then, it was automatically changed Figure 7. pCEC-ESI-MS analysis of tryptic digests of cytochrome c. Conditions as in Figure 2. Table 2. Results of SEQUEST Database Search retention measured calculated position sequence time (min) charge mass mass 9-13 IFVQK 26.91 +1 634.4 633.8 9-22 IFVQKCAQCHTVEK 43.22 +1 1633.2 1633.9 28-36 TGPNLHGLF 40.46 +1 955.3 955.4 28-38 TGPNLHGLFGR 41.39 +2 585.1 585.1 39-53 KTGQAPGFTYTDANK 36.38 +2 800.1 799.4 40-53 TGQAPGFTYTDANK 37.26 +2 736.1 736.0 56-60 GITWK 33.13 +2 604.1 603.3 61-72 EETLMEYLENPK 42.50 +1 1495.3 1495.7 +5 Tme(min Figure 8. pCEC-ESI-MS analysis of modified proteins. Conditions: applied voltage, 10 kV; mobile phase, 50 mM ammonium acetate-formicacid/50% acetonitrile, pH 3.0. (a) Chromatogram of modified insulin; (b) chromatogram of insulin. Other conditions as in Figure 2. to ZoomScan mode detection of the charge of the ion when theion signal intensity on MS was bigger than 5 × 10⁻⁴ counts.Finally, it automatically changed to MS/MS mode analysis of theion. Figure 7 shows the full-scan electrochromatogram by usingpCEC-ESI-MS of the tryptic peptides where a total of 13 of the 23peaks could be directly identified from the database as digestedpeptides of cytochrome c. Table 2 shows the results of a SEQUESTdatabase search. Additional structure information could be ob-tained by tandem MS/MS analysis of selected peaks performedon the digest peaks, as shown in Figure 7 (right). pCEC-ESI-MS Analysis of Modified Protein. Analysis ofmodified protein was carried out to prove the capability of thepCEC-ESI-MS. Insulin (molecular weight 5778) was modified byusing cholic acid (molecular weight 408). A mobile phasecomprising 50% acetonitrile in 50 mM ammonium acetate-formicacid at pH 3.0 was used for the pCEC separation of the modifiedinsulin. The sheath liquid was methanol-water (50:50, v/v) with0.5% formic acid added. Figure 8a shows the electrochromatogramof insulin with modification. Figure 8b shows the electrochro-matogram of insulin (from pig) without modification. It can be seen that modified insulin separated to four peaks, but insulinwithout modification was only a single peak. According to the full-scan mass spectra of insulin and the molecular weight information,the second peak in Figure 8a was clearly identified to be insulin.The molecular weights of other peaks were calculated to be 5818,6209, and 6250, respectively. These results show that the insulinwas indeed modified. Detailed identification of these peaks is inprogress and will be discussed in future work. ACKNOWLEDGMENT This work supported by funding from State Key FundamentalResearch (973 Project-Grant 001CB510202). National NatureSciences Foundation of China (Grants 20105006,20175029, and20375040), and Chinese Academy of Sciences is gratefullyacknowledged. We also thank Prof. Huang for his gifts of proteinand modified protein samples. Received for review June 11, 2004. Accepted September16,2004. ( AC0491410 ) Analytical Chemistry, Vol. No. December ,
关闭-
1/6

-
2/6
还剩4页未读,是否继续阅读?
继续免费阅读全文产品配置单
上海通微分析技术有限公司为您提供《上海通微加压毛细管电色谱-质谱联用技术在多肽和蛋白质领域的应用》,该方案主要用于其他中null检测,参考标准《暂无》,《上海通微加压毛细管电色谱-质谱联用技术在多肽和蛋白质领域的应用》用到的仪器有通微TriSep2100加压毛细管电色谱。
我要纠错
相关方案
 咨询
咨询