方案详情文
智能文字提取功能测试中
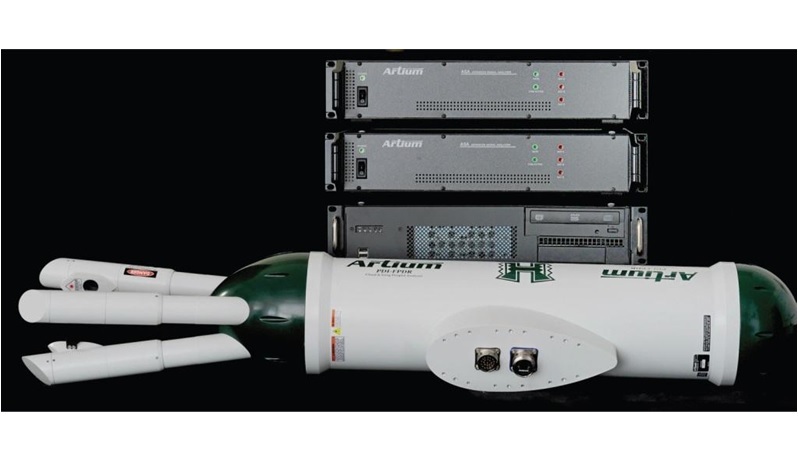
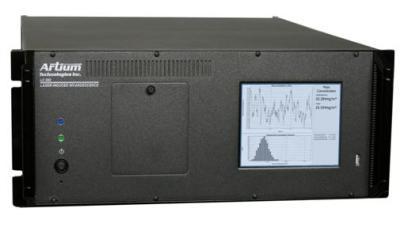
Urea Injection Design Analysis for NOx Control using CFD A Service of Spraying Systems Co. Urea Injection Design Analysisfor NO, Control using CFD As presented at: 10th International Conference on Combustion and Energy Utilization,Mugla, Turkey, May 2010 Kathleen Brown*,Wojciech Kalata and Rudolf J. Schick Spraying Systems Co. Wheaton,IL 60187 USA There are many industrial pollutants produced fromcoal fired power generation plants. Recent legislation ispushing to reduce these emissions. Greenhouse gassesas well as nitrous oxides (NOx) and sulfur dioxide (SO2) arethe targeted pollutants.Governmentallegislation outlinedby Environmental Protection Agency (EPA) throughits Maximum Achievable Control Technology (MACT)guideline is a major thrust. One method of NOx reduction is selective non-catalyticreduction(SNCR) which is implemented prior to gasesventing to the atmosphere. In SNCR systems a reagentis injected into the flue gas, in an effort to reduce NOxlevels by up to 50%. The operation of this equipment ishighly dependent on the temperature and distribution ofthe gases requiring careful control of the system. Spraynozzles are an important factor in this process; spraynozzles add value by providing controlled volumes of liquid with predictable drop size and consistent spray coverage.Knowing these values remains vital for the optimization ofgas conditioning processes. In addition, the all-important placement of nozzles isoften times misunderstood and therefore inaccurate.While immense care is taken to optimize placement, thisoften leads to failure due to the inability to predict sprayperformance in the application environment. This processcan be facilitated by using computationalfluid dynamics(CFD). In this case study, CFD is used to simulate NOx levelsproduced in the coal combustion process and estimatethe NOx reduction that can be achieved with the ureainjection. In the end, adjustments were made to originalnozzle placement suggestions in order to optimize gasconditioning process while minimizing the slip through thesystem. Spray Nozzles Introduction An important concern in air pollution control is thetreatment of exhaust gases from power plants andindustrial plants, so as to drastically limit the amountof pollutants entering the atmosphere. One of thesepollutants is NOx, which is defined as the collectiveterm for nitrogen oxide gases. There are severalmethods of NOx formation including: thermal NOx,promptNOx, and fuel NOx. The most prevalent form isthermal NOx-which is formed at the areas of highesttemperature during the combustion process. NOx isa complex process which occurs in pre-combustion,combustion and post-flame regions. There are severalapproaches to NOx abatement and reductions. Thisstudy focuses solely on emission control by flue gastreatment using selective non-catalytic reduction(SNCR). For SNCR systems, a reagent such as urea orammonia is injection into the flue gas.NOxreductionsof 30%-50% can be achieved. The reaction betweenreagent and NOx should occur within a temperaturerange of 900°℃ and 1,100°C depending on the reagentand condition of SNCR operation [1]. Above thisrange there may be reductions in efficiency due tothe thermal decomposition of ammonia. Below thistemperature range, slip or carryover may increase.The aim is to injection the reagent with droplets thatprovide a residence time in excess of one second.However a minimum residence time of 0.3 seconds isrecommend for adequate effectiveness [1]. Ammonia slip or carryover is a prevalent issuewith SNCR control techniques. This occurs from EQUIPMENT & METHODS Approach The process of designing the gas conditioningprocess begins with determining the amount of liquidrequired for reaction with NOx levels measured.Inaddition the optimal drop size is also determined andthe drop size in this case will be a function of thedwell time. Drop Size Specification Proper chemical interaction is dependent on liquid injections at temperatures below the aforementionedtemperature window or from too much mass perinjector leading to uneven distribution. Current methods rely on using spray injectors todeliver the urea or ammonia fluid into the flue gasstream. Spray injectors add value by providingcontrolled quantities of liquid and predictable dropsize and spray coverage. This data is critical forefficient NOx control with minimal slip or carryover.While this method has yielded some success, it haspresented a series of problems due to the inability toaccurately predict spray performance in the complexenvironment as required. Today, computationalfluid dynamics (CFD) is well suited to predict flowconditions and aid in the optimization of these exhaustsystems. Today, there is no standard method in use forselecting and optimizing fluid sprays for gasconditioning applications. This paper will outlinea case study in which injectors were selectedand positioned based on the critical elementsof combustion chamber design and injectorcharacteristics. This method consists of injectorselection and location considerations based onknown laboratory measurements of drop size, velocityand spray distribution.Furthermore, this methodwill also evaluate the effects of "normal" operatingparameters such as flue gas flow rate, flue gas andcombustion chamber temperature, and flue gasvelocity on exhaust uniformity. atomization and a controllable drop size distribution toensure a rapid evaporation rate and eliminate a wallwetting problem causing down time (1). Wall wettingproblems can be caused by atomizers that producelarge drops that do not achieve full evaporation withinthe allowable dwell time in the duct. The processto determine the maximum allowable drop size isgoverned by the following equation: · tis dwell time in seconds · Do is the initial diameter of the drop in microns Lp.lig · K is the Thermal Conductivity of the gas. · T is the gas temperature ·Twb is the Wet-Bulb Temperature of the system ·L is the Latent Heat of Vaporization of the liquidPlig is the density of the liquid. Nozzle Specification Generally, large volume, two fluid atomizers are usedin large scale industrial processes. These types ofnozzles are preferred because they are able to controllarge and/or frequent variations in gas temperature orvolume, provide consistent predictable drop size andare energy efficient. Based on the required flow rate and drop size valuesdetermined above, a Spraying Systems Co. WhirlJet@BD-5 nozzle was used in this case study. TheWhirlJet@ nozzle is a hydraulic atomizer, featuring aninline hollow cone design for ease of installation andreduced footprint. It consists of a main liquid inlet inline with the orifice. The flow is diverted into a swir|chamber and the liquid is discharged tangential to theorifice. The orifice is relatively large minimizing therisk for clogging. The principal of operation is as follows. The liquidenters the swirl chamber and exits tangential to theorifice. The liquid experiences a high shear and isbroken into sheets. The sheets experience turbulenceand additional shear causing further atomization. Alltesting was performed with each WhirlJet@ injectormounted on a single lance body. A schematic of theWhirlJet@ BD-5 nozzle used in this test is shown inFig. 1. Spray characterization testing was performedfor several nozzles to determine optimal injectionproperties for the CFD model, based on the theoreticalrequirements. Figure 1. Nozzle - Inline WhirlJet@BD5 For drop sizing, the nozzles were mounted on a 3-axistraverse. Drop size testing was performed in a singleplume of the spray. Drop size measurements wereexecuted at multiple locations, based on nozzleperformance. A two-dimensional Artium Technologies PDI-200MDinstrument was used to make drop size and velocitymeasurements, as shown in Fig. 2, the test setup isshown in Fig. 3. The solid state laser systems (green532 nm and red 660 nm) used in the PDI-200 MD areClass 3B lasers and provide about 50-60mW of powerper beam. This is an intense enough laser powerto help offset dense spray effects. [2,3, 4]. The testresults are shown in Table 1 and Fig. 4. Figure 2. Artium PDPA Figure 3. Empirical Setup Figure 4. Injection Location Inline WhirlJetQ Nozzles (hollow cone) units BD5 Velocity magnitude m/s 30 gpm 1.6 ma kg/s 0.1008 Pressure psig 100 Temperature 20 Spray Angle 76 Dvo.01 - minimum um 23 Dvo.5o-average um 200 Dvo.99-maximum m 298 N 3.0 Lance Insertion Depth m 0.1524 a. Spray drops treated as inserted urea/water particles. Wetcombustion modeling used with urea as devolatizing species and wateras evaporating species Table 1. Injector properties as acquired empirically The DV0.5 and D32 diameters were used to evaluatethe drop size data. The drop size terminology [5, and 6]is as follows: DV0.5: Volume Median Diameter (also knownas VMD or MVD). A means of expressing dropsize in terms of the volume of liquid sprayed. TheVMD is a value where 50% of the total volume(or mass) of liquid sprayed is made up of dropswith diameters larger than the median value and50% smaller than the median value. This diameteris used to compare the change in drop size onaverage between test conditions. DV0.1: is a value where 10% of the total volume(or mass) of liquid sprayed is made up of dropswith diameters smaller or equal to this value. DV0.9: is a value where 90% of the total volume(or mass) of liquid sprayed is made up of dropswith diameters smaller or equal to this value. All pressures were monitored immediately upstreamof the nozzle body using a 0-7 bar, class 1A pressuregauge.Liquid flow to the nozzle was delivered usinga positive displacement pump. The flow rate wasmeasured previously using a MicroMotion D6 flowmeter and was correlated to nozzle pressure settings. The MicroMotion flow meter is a Coriolis Mass flowmeter that measures the density of water to determinethe volume flow. The meter is accurate to ±0.4% ofreading. The Rosin-Rammler distribution function is used toconvert raw measured drop data into a drop sizedistribution function for CFD. The Rosin-Rammlerdistribution function (2) is a representation of the droppopulation and size in a spray. The exact size for everyvolume fraction F(D) in the spray can be calculatedusing the X and N parameters. CFD Analysis Method Computational Fluid Dynamics (CFD) is the scienceof predicting fluid flow, heat and mass transfer,chemical reactions, and related phenomena bysolving numerically the set of governing mathematicalequations. For the computation the general CFD codeFluent is applied. Fluent solvers are based on the finitevolume method. The fluid region is broken into a finiteset of control volume (mesh). The general conservation equations are applied. Eachvolume within the mesh is simultaneously solved torender the solution field. The conservation equationsare shown below (3-5)[7]. Conservation of mass: Conservation of momentum: (4) Conservation of enthalpy: (a,ph)+V.(a,pugh)=-(Pa+z:vu,-v.q,+s,+Z(0+mh)p=1 General Application Requirements In the framework of the Eulerian-Lagrangian modelingapproach, coal particles are inserted using thenon-premixed model. The parameters of the coal andgas conditions are shown in tables 1-2. Meshing wasperformed with a GAMBIT pre-processor. Dense meshwas incorporated in the areas very near the injectionlocations and coal injection locations. Size functionswere used to further refine mesh size. The 3D meshconsisted of mixed elements with approximately3.2 million cells. Figure 5 provides a schematic ofthe CFD model setup and defines the coordinatesystem referenced in both the computational andexperimental results. Ultimate Proximate Carbon 79.92 Ash 10.6 Hydrogen 5.13 Volatile Matter 32.0 Uxygen 8.78 Fixed Carbon 46.2 Nitrogen 1.29 Moisture 11.2 Sulfur 2.13 lable 2. Chemical and Thermo Physical Propertiesof the Fuel Gas parameters Symbol Units Total Primary Air (mass flow) m lb/hr 135648 Secondary Air (mass flow) m2 lb/hr 424637 Operating pressure P psia 14.7 PA oper. Temperature T °F 160 SA oper. Temperature T2 °F 550 Coal (mass flow) m3 tons/hr 37.68 Specific heat capacity C, J/kgK PWL (6) Thermal conductivity W/m·K 0.0454 Table 3. Physical Properties of the Gas Figure 5. Geometry Overview The CFD model was set up with mass flow inletboundary conditions at the primary and secondaryair inlets. The outlet side of the chamber was definedwith a constant pressure boundary condition. Thecombustion chamber and lance walls were specifiedas rigid with no-slip and adiabatic conditions.Throughout all simulations the following models wereincluded: k-e Realizable Turbulence Model,DPMfor LaGrangian tracking of coal particles and ureadroplets, and Species Transport Model to includecombustion of coal based on volumetric reactionrates and urea reaction with NOxspecies createdduring combustion. Spray pattern is predicted bytracing droplets’trajectories in the simulation.Inthe DPM model, a droplet's trajectory is obtained bynumerical integration of Newton's second law: Interfacial force density accounts for the couplingbetween the movement of gas and the liquid droplet;and g is the gravitational acceleration. In the flowanalyzed there, the drag force is a primary mechanismof gas-droplet interaction, which can be computed as: RESULTS & DISCUSSION Results Many different simulations have been made todetermine where and how to place the injectorsto achieve optimal NOx reduction. Fig. 7 shows thegas flow pathlines and expected travel of the coalparticulate. From this, area of recirculation and highswirl can be avoided as potential injection locations. where U is the gas viscosity, D, is the dropletdiameter, Rep is the droplet Reynolds number andCp is the drag coefficient. The drag coefficient wascomputed from the law of Moris and Alexander [7].After a droplet's velocity is solved, its location can beintegrated out from the trajectory equation: Initial states (velocity, injection direction) of liquiddroplets from the spray nozzle are determined by labexperiments and are given as inputs in the simulation.The Rosin-Rammler distribution is used in thesimulation to represent the droplet size variation [8]. The gas phase, combustion and particle tracking wereperformed in steady state. The P-1 radiation modelwas used due to the high temperatures associatedwith the combustion. This is the simplest formulationof the more general P-N radiation model, which isbased on the expansion of the radiation intensity l intoan orthogonal series of spherical harmonics [9]. Gas velocity is another important factor in determininglocations of injections inside of a large system.Velocity is expected to control particle tracks due tothe relatively high velocity of the gas flow comparedto the momentum of the droplet injected into thesystem. Gas velocity is shown in Fig. 8 below. Figure 8. Velocity Profiles Velocity peaks are found at the primary andsecondary air inlets. The velocity magnitude andturbulence remain fairly low above the burners.There is one elevated velocity area with recirculationdirectly above the burners (gas flow inlet). For thisreason the injectors were located outside of therecirculation zone. Another important factor for efficient NOx removal istemperature. The reaction between reagent and NO,should occur within a temperature range of 900°Cand 1,100℃ depending on the reagent and conditionof SNCR operation[1]. Above this range theremay be reductions in efficiency due to the thermaldecomposition of ammonia. Below this temperaturerange, slip or carryover may increase. Temperatureprofiles are shown in Fig. 9. Figure 9. Temperature Profiles The injection locations were selected based ontemperature profiles. Injector locations were locatedin areas of desirable temperature and velocityprofiles. Some restrictions on injector locations wereset based on physical constraints and accessibility. A simulation was performed to evaluate the NOx levelsprior to the reagent injection. Fig. 10 contains theNOx profiles calculated by the simulation. The outletsurface is used to determine the approximate NOxlevels that could be expected to be exhausted. Theaverage NOx level across the outlet is 156.3ppmvd. Figure 10. NOx Level Profiles Fig. 11 shows the injection locations and particletracking. Particles are colored based on drop size.In this simulation, the injections are comprised of93% water and 7% urea. Liquid water concentrationcontours and particle tracking results indicatedthat all spray particles are evaporating without acontact with walls. Evidence of this can be seenfrom evaluation of the injection tracking as shown infig. 11. Though the injections are all operating at thesame parameters, injection plumes vary based onvariations in temperature and velocity profiles of theenvironment. Figure 11. Injection Tracking - Drop Size Post analysis was performed to determine theimpact of the injected reagent on temperature andNOx profiles. The results of these simulations arecontained in fig.12-13. Figure 13. NOx Profiles - Post Urea Injection The resulting temperature profile indicates a slightreduction in temperatures in the injection region. Thewater injected was found to be 100% evaporatedprior to the turn into the exit. There was found to beno contact with the walls in the combustion chamberfrom both the water and urea agent. No foreseeableareas of recirculation indicate that there is essentialno potential issues with wall wetting or wall buildup/damage. The resulting NOx values indicate a favorable result inNOx reduction. The outlet surface is used to determinethe approximate NOxlevels that could be expectedto be exhausted with urea injections. The averageNOx level across the outlet is 87.5ppmvd with ureainjections. This would indicate an approximate 44%reduction in NOx levels. This would indicate a fairlyefficient reduction based on the input level of theurea. The outlet surface was also examined to determinethe expected carryover of urea. The value ofcarryover was calculated to be 2.325e-21kg/s throughthe outlet. This would indicate that carryover isnegligible. Computational Fluid Dynamics (CFD) was used tooptimize injection location and orientation in a coalcombustion application. Through a case study, manydifferent factors which impact the NOxreduction were quickly investigated and prioritized. The aim of thisstudy was to demonstrate effectiveness of applyingCFD tools in such applications to reduce risk andevaluate environmental impact of designs. 1. IEA Clean Coal Centre,www.iea-coal.co.uk, Mar. 2010. 2. Abrams, J.Z., Baldwin, A.L., Higgins, S., Rubin A.G.,“Demonstration of Bechtel’s Confined Zone DispersionProcess at Pennsylvania Electric Company's Seward Station," International Power Generation Conference,October 1991, San Diego, CA. ASME Paper No: 91-JPGC-EC-5. 3. Bachalo, W.D. and Houser, M.J., "Phase Doppler Spray Analyzer for Simultaneous Measurements of DropSize and Velocity Distributions," Optical Engineering,Volume 23, Number 5,September-October, 1984. 4. Bachalo, W.D. and Houser, M.J.,"Spray Drop Size and Velocity Measurements Using the Phase/DopplerParticle Analyzer", Proceedings of the ICLASS (3rd Intl.), July 1985. 5. R.J. Schick, “A Guide to Drop Size for Engineers," Spraying Systems Co. Bulletin 459. 6. E1296-92: Standard Terminology relating to liquid particle statistics. "1996 Annual Book of ASTM Standards,General Methods and Instrumentation, Volume 14.02 pp. 810-812". 7. Morsi, S.A. and Alexander, A.J.,“An Investigation of Particle Trajectories in Two-Phase Flow Systems,"Journal of Fluent Mechanics, Vol. 55,pp. 193-208,1972. 8. Li, G.L., Messah, H., Schick, R.J., "Numerical Simulation of Spray Pattern in a Liquid Flashing Column",ILASS Americas 20th Annual Conference, May 2007, Chicago, IL. 9. Fluent Inc. Fluent 6.3 User's Guide,Lebanon, NH, 2009. Experts in Spray Technology Spray Analysisand Research Serviceswww.sprayconsultants.comA Service of Spraying Systems Co.
关闭-
1/9
-
2/9
还剩7页未读,是否继续阅读?
继续免费阅读全文产品配置单

北京欧兰科技发展有限公司为您提供《尾气,烟气,尿素中喷雾液滴粒径,速度检测方案(气溶胶)》,该方案主要用于废气中喷雾液滴粒径,速度检测,参考标准《暂无》,《尾气,烟气,尿素中喷雾液滴粒径,速度检测方案(气溶胶)》用到的仪器有Artium PDI-FP 双量程可机载飞行探头、激光相位多普勒干涉仪LDV,PDI,PDPA,PDA、激光诱导白炽光(LII)烟气分析仪。
我要纠错
推荐专场

烟气监测(CEMS)/烟气分析仪
更多
相关方案
 咨询
咨询