方案详情文
智能文字提取功能测试中
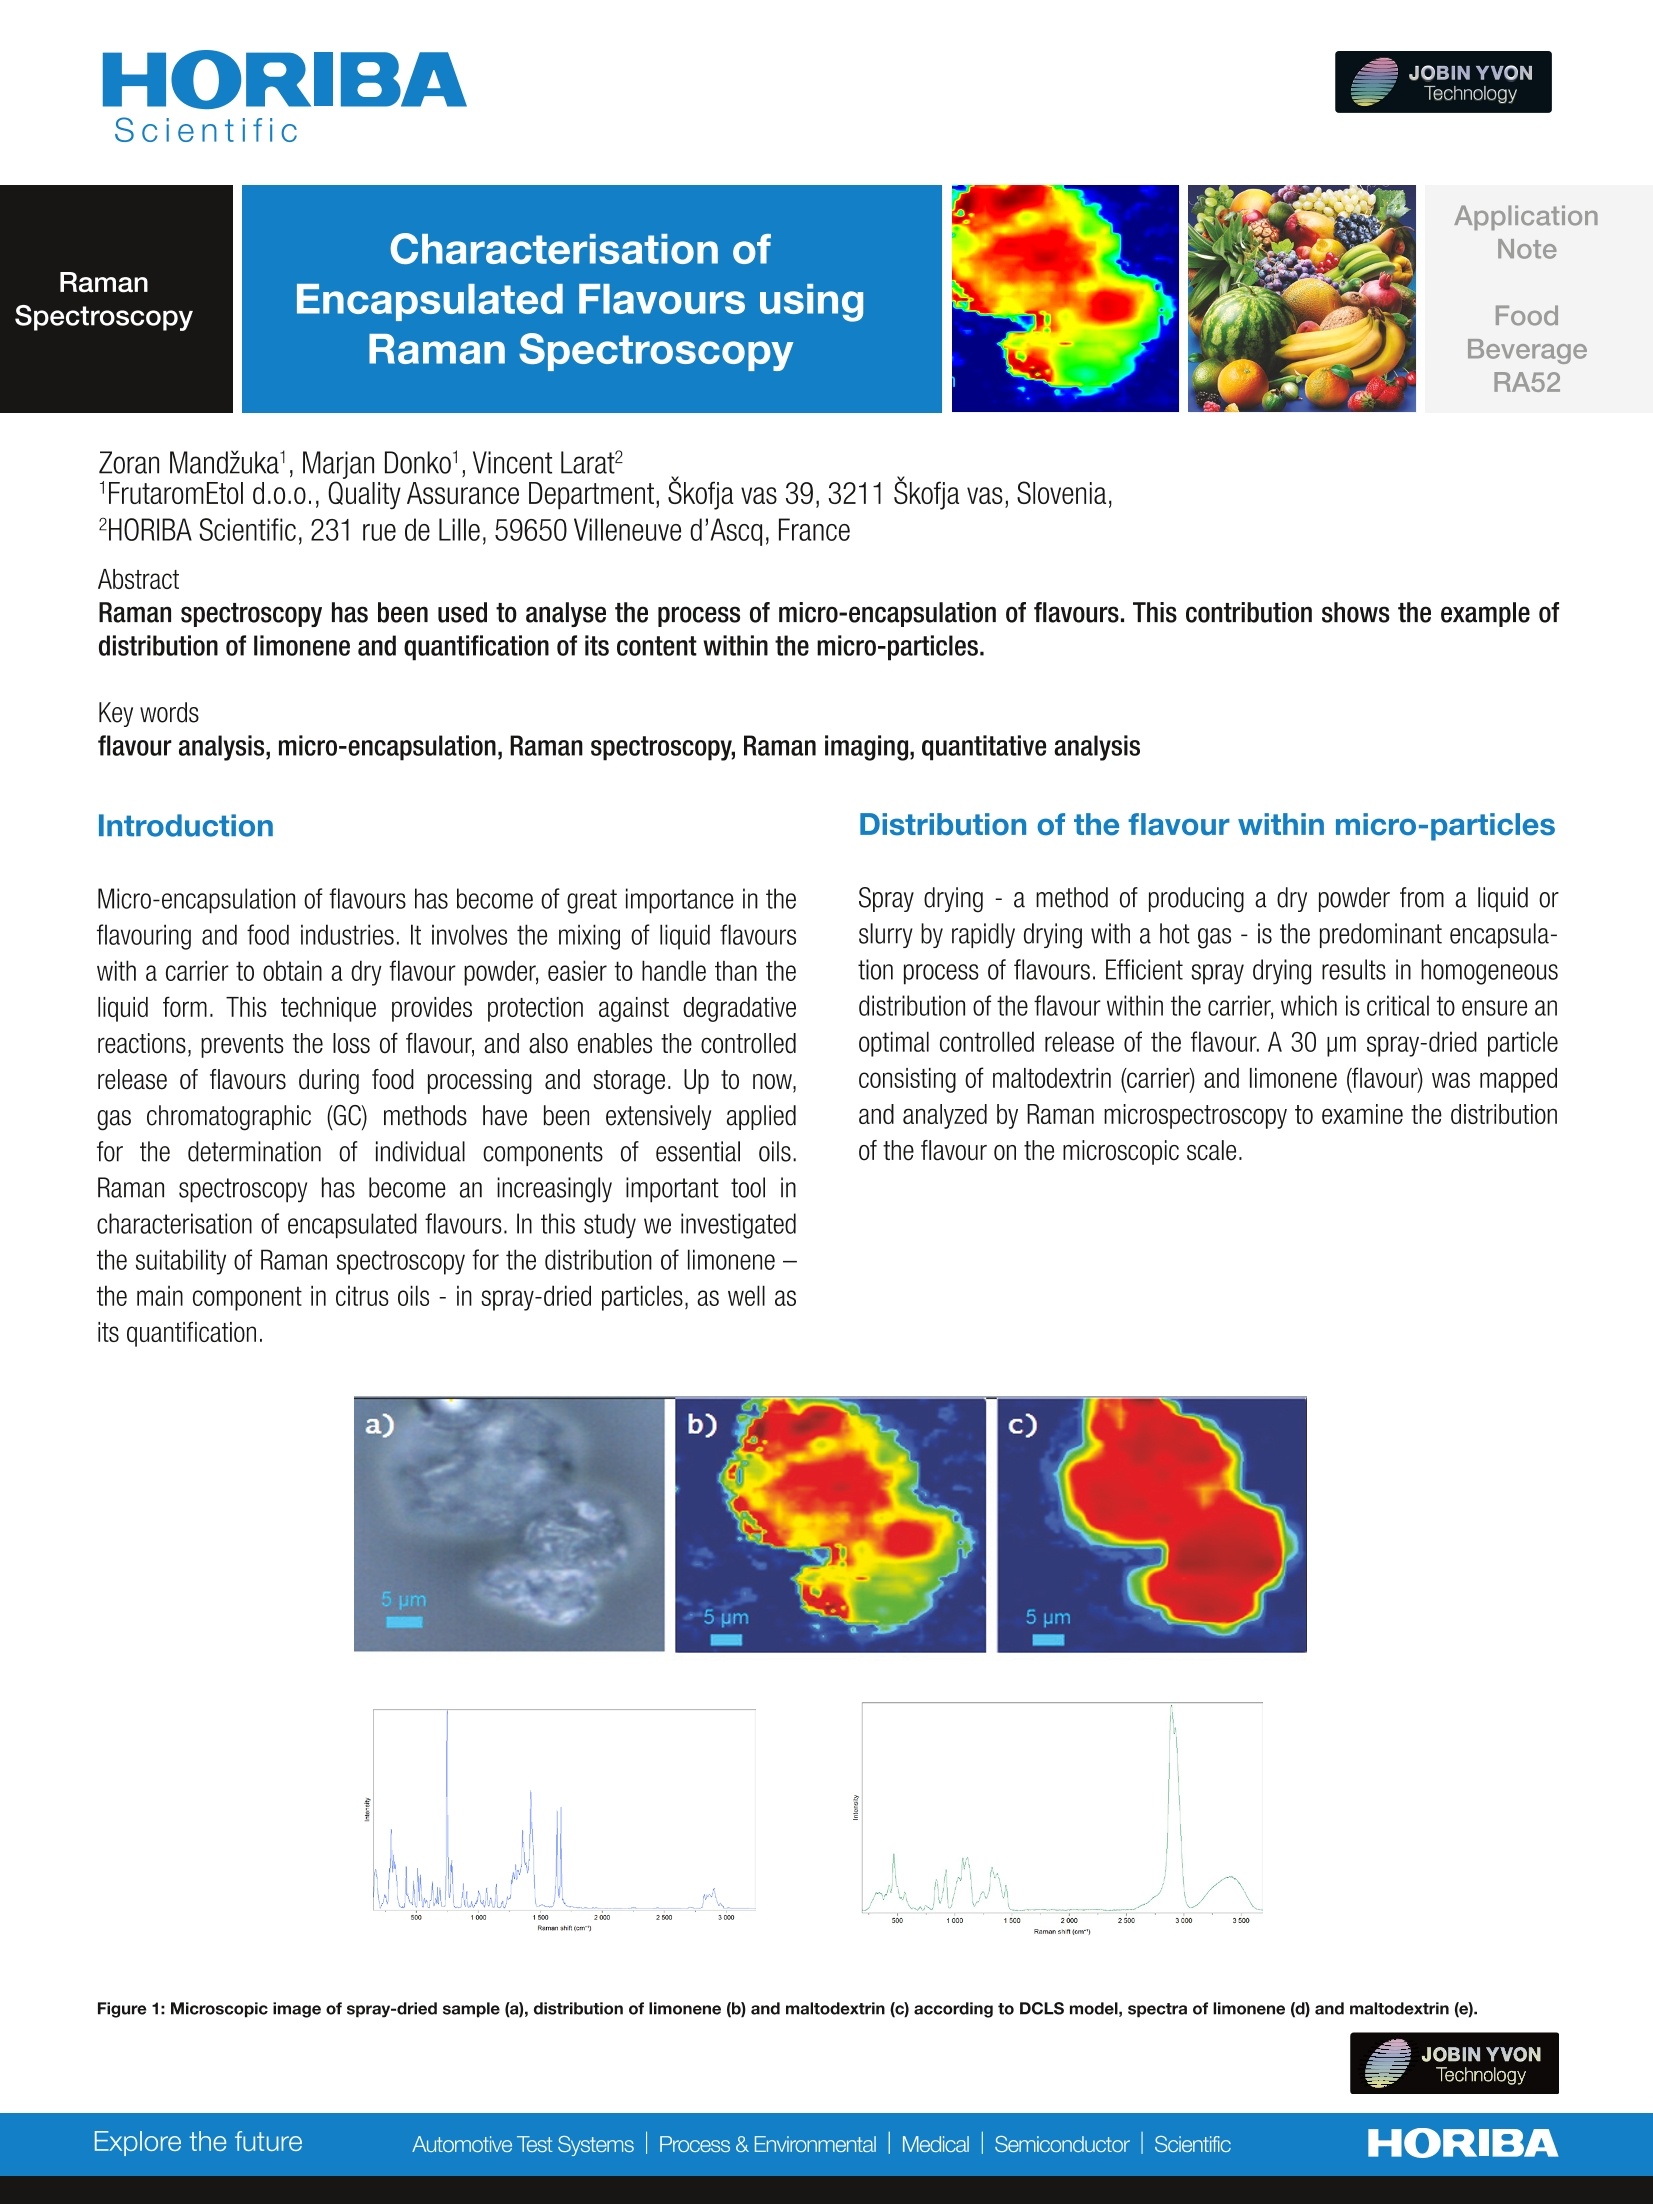
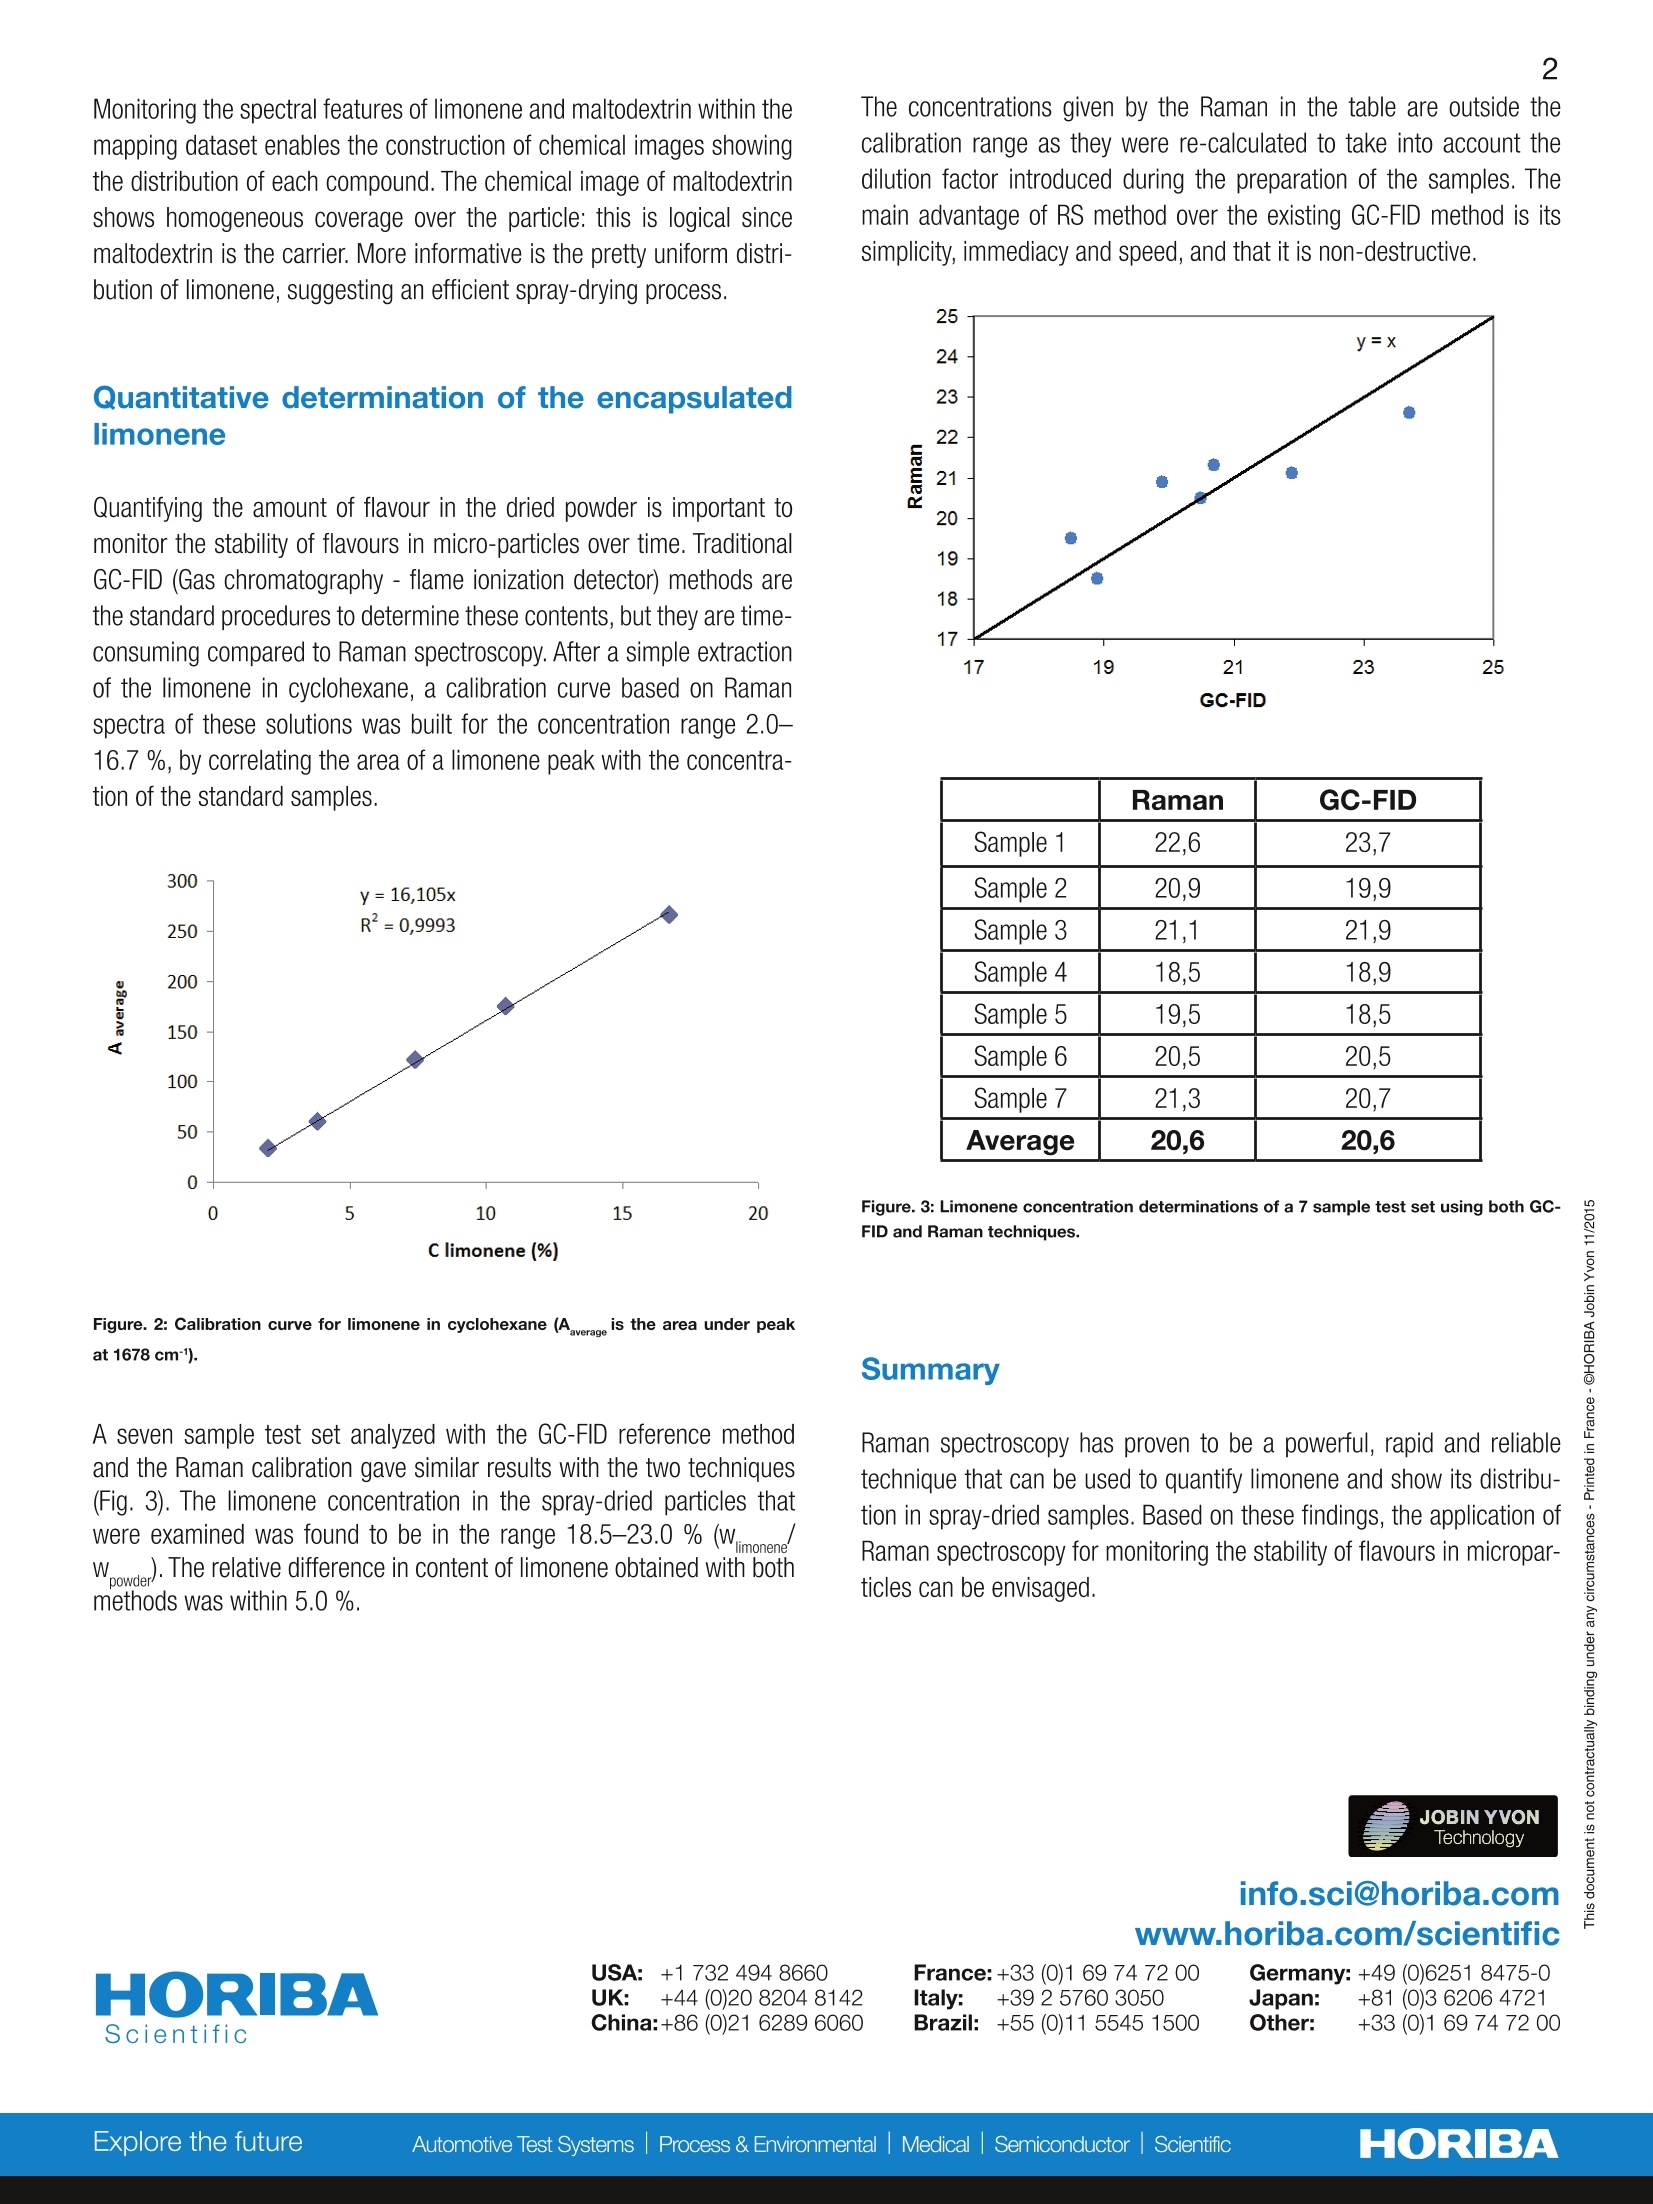
2 Scientific Characterisation ofEncapsulated Flavours usingRaman Spectroscopy Application Note Raman Spectroscopy FoodBeverage RA52 Zoran Mandzuka1, Marjan Donko1, Vincent Larat? FrutaromEtol d.o.o., Quality Assurance Department, Skofja vas 39, 3211 Skofja vas, Slovenia, 2HORIBA Scientific, 231 rue de Lille, 59650 Villeneuve d'Ascq, France Abstract Raman spectroscopy has been used to analyse the process of micro-encapsulation of flavours. This contribution shows the example ofdistribution of limonene and quantification of its content within the micro-particles. Key words flavour analysis,micro-encapsulation, Raman spectroscopy, Raman imaging, quantitative analysis Micro-encapsulation of flavours has become of great importance in theflavouring and food industries. It involves the mixing of liquid flavourswith a carrier to obtain a dry flavour powder, easier to handle than theliquid form. This technique provides protection against degradativereactions, prevents the loss of flavour, and also enables the controlledrelease of flavours during food processing and storage. Up to now,gas chromatographic (GC) methods have been extensively appliedfor the determination of individual components of essential oils.Raman spectroscopy has become an increasingly important tool incharacterisation of encapsulated flavours. In this study we investigatedthe suitability of Raman spectroscopy for the distribution of limonene -the main component in citrus oils - in spray-dried particles, as well asits quantification. Distribution of the flavour within micro-particles Spray drying- a method of producing a dry powder from a liquid orslurry by rapidly drying with a hot gas - is the predominant encapsula-tion process of flavours. Efficient spray drying results in homogeneousdistribution of the flavour within the carrier, which is critical to ensure anoptimal controlled release of the flavour. A 30 pm spray-dried particleconsisting of maltodextrin (carrier) and limonene (flavour) was mappedand analyzed by Raman microspectroscopy to examine the distributionof the flavour on the microscopic scale. Figure 1: Microscopic image of spray-dried sample (a), distribution of limonene (b) and maltodextrin (c) according to DCLS model, spectra of limonene (d) and maltodextrin (e). Monitoring the spectral features of limonene and maltodextrin within themapping dataset enables the construction of chemical images showingthe distribution of each compound. The chemical image of maltodextrinshows homogeneous coverage over the particle: this is logical sincemaltodextrin is the carrier. More informative is the pretty uniform distri-bution of limonene, suggesting an efficient spray-drying process. Quantitative determination of the encapsulatedlimonene Quantifying the amount of flavour in the dried powder is important tomonitor the stability of flavours in micro-particles over time. TraditionalGC-FID (Gas chromatography-flame ionization detector) methods arethe standard procedures to determine these contents, but they are time-consuming compared to Raman spectroscopy. After a simple extractionof the limonene in cyclohexane, a calibration curve based on Ramanspectra of these solutions was built for the concentration range 2.0-16.7 %, by correlating the area of alimonene peak with the concentra-tion of the standard samples. Figure. 2: Calibration curve for limonene in cyclohexane (A is the area under peakat 1678 cm 1). A seven sample test set analyzed with the GC-FID reference methodand the Raman calibration gave similar results with the two techniques(Fig.3). The limonene concentration in the spray-dried particles thatwere examined was found to be in the range 18.5-23.0 % (Wimonenew)·. poTwhe relative difference in content of limonene obtained with bothmethods was within 5.0 %. The concentrations given by the Raman in the table are outside thecalibration range as they were re-calculated to take into account thedilution factor introduced during the preparation of the samples. Themain advantage of RS method over the existing GC-FID method is itssimplicity, immediacy and speed, and that it is non-destructive. GC-FID Raman GC-FID Sample 1 22,6 23,7 Sample 2 20,9 19,9 Sample 3 21,1 21,9 Sample 4 18,5 18,9 Sample 5 19,5 18,5 Sample6 20,5 20,5 Sample 7 21,3 20.7 Average 20,6 20,6 Figure. 3: Limonene concentration determinations of a 7 sample test set using both GC-FID and Raman techniques. Summary Raman spectroscopy has provento be a powerful, rapid and reliabletechnique that can be used to quantify limonene and show its distribu-tion in spray-dried samples. Based on these findings, the application ofRaman spectroscopy for monitoring the stability of flavours in micropar-ticles can be envisaged. JOBIN YVONTechnologyHORIBAExplore the futureAutomotive Test Systems:liProcess &EnvironmentalMedicalSemiconductorScientific Raman spectroscopy has proven to be a powerful, rapid and reliable technique that can be used to quantify limonene and show its distribution in spray-dried samples. Based on these findings, the application of Raman spectroscopy for monitoring the stability of flavours in microparticles can be envisaged.
关闭-
1/2
-
2/2
产品配置单
HORIBA(中国)为您提供《密封包装的调味料中微粒的稳定性检测方案(激光拉曼光谱)》,该方案主要用于其他食品中过敏原检测,参考标准《暂无》,《密封包装的调味料中微粒的稳定性检测方案(激光拉曼光谱)》用到的仪器有null。
我要纠错
相关方案
 咨询
咨询