

方案详情文
智能文字提取功能测试中
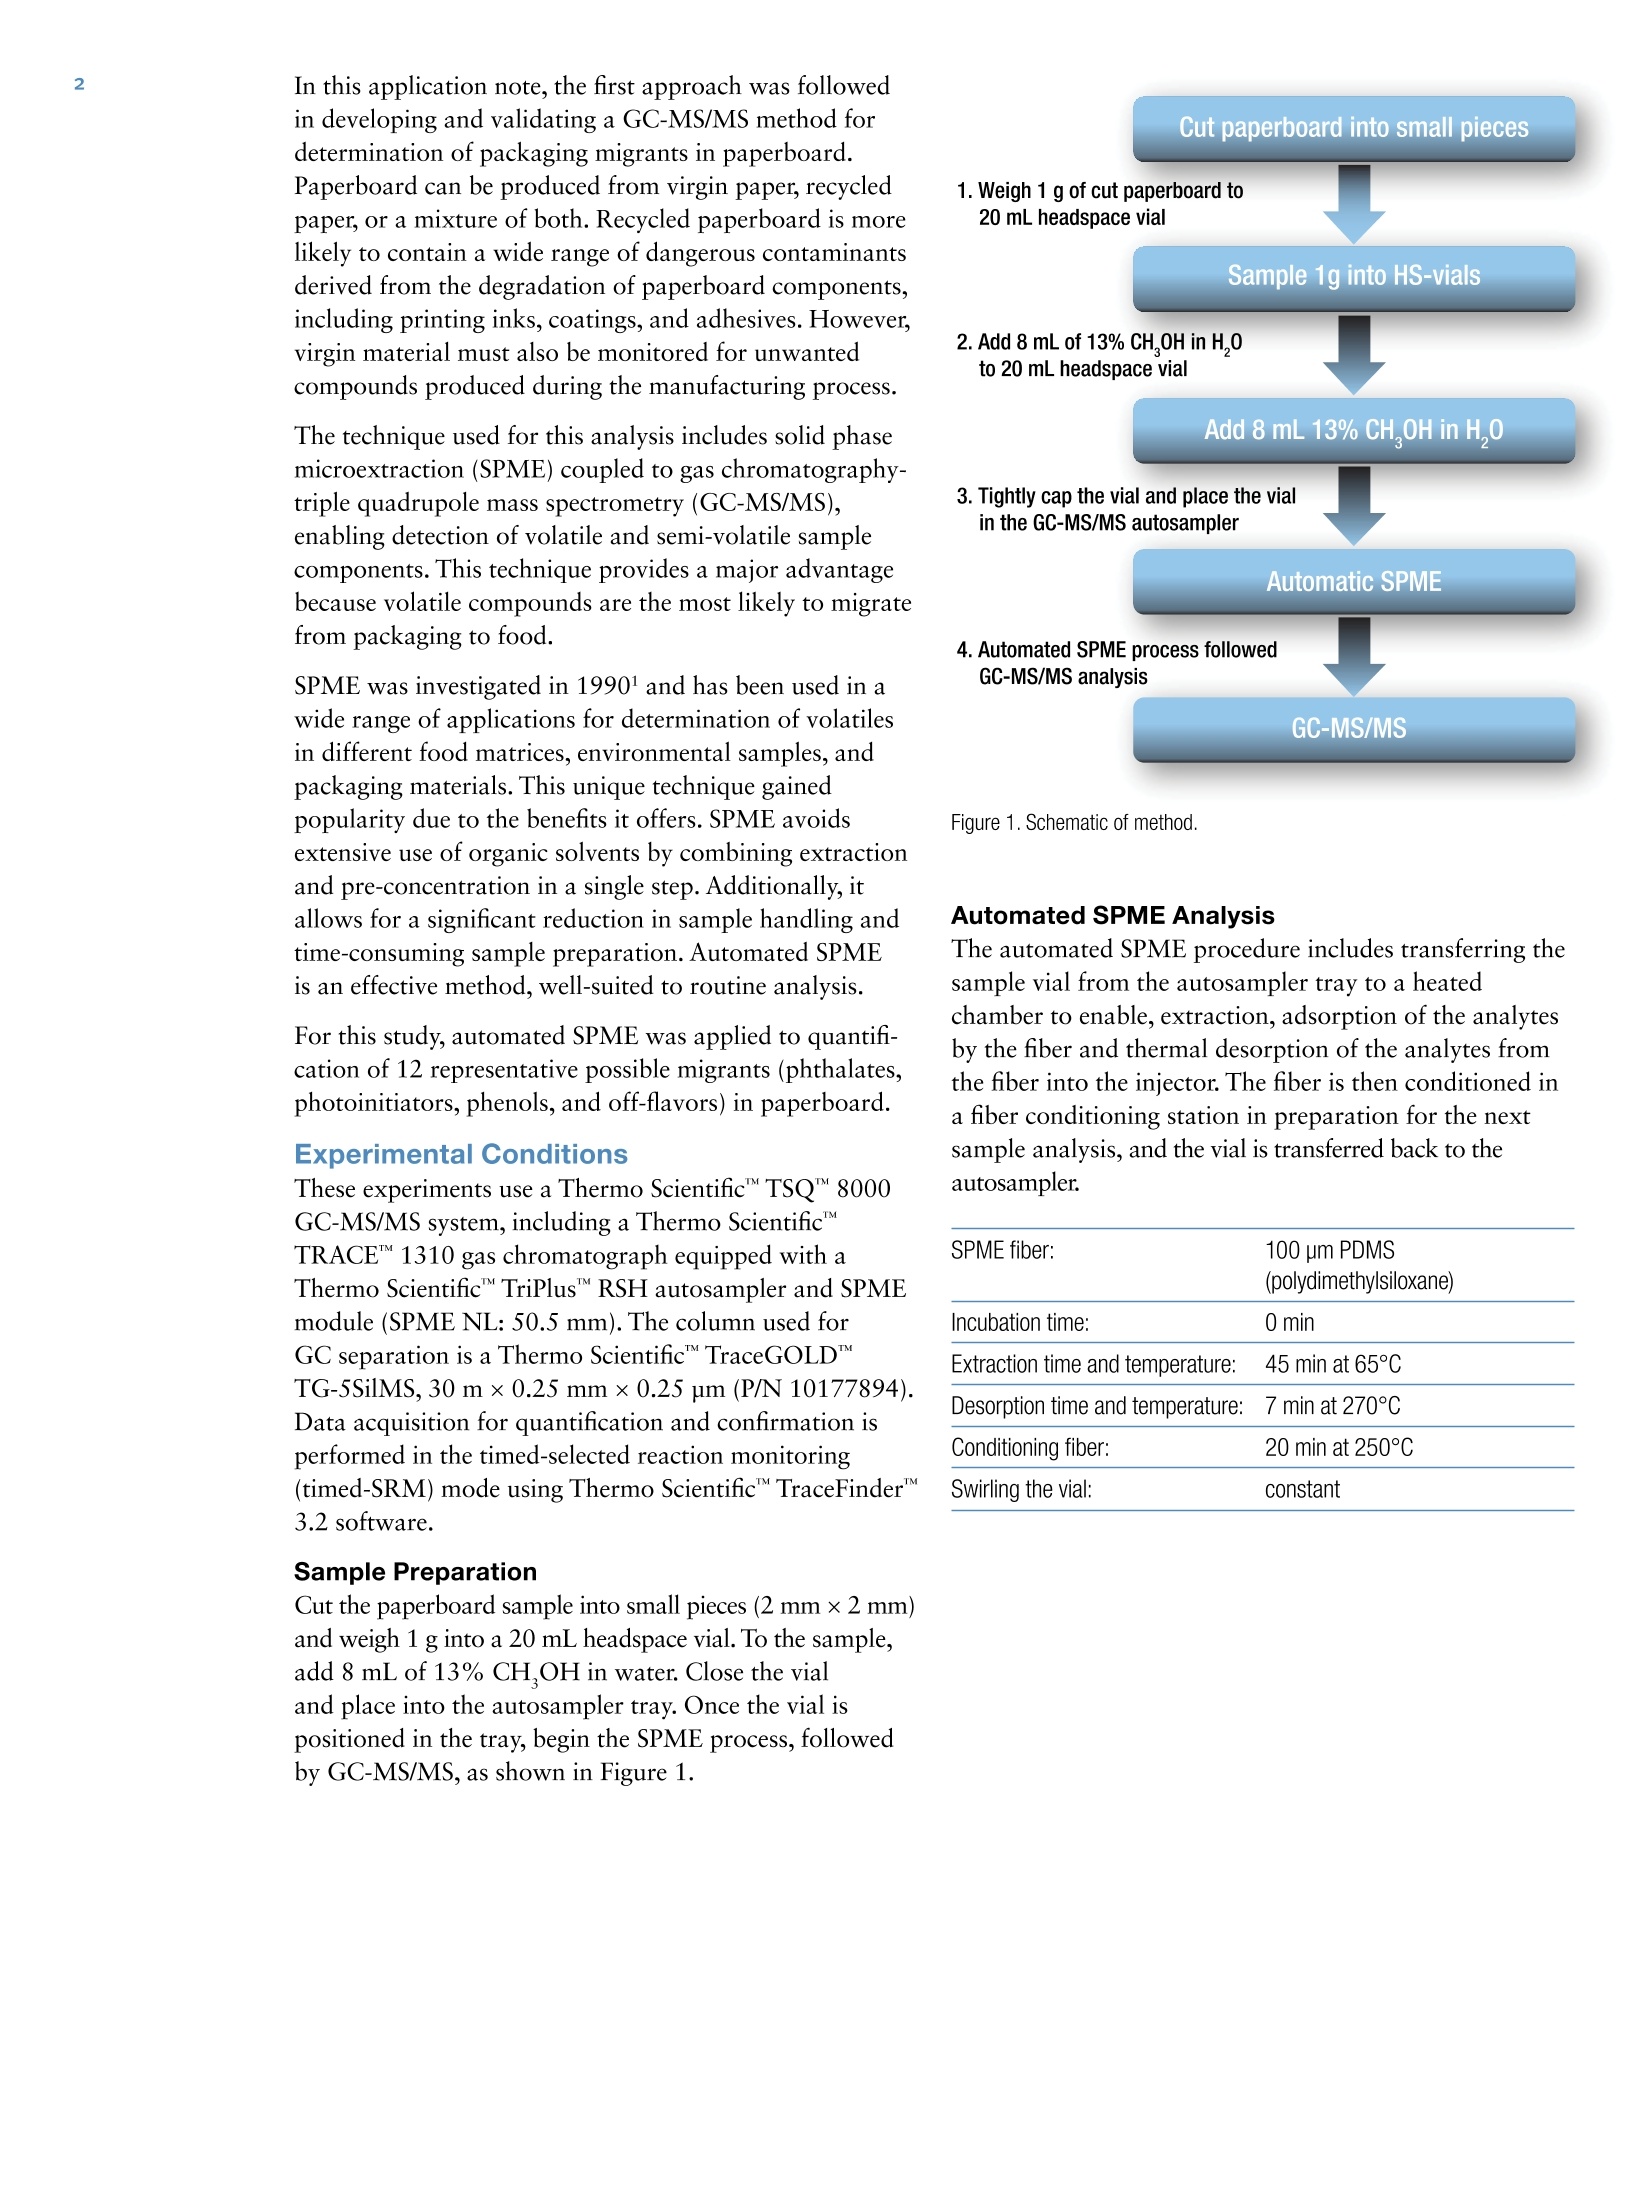
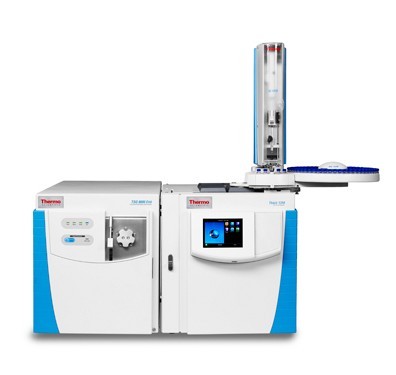
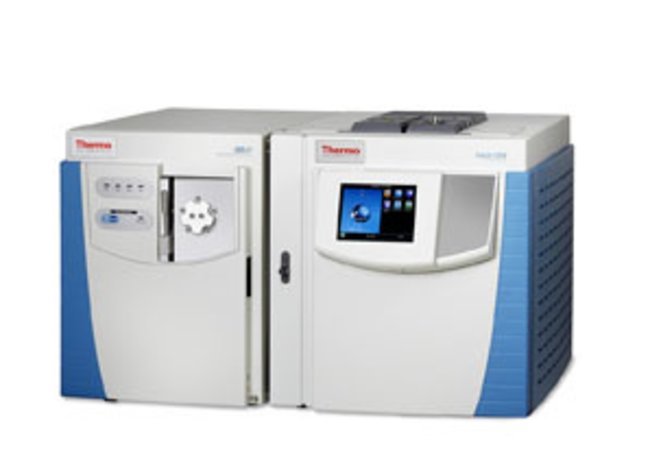
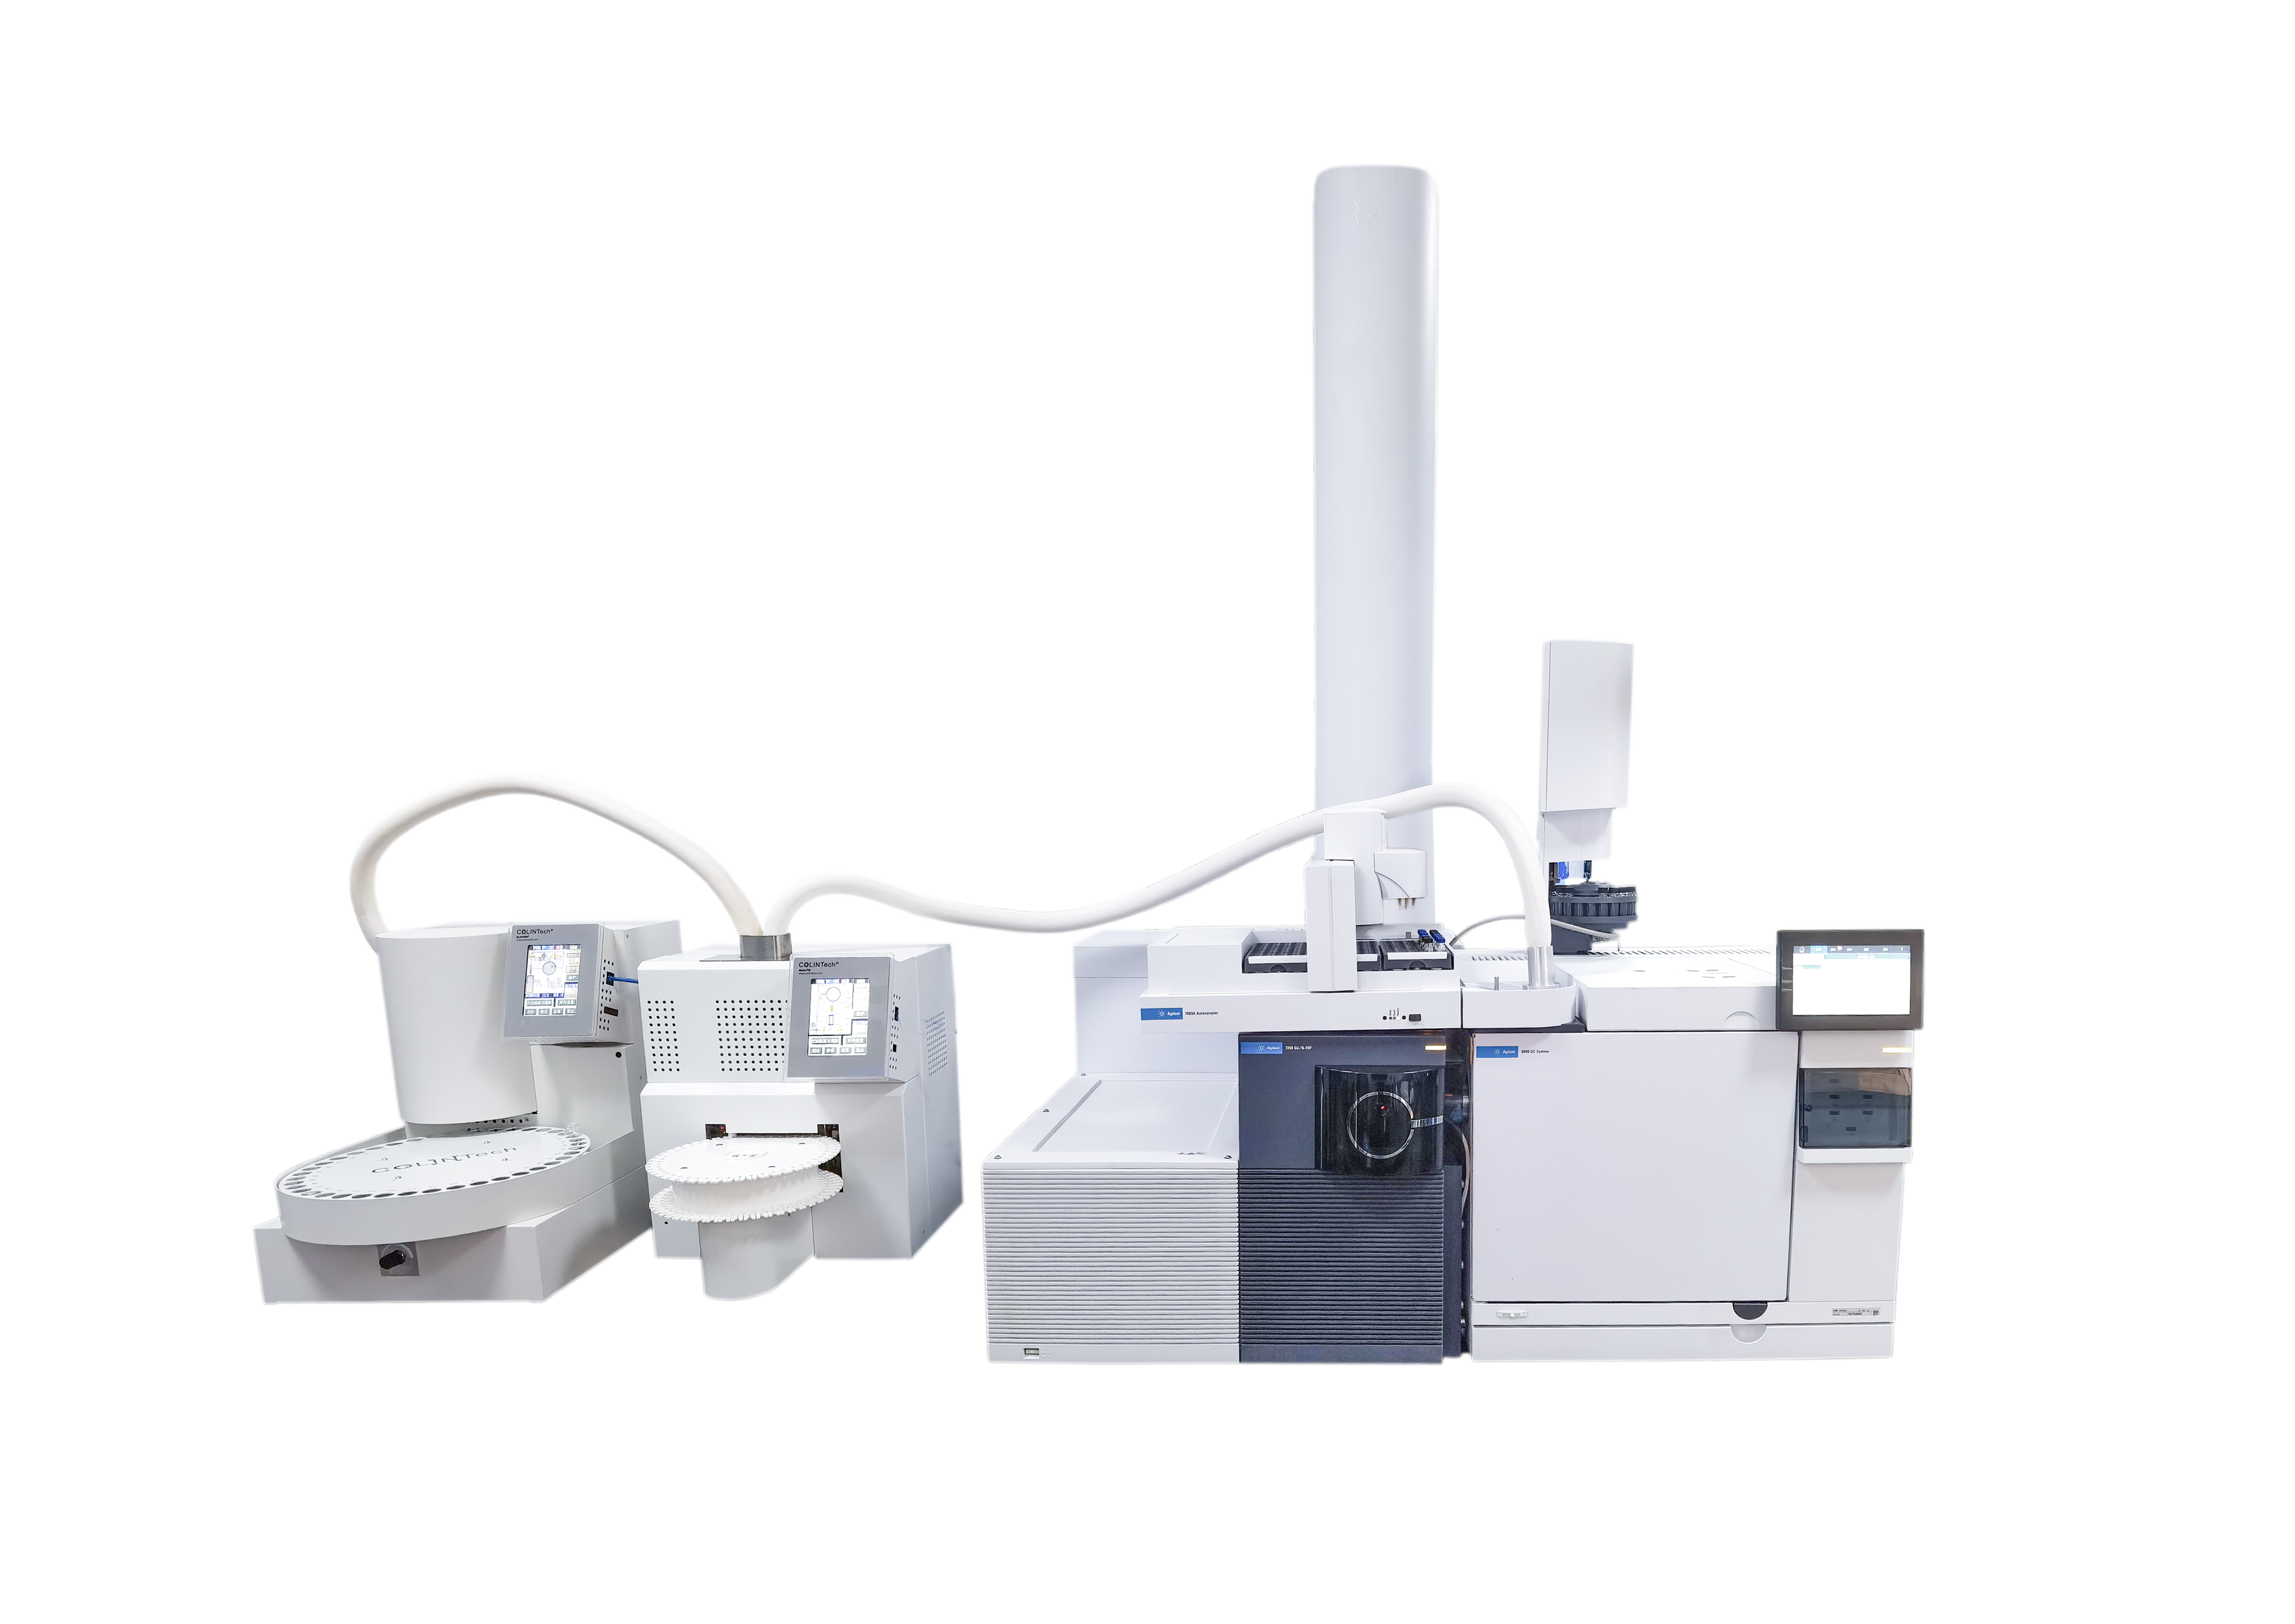
2 3 Katerina Bousova, Michal Godula,2Michele Suman31Thermo Fisher Scientific, Special Solutions Center Europe, Dreieich, Germany2Thermo Fisher Scientific, Prague, Czech Republic3Barilla Food Research Labs, Parma, Italy Keywords Food Safety, Gas Chromatography, GC-MS/MS, Leachables,Packaging, Migration Contaminants, Solid Phase Microextraction,SPME, Triple Quadrupole Goal To accurately determine presence of chemical migrants from paperboardpackaging to food products using solid phase microextraction (SPME)followed by gas chromatography-triple quadrupole mass spectrometry. Introduction Packaging of foods is a key activity of the food industry.It helps protect the food from damage while keeping itfresh and free from microbial degradation. However,the materials used in food packaging can also causedegradation of the packaged food. Inappropriatelypackaged food may develop an unpleasant odor oroff-flavor. It is important for food producers to ensurethat packaging does not contribute to off-flavors or othertoxic compounds that might be harmful to consumers. To fulfill the legislation requirements and ensure foodsafety, it is necessary to monitor both food samples andcomposition of packaging materials. Food producersrequire screening and quantitative analytical methods forthe express purpose of monitoring compounds of interestin packaging material. Packaging may consist of several different materials,including plastics, paper, metals, and glass. The use ofpackaging materials for food is regulated all over theworld. The European Union (EU) published the firstregulation concerning packaging materials in 2003 in EUFramework Regulation EC 1935/2004. A number of otherregulations followed; the most recent being RegulationEU/202/2014 in 2014, which focuses on plastic materialsand articles intended to come into contact with food. In the past 20 years, many scientific papers have beenpublished on packaging migrants, offering appropriatesolutions for their monitoring. Different sample prepara-tion procedures, analytical techniques, and detectorshave been employed. In general, there are two mainapproaches. The first is to analyze the material itself in itsfinal format, assuming that 100% of each compound willbe transferred to the food. The second approach requiresa migration study, with simulated conditions for thepackaged food product. During the study, a simulatedfood product is placed in contact with the packagingmaterial for a precisely defined period of time, underspecially defined conditions, and subsequently analyzed. Packaging legislation stipulates the maximum level ofchemicals that can be transferred from packaging materialto food, chemicals that may not be used for production offood packaging material at all, and provides limits forcompounds that can be present either in food or in thematerial itself. In this application note, the first approach was followedin developing and validating a GC-MS/MS method fordetermination of packaging migrants in paperboard.Paperboard can be produced from virgin paper,recycledpaper, or a mixture of both.Recycled paperboard is morelikely to contain a wide range of dangerous contaminantsderived from the degradation of paperboard components,including printing inks, coatings, and adhesives. However,virgin material must also be monitored for unwantedcompounds produced during the manufacturing process. The technique used for this analysis includes solid phasemicroextraction (SPME) coupled to gas chromatography-triple quadrupole mass spectrometry (GC-MS/MS),enabling detection of volatile and semi-volatile samplecomponents. This technique provides a major advantagebecause volatile compounds are the most likely to migratefrom packaging to food. SPME was investigated in 19901 and has been used in awide range of applications for determination of volatilesin different food matrices, environmental samples, andpackaging materials. This unique technique gainedpopularity due to the benefits it offers. SPME avoidsextensive use of organic solvents by combining extractionand pre-concentration in a single step. Additionally, itallows for a significant reduction in sample handling andtime-consuming sample preparation. Automated SPMEis an effective method, well-suited to routine analysis. For this study, automated SPME was applied to quantifi-cation of 12 representative possible migrants (phthalates,photoinitiators, phenols, and off-flavors) in paperboard. Experimental Conditions These experiments use a Thermo ScientificTSQ"8000GC-MS/MS system, including a Thermo ScientificTRACE 1310 gas chromatograph equipped with aThermo Scientific""TriPlusRSH autosampler and SPMEmodule (SPME NL: 50.5 mm). The column used forGC separation is a Thermo Scientific"TraceGOLDTG-5SilMS,30 mx0.25 mm x0.25 um (P/N 10177894).Data acquisition for quantification and confirmation isperformed in the timed-selected reaction monitoring(timed-SRM) mode using Thermo ScientificTraceFinderTM3.2 software. Sample Preparation Cut the paperboard sample into small pieces (2 mm×2 mm)and weigh 1 g into a 20 mL headspace vial. To the sample,add 8 mL of 13% CH,OH in water. Close the vialand place into the autosampler tray. Once the vial ispositioned in the tray, begin the SPME process, followedby GC-MS/MS, as shown in Figure 1. Figure 1. Schematic of method. Automated SPME Analysis The automated SPME procedure includes transferring thesample vial from the autosampler tray to a heatedchamber to enable, extraction, adsorption of the analytesby the fiber and thermal desorption of the analytes fromthe fiber into the injector. The fiber is then conditioned ina fiber conditioning station in preparation for the nextsample analysis, and the vial is transferred back to theautosampler. SPME fiber: 100 pm PDMS (polydimethylsiloxane) Incubation time: 0 min Extraction time and temperature: 45 min at 65°C Desorption time and temperature: 7 min at 270℃ Conditioning fiber: 20 min at 250C Swirling the vial: constant Calibration Standards The calibration standards, listed below, were purchasedfrom Sigma-Aldrich. ·1-Hexanol ·1-Methoxy-2-propanol ·2,4-Di-tert-butylphenol ·2-Ethyl-1-hexanol · Allyl benzoate ·Benzaldehyde · Benzophenone · Di(propylene glycol) methyl ether ·Dimethyl phthalate (DMP) ·Ethyl benzoate ·Hexanal ·2,4,6-Trichloroanisole Spiking Standard Solution Spiking standard solution was prepared by dilutingindividual stock solutions of seven analytes (1-hexanol,1-methoxy-2-propanol,2-ethyl-1-hexanol,benzaldehyde,di(propylene glycol) methyl ether,DMP and hexanal) andworking standard solution in water. The analytes weredivided into four groups with different concentrations(Table 1). The spiking standard solution was preparedfresh before each use. RECOMMENDED CONDITIONS TRACE 1310 GC Liner: SPME Liner 0.75 mm x6.35 mm x78.5 mm Restek P/N 21111-214.5 Carrier Gas: He 1.2 mL/min Column lype: Thermo ScientificTraceGOLD TG-5SilMS,30 mx0.25 mm× Column Oven: 0.25 pm (P/N 10177894) 40 °C, hold for 1 min. Ramp at 10 °C/min to 160°C. Ramp at 12 °C/min to 200°C. Ramp at 17 °C/min to 300 C. Hold for 5 min Instant Connect SSL Injector nlet Temperature: 270 °C Mode: S/SL splitless, 5 min; split flow 50 mL/min Run Time: 27.5 min TSQ 8000 MS Transfer Line (C): 250 onization Type: E Ion Source (C): 250 Electron Energy (eV): 70 Acquisition Mode: timed-SRM (Table 2) Resolution: Q1 normal (0.7 Da) Collision Gas: Argon Minimum Baseline Peak Width (s):3 Desired Scans per Peak: 15 Compounds Group Concentration of StockStandard /WorkingStandard (ug/mL) V(mL) to 10 mL Flaskfrom Stock Standard/Working Standard Concentration of SpikingStandard Solution(ug/mL) 1-Hexanol 3 1000 0.1 10 1-Methoxy-2-propanol 2 1000 0.01 1 2,4-Di-tert-butylphenol* 1 10 0.1 0.1 2-Ethyl-1-hexanol 2 1000 0.01 1 Allyl benzoate* 1 10 0.1 0.1 Benzaldehyde 2 1000 0.01 1 Benzophenone* 1 10 0.1 0.1 Di(propylene glycol) methyl ether 4 1000 1 100 DMP 2 1000 0.01 1 Ethyl benzoate* 1 10 0.1 0.1 Hexanal 4 1000 1 100 2,4,6-Trichloroanisole* 1 10 0.1 0.1 Name RT (min) Quantifier Ion Qualifier lon PrecursorMass(m/z) ProductMass(m/z) CollisionEnergy (eV) Precursor mass(m/z) ProductMass (m/z) CollisionEnergy (eV) 1-Hexanol 4.68 56.1 41.0 10 69.1 41.1 10 1-Methoxy-2-propanol 7.22 69.9 55.1 10 56.9 41.0 5 2,4-Di-tert-butylphenol 14.01 206.3 191.2 10 191.1 57.1 13 2-Ethyl-1-hexanol 7.23 56.9 41.1 5 82.9 41.1 15 Allyl benzoate 10.74 105.0 77.1 12 105.0 50.9 27 Benzaldehyde 6.19 106.1 105.0 10 106.1 77.0 20 Benzophenone 15.47 105.1 77.1 10 181.9 105.1 10 Di(propylene glycol) methyl ether 6.99 104.2 58.9 10 59.0 43.0 20 DMP 13.31 163.0 77.1 20 163.0 133.1 10 Ethyl benzoate 9.47 105.0 77.0 10 105.0 50.9 25 Hexanal 3.65 56.5 40.9 5 56.5 31.1 20 2,4,6-Trichloroanisole 11.74 194.9 166.9 13 209.7 194.9 10 Identification Identification of the packaging migrants was based uponthe presence of transition ions (quantifier and qualifier)at the retention times (+/- 2.5%) corresponding to knownstandards. In timed-SRM mode, the measured peakarea ratios for qualifier to quantifier ion should be inclose agreement (according Commission Decision2002/657/EC2) with those of the standards, as shown inTable 2. The quantifier and qualifier ions were selected,based on intensity, from among the product ions producedby the fragmentation of the selected parent ion. Quantification Matched calibration was used for the quantificationmatrix. A calibration curve was plotted as the peak area isa linear function of the concentration of the analyte. Theanalyte concentration in the sample was determined usingthe equation: ca= analyte concentration in pg/kgAa= peak area of the analyteb = y-intercepta =slope of the calibration curve Method Performance The method was validated in-house using thecriteria specified in European Commission Decision2002/675/EC as a guideline, as no guidelines specific topackaging migrants currently exist. Validation parameterswere determined by spiking virgin paperboard at threedifferent levels.The measured parameters were specificity,linear range, repeatability, accuracy, limit of detection(LOD), and limit of quantification (LOQ). Specificity Using SRM, specificity was confirmed based on thepresence of the transition ions (quantifier and qualifier)at the correct retention times, corresponding to those ofthe respective analytes. The measured peak area ratiosof qualifier/quantifier are in the range defined in theCommission Decision 2002/657/ECcompared to thestandards (Table 3). Linearity and calibration curve Calibration curves were created from eight matrix-matched calibration standards, which were prepared andinjected in duplicate for each batch. Correlation coef-ficients and linear ranges are shown in the Table 3. Table 3. Ion ratios (Qual/Quan) in matrix and in standard mixture (the agreement between ion ratios should be in the permitted tolerance, which is defined inthe Commission Decision 2002/657/EC). Compound R2 Linear range (ug/kg) Ion ratio-matrix (%) Ion ratio-solvent (%) 1-Hexanol 0.9928 0-6000 54.21 57.26 1-Methoxy-2-propanol 0.9925 0-600 93.77 95.61 2,4-Di-tert-butylphenol 0.9915 0-60 99.9 106.4 2-Ethyl-1-hexanol 0.9947 0-600 17.44 14.16 Allyl benzoate 0.9918 0-60 31.84 32.97 Benzaldehyde 0.9937 0-600 62.3 60.8 Benzophenone 0.9931 0-60 19.7 38.2 Di(propylene glycol) methyl ether 0.9940 0-60000 33.47 27.2 DMP 0.9930 0-600 42 42.8 Ethyl benzoate 0.9920 0-60 30.64 30.8 Hexanal 0.9909 0-60000 75.6 77.2 2,4,6-Trichloroanisole 0.9902 0-60 47.37 47.5 Table 4. Results of method precision (expressed as relative standard deviation - RSD) and accuracy (expressed as recovery) at three different spike levels(six replicates). Compound Spiking Levels (ug/kg) RSD (%) Recovery (%) 1 1-Hexanol 750 2000 4000 8 14 2 76 94 100 1-Methoxy-2-propanol 75 200 400 17 5 1 107 115 107 2,4-Di-tert-butylphenol 7.5 20 40 11 13 13 87 86 83 2-Ethyl-1-hexanol 75 200 400 17 4 1 106 114 106 Allyl benzoate 7.5 20 40 14 14 5 87 98 95 Benzaldehyde 75 200 400 14 5 1 97 112 108 Benzophenone 7.5 20 40 8 6 2 91 101 96 Di(propylene glycol) methyl ether 7500 20000 40000 22 10 22 76 71 76 DMP 75 200 400 9 8 3 96 104 103 Ethyl benzoate 7.5 20 40 14 10 3 88 99 97 Hexanal 7500 20000 40000 21 10 6 98 119 117 2,4,6-Trichloroanisole 7.5 20 40 17 22 21 103 91 86 Table 5. Limits of detection and quantification of the method (LOD and LOQ) and methodintermediate precision expressed as RSD (%)-at one levelthree sets measured with sixreplicates in three days. Compound LOD(ug/kg) LOQ(ug/kg) Intermediateprecision atLevel ll (%) Day 1 Day2 Day 3 1-Hexanol 100 300 8 16 12 1-Methoxy-2-propanol 20 60 17 12 1 2,4-Di-tert-butylphenol 0.3 1 11 5 16 2-Ethyl-1-hexanol 20 50 17 10 1 Allyl benzoate 0.3 1 14 8 6 Benzaldehyde 2 5 14 9 3 Benzophenone 16 50 8 7 3 Di(propylene glycol) methyl ether 2500 7500 22 14 15 DMP 8 20 9 7 9 Ethyl benzoate 1.5 5 14 9 3 Hexanal 35 100 21 14 8 2,4,6-Trichloroanisole 0.03 0.1 17 7 21 Precision Precision (repeatability) of the method was determinedusing independently spiked virgin paperboard samples atthree different levels. A set of three concentrations withsix repetitions each was analyzed in the same day. Forthe determination of the intermediate precision, two othersets at a single concentration, with six repetitions weremeasured over the next two days. The results are shownin Tables 4 and 5. Repeatability was within normaldeviations except for the less volatile compounds, such as2,4,6-Trichloroanisole. Accuracy Method accuracy was determined using independentlyspiked virgin paperboard samples at three different levels.Accuracy was evaluated by comparing found values withstandard addition in spikes. Recovery values are shown inTable 4. Limits of detection (LOD) and quantification (LOQ) Limits of detection and quantification are estimatedfollowing the IUPAC approach,which consists ofanalyzing the blank sample to establish noise levels andthen estimating LODs and LOQs for signal/noise at 3 and10, respectively. The values are shown in the Table 5. Figure 2. Chromatogram of spiked paperboard with 12 packaging migrants (C=0.024-30 mg/kg) Conclusion The reported in-house validated method enables determi-nation and quantification of 12 possible migrants frompaperboard packaging. This fully automated SPMEmethod can increase laboratory throughput. The resultsobtained from in-house validation, according to theIUPAC/AOAC harmonized protocol, confirmed thatthis method is suitable for monitoring the content ofunwanted contaminants in paperboard intended for withcontact with food. · The method is fully automated due to the use ofautomated SPME Due to the automation, the method is very fast, robust,and saves manpower ·Use of the TSQ 8000 mass spectrometer offers theadvantages of high sensitivity and easy routinemaintenance 1. Arthur C.L.; PawliszynJ. Solid phase microextractionwith thermal desorption using fused silica optical fibers.Anal Chem. 1990, 62:2145-2148. 2. Commission Decision 2002/657/EC. Off. J. Eur.Commun.2002,L221/8. SCIENTIFIC A Thermo Fisher Scientific BrandANEN SPME-GC-MS/MS 用于纸板食品包装中迁移污染物的鉴定和定量分析。使用固相微萃取 (SPME) 及气相色谱 - 三重四极杆质谱分析,能够准确鉴定食品产品中来自纸板包装的化学迁移物的存在。
关闭-
1/7
-
2/7
还剩5页未读,是否继续阅读?
继续免费阅读全文产品配置单
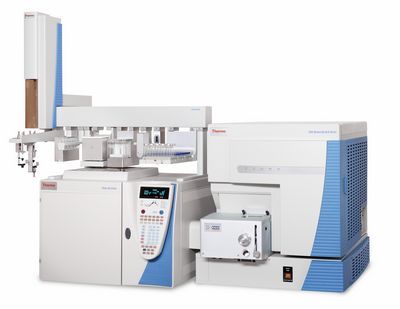
赛默飞色谱与质谱为您提供《纸板食品包装中迁移污染物检测方案(气质联用仪)》,该方案主要用于包装中迁移污染物检测,参考标准《暂无》,《纸板食品包装中迁移污染物检测方案(气质联用仪)》用到的仪器有赛默飞TSQ 8000 Evo 三重四极杆气质联用仪、赛默飞TRACE 1310 气相色谱仪、赛默飞TriPlus RSH 气相/气质自动进样器。
我要纠错
推荐专场
气相色谱仪(GC)
更多
相关方案
 咨询
咨询