

方案详情文
智能文字提取功能测试中
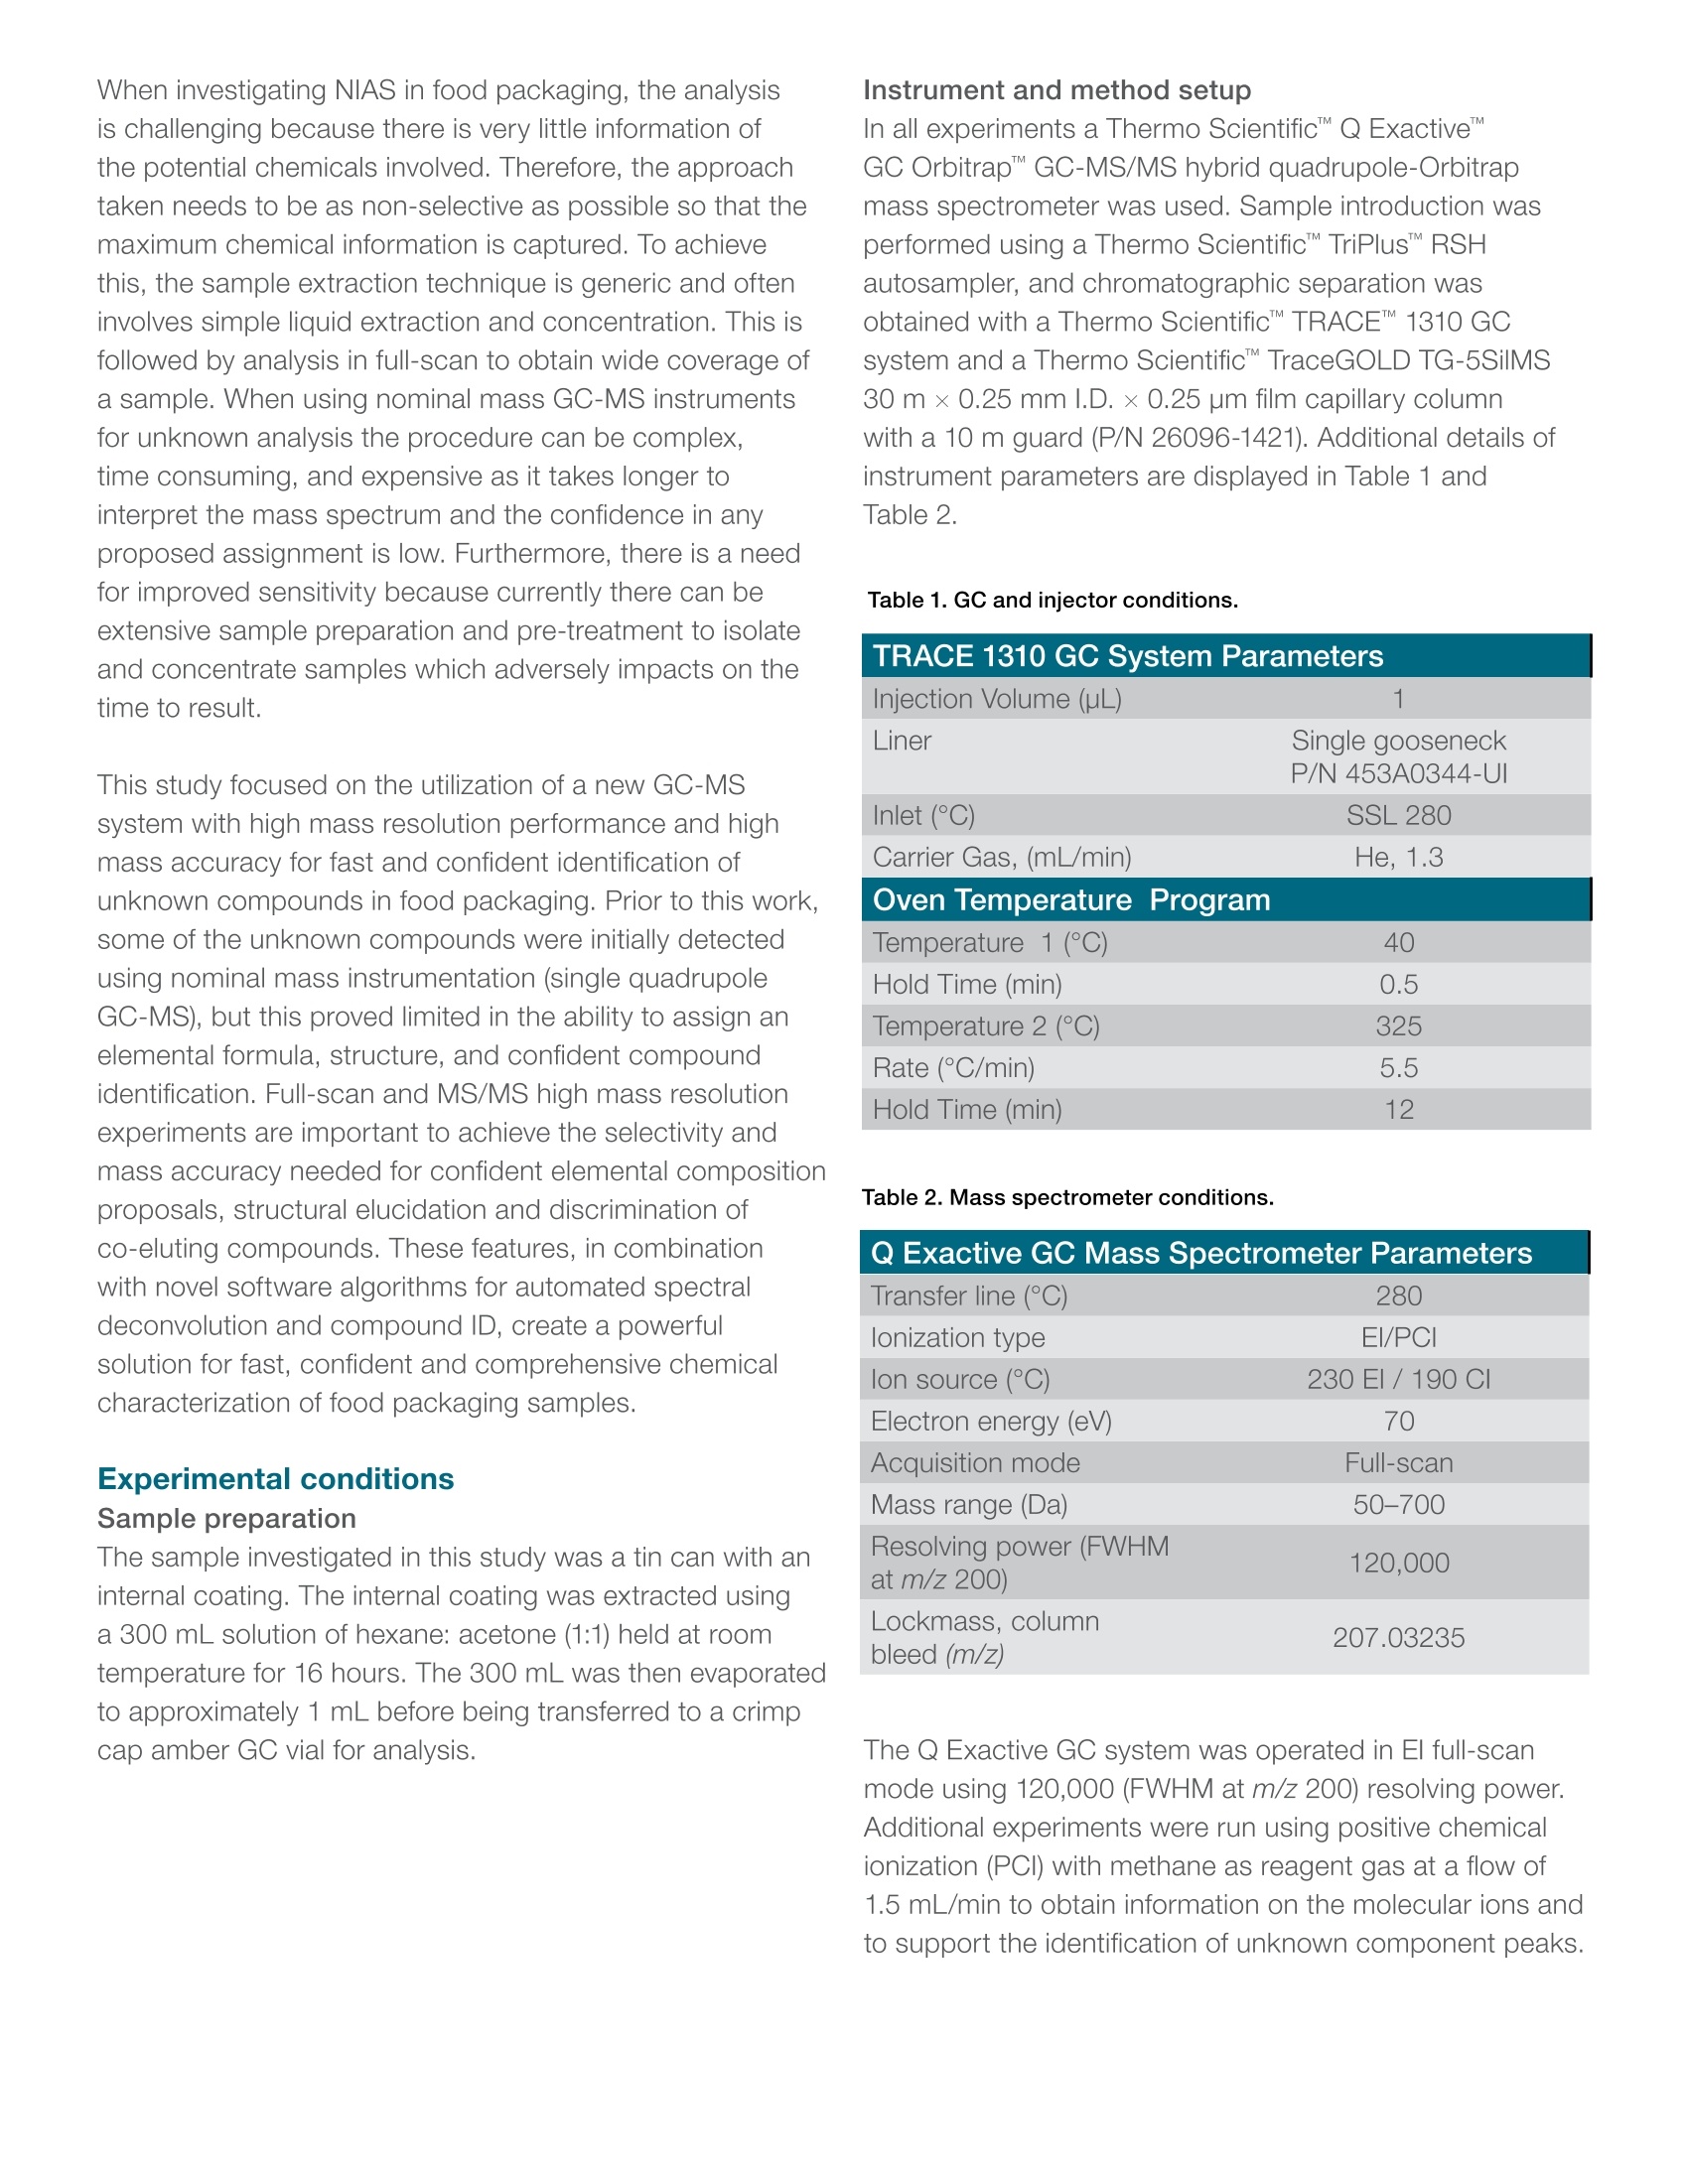
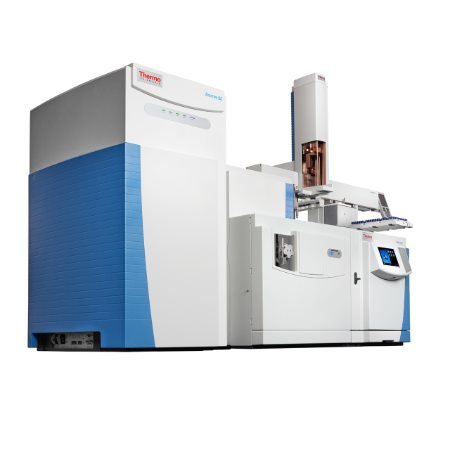
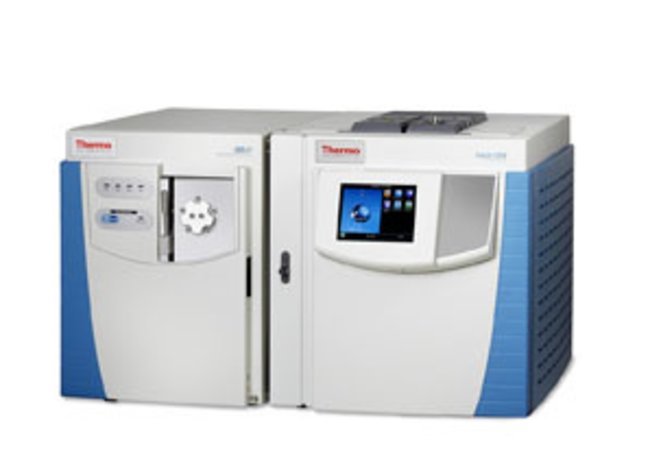
thermoscientificZo105 Characterizing unknowns infood packaging using GCOrbitrap Mass Spectrometry Authors: Dominic Roberts1, Jesus Varela,Yves-Alexis Hammel? and Paul Silcock1iThermo Fisher Scientific, Runcorn, UK2Nestle, Lausanne, Switzerland Key Words Food packaging,Q Exactive GC, Orbitrap massspectrometry, unknown identification, structural elucidation,food safety Introduction Packaging is an essential element of a safe food supplychain, with its main purpose to preserve the food it coversand to maintain its quality over the course of the productsshelf life. Without an adequate barrier, food producersand manufacturers risk potentially serious microbial andchemical food safety incidents that may result in serioushealth risks over the short or long term. However, it is alsowell known that the chemical components used in thepackaging can migrate into the food and present an evengreater threat. Food and beverages can interact stronglywith any surface that they come into contact with andcan potentially impact the quality of the product.2Theycan be corrosive or cause other physical breakdown ofthe packaging that will, in turn, leach chemicals into theproduct. Unfortunately, no packaging material is entirelyinert; glass, paper, plastics and ceramics can all leachchemicals into the food at significant concentrations.For these reasons, it is important that regulators and manufacturers monitor and understand the health riskassociated with packaging and take steps to minimize therisk to the consumer. Gas Chromatography-Mass Spectrometry (GC-MS)is a popular analytical technique and has been widelyused in food packaging studies as it provides analyticaladvantages of chromatographic resolution, reproducibility,peak capacity and, importantly, extensive spectral librariesto aid in identification. The analytes of interest are eithervolatile or semi-volatile (<1000 Da) in nature, and aretherefore well-suited to analysis by GC-MS. The primarymaterials, such as monomers, additives and solventsused in the food packaging are usually well understood.However, these materials can also contain non-intentionallyadded substances (NIAS) such as impurities, reactionintermediates, breakdown products of polymer/additives,and contaminants from recycling. When investigating NIAS in food packaging, the analysisis challenging because there is very little information ofthe potential chemicals involved. Therefore, the approachtaken needs to be as non-selective as possible so that themaximum chemical information is captured. To achievethis, the sample extraction technique is generic and ofteninvolves simple liquid extraction and concentration. This isfollowed by analysis in full-scan to obtain wide coverage ofa sample. When using nominal mass GC-MS instrumentsfor unknown analysis the procedure can be complex,time consuming, and expensive as it takes longer tointerpret the mass spectrum and the confidence in anyproposed assignment is low. Furthermore, there is a needfor improved sensitivity because currently there can beextensive sample preparation and pre-treatment to isolateand concentrate samples which adversely impacts on thetime to result. This study focused on the utilization of a new GC-MSsystem with high mass resolution performance and highmass accuracy for fast and confident identification ofunknown compounds in food packaging. Prior to this work,some of the unknown compounds were initially detectedusing nominal mass instrumentation (single quadrupoleGC-MS), but this proved limited in the ability to assign anelemental formula, structure, and confident compoundidentification. Full-scan and MS/MS high mass resolutionexperiments are important to achieve the selectivity andmass accuracy needed for confident elemental compositionproposals, structural elucidation and discrimination ofco-eluting compounds. These features, in combinationwith novel software algorithms for automated spectraldeconvolution and compound ID, create a powerfulsolution for fast, confident and comprehensive chemicalcharacterization of food packaging samples. Experimental conditions Sample preparation The sample investigated in this study was a tin can with aninternal coating. The internal coating was extracted usinga 300 mL solution of hexane: acetone (1:1) held at roomtemperature for 16 hours. The 300 mL was then evaporatedto approximately 1 mL before being transferred to a crimpcap amber GC vial for analysis. Instrument and method setup In all experiments a Thermo ScientificQExactiveGC OrbitrapGC-MS/MS hybrid quadrupole-Orbitrapmass spectrometer was used. Sample introduction wasperformed using a Thermo ScientificTriPlus RSHautosampler, and chromatographic separation wasobtained with a Thermo ScientificM TRACEM 1310 GCsystem and a Thermo ScientificTraceGOLD TG-5SilMS30mx0.25 mm l.D. ×0.25 pm film capillary columnwith a 10 m guard (P/N 26096-1421). Additional details ofinstrument parameters are displayed in Table 1 andTable 2. Table 1. GC and injector conditions. TRACE 1310 GC System Parameters Injection Volume (pL) 1 Liner Single gooseneck P/N 453A0344-UI Inlet (C) SSL 280 Carrier Gas, (mL/min) He, 1.3 Oven Temperature Program Temperature 1(C) 40 Hold Time (min) 0.5 Temperature 2 (°C) 325 Rate (C/min) 5.5 Hold Time (min) 12 Table 2. Mass spectrometer conditions. Q Exactive GC Mass Spectrometer Parameters Transfer line (°C) 280 lonization type EI/PCI lon source (°C) 230EI/190 CI Electron energy (eV) 70 Acquisition mode Full-scan Mass range (Da) 50-700 Resolving power (FWHM at m/z 200) 120,000 Lockmass, column bleed (m/Z) 207.03235 The Q Exactive GC system was operated in El full-scanmode using 120,000 (FWHM at m/z 200) resolving power.Additional experiments were run using positive chemicalionization (PCI) with methane as reagent gas at a flow of1.5 mL/min to obtain information on the molecular ions andto support the identification of unknown component peaks. Data processing Data were acquired using the Thermo Scientific"TraceFindersoftware. This single platform softwarepackage integrates instrument control, methoddevelopment functionality, and qualitative and quantitation-focused workflows. TraceFinder also contains accuratemass spectral deconvolution and spectral matchingfunctionality. Thermo ScientificMassFrontierspectralinterpretation software was used for structural elucidation. Results and discussion The objective of this study was to analyze the packagingsample using a non-target full-scan data acquisition usingelectron ionization (El) and positive chemical ionization(PCI), and to identify the most intense peaks. In addition,the aim was to provide structural information for the peaksdetected using nominal mass GC-MS, where confirmationof the identity was not possible. Extracting key features Full-scan chromatograms were obtained for the sampleand the total ion chromatograms (TICs) are shown inFigure 1. The Q Exactive GC system acquires accuratemass data with a wide dynamic range. This is verypowerful when the objective is to identify unknown peaks ina complex sample, such as a food packaging extract witha high degree of confidence. The first step in this analysiswas to isolate the peaks of interest and although peaks canbe seen visually in the TICs, it is essential that all featuresare extracted from the data. This was achieved with TraceFinder which first performs ahigh resolution accurate mass deconvolution of the datawith the aim of detecting all of the peaks above a signalto noise threshold of 100:1. The deconvolution ensuresthat only ions that maximize at the same retention timeremain for library matching. Using these thresholds, 961features (peak clusters) were detected in the packagingsample. An example peak for 2-Hydroxy-5-methyl-1,3-benzenedicarboxaldehyde is shown in Figure 2, along withthe number of scans across the peak, the accurate massand ppm difference. Figure 1. GC-MS electron ionization (El) and positive chemical ionization (PCI) total ion chromatograms (TIC) of the packaging sample. Figure 2. Extracted ion chromatogram for compound 2-Hydroxy-5-methyl-1,3-benzenedicarboxaldehyde fragment (m/z 136.05188±5 ppmmass window) in packaging sample 34 scans/peak.Data acquired in full-scan at 120,000 FWHM resolving power. Excellent accurate mass stability isshown for each individual scan as well as mass difference labelled (in ppm). Accelerate known compound identificationHaving performed a peak extraction,the deconvolutedspectrum was first searched against a commerciallyavailable nominal mass spectral library (NIST 2014). Ifavailable, the data could also be searched against an in-house nominal or accurate mass spectral library. The listsof hits were scored based on a combination of the searchindex (Sl) score and high resolution filtering (HRF) value.The HRF value is the percentage of the mass spectrumthat can be explained by the chemical formula in the librarysearch.3 The combination of accurate mass and percentage ofexplained ions observed in the spectrum provides a fastand confident route to the identification of compounds.The utilization of accurate mass information speeds upthe identification process as the user is no longer facedwith long lists of spectral library matched compounds thatare difficult to confirm or eliminate. For example, the tophit for the peak at 15.98 minutes was for the compound2-Hydroxy-5-methyl-1,3-benzenedicarboxaldehyde,where 99.2% of the spectrum can be explained basedon accurate mass (Figure 3). The fragments observed arematched to the elements in the proposed compound withsub 1 ppm mass accuracy which adds confidence in theidentification. If only spectral matching was used, it wouldbe difficult to confirm the identification. Figure 3. Identification of peak at 15.98 minutes as 2-hydroxy-5-methyl-1,3-benzenedicarboxaldehyde. Screenshot of thedeconvoluted data and library match in TraceFinder. (A) List of library hits sorted by score (combination of SI and HRF). (B) List offragment ions from El spectrum and elemental composition based on elements in top hit. Encountering unknowns In a previous study, the same food packaging samplewas analyzed using nominal mass GC-MS and a group ofpeaks were identified as being of interest, and they are alsointense peaks in the high resolution MS TIC. These peakseluted at RT: 30.6, 42.9,45.5,47.8, 49.1, and 53.2 minutesand are highlighted in Figure 4. As they are among themost intense peaks in the TIC, it is essential from a food safety view point to determine what they are as a first stepto deciding whether they present any health risk. lmportantly, none of these peaks had a match in NIST2014. With no spectral match it becomes extremely difficultusing nominal mass to derive an acceptable degree ofconfident chemical compositional information about thesecompounds. Figure 4. Zoomed region showing the six peaks of interest in the electron impact (El) total ionchromatogram of the packaging sample. When the spectral library match from the El spectrumis inconclusive, then the PCl data can be used toestablish the molecular ion, and to propose an elementalcomposition. When Cl data is acquired using methaneas the reagent gas, three adducts are typically observed:[M+H]+, [M+C,H,]+ and [M+C,H]t. Figure 5 shows the Eland PCI spectra for the peak at 45.5 minutes. The PCIspectrum shows the adducts [M+H]+(-0.8 ppm) for ionm/z 469.18532, [M+C,H,Jt(-0.5 ppm) for ion m/z 497.21677.The presence of these adducts indicated that the m/z468.17783 was the molecular ion. Without the PCladductsit would not be possible to determine if the m/z 468.17783was a fragment or the molecular ion. From this ion, anelemental composition of the parent molecule can beproposed. Elemental composition assignment is a critical stage in thecompound identification process and it is where excellentmass accuracy and isotopic pattern can be used to limitthe number of possible chemical formulae. An elementalcomposition calculator was used to propose a formula forthe [M+H+ ion (Figure 6). The software assigns formulaeby using an isotopic pattern matching algorithm thataccounts for isotope accurate mass and intensity ratios.The algorithm uses a single mass to calculate all possible elemental compositions that lie within a tolerance windowand then calculates the theoretical isotopic pattern foreach suggestion. It then gives a score between 0 and100 percent, where 0 is completely different and 100an exact isotopic match. For example, when a 5 ppmmass accuracy window is used 12 possible formulae areproposed for the [M+H]+ ion using the elements Carbon(1-30), Hydrogen (1-60), Nitrogen (1-5), Oxygen (1-10),Phosphorus (1) and Sulphur (1).This is compared to 1ppm mass accuracy window that suggests three possibleformulae. Only one of these suggestions has a 100 percentmatch with the theoretical isotopic pattern: CH. Thislevel of mass accuracy significantly reduces the numberof formulae that need to be investigated, which speedsup the analysis, and also increases the confidence in anyproposed assignment. One final stage to support the proposed formula and toderive structural information is to use the accurate massfragments. To achieve this, either the fragments in the Elspectrum can be used or an additional MS/MS experimentcan be performed to be confident that the fragments areindeed from the molecular ion. The [M+H]+ (PCI)m/z 469.18 was isolated in the quadrupole andfragmentation induced in the HCD cell using 15V energy. Figure 5. El and PCI spectra at 45.5 minutes in packaging sample proposing a chemical formula of C H.Peaks are annotated with chemicalformula and mass difference in ppm. PCl data supports identification of parent ion with formula with sub 1 ppm mass accuracy. Figure 7 shows the resulting MS/MS spectrum form/z 469.18. The fragments measured contain the elementsin the proposed parent and all with good mass accuracy.Based on this information, a proposed structure of thecompound was made and is shown inset in Figure 7.MassFrontier was used to theoretically fragment theproposed chemical structure and match these to themeasured fragments in the MS/MS spectrum. Therefore,even if at this stage a compound name cannot beconfidently assigned, enough information can be obtainedwith respect to the chemical formula of the unknowncompound. Each of the six peaks were evaluated using the sameworkflow, and the results are summarized in Table 3. Themass accuracy obtained (<1 ppm) enabled confidentelemental compositions to be assigned and these aresupported by accurate mass fragments in the El spectra. Itwas noted that all of the peaks contained a m/z 149.02332ion and shared a common structure. Figure 6.Elemental composition calculator screen in FreeStyle for the peak at 45.5 minutes in packaging sample proposing a chemical formulaofCHg0 for the [M+H]t ion based on accurate mass and isotope pattern. The three candidates are all within 1 ppm, but the top hit has a 100%isotopic match with the theoretical pattern. Packaging_MSMS_001#7300 RT: 23 47 AV: 1 NL: 2.80E5 Figure 7.MS/MS spectrum of PCI ion m/z 469.18 selected in the quadrupole and fragmented in the HCD cell. MassFrontier used to explain thefragments observed within 3 ppm mass accuracy window. Peak No. RetentionTime(min) Formula [M+H]+ m/z Mass Error of[M+H]+(ppm) Mass Error of[M+C,H,]+(ppm) Mass Error of[M+CH,]t(ppm) 1 30.6 C4186 283.11762 0.0 0.5 0.1 2 42.98 022209: 413.12303 -0.2 -0.3 0.0 3 45.5 C2628: 469.18532 0.7 -0.4 0.0 4 47.5 C24H2408 441.15424 -0.4 -0.4 -0.3 5 49.1 C27309: 483.20112 -0.5 -0.1 0.3 6 52.0 C28329: 497.21684 -0.3 0.1 0.3 Unlocking structural information Further investigation of the full-scan El and PCI datashowed that when the parent mass for C2H289 wasextracted there were three peaks in the chromatogram(Figure 8). The capability to perform accurate massMS/MS experiments provides valuable structuralinformation that may be vital in determining whatthe compound is and if it is a safety concern. TheMS/MS spectra for the three isomers (Figure 9) showsboth similarities and differences between the isomers.Isomers 2 and 3 have a base peak at m/z 401.12309(CHo)and an additional ion m/z 132.02058 (CHO). The base peak in isomer 1 is m/z 383.11253 (CH9,) andthe m/z 132.02058 is absent. The capacity to confidentlyassign elemental compositions to these ions is highlybeneficial and provides the analyst with a complete picture.The m/z 401.12309 corresponds to a loss of C,H. from theparent and m/z 383.11253 a loss of C,HO. MassFrontierwas used to explain how these ions can be derived fromthe proposed chemical structure. From this information,the flexibility to perform MS/MS experiments with accuratemass information allows for detailed structural informationto be determined. Time (min) Figure 8. XIC m/z 468.17783 from the full-scan El data and m/z 469.18532 from the full-scan PCI datain packaging sample shows 3 isomers of the same parent mass. Inset proposed chemical structure ofcompound. 383.11234 C21H1907 100- 149.02322 -0.50069 ppm C:H503 -0.67372 ppm Isomer 1 ooHHOOH 401.12286 C21 H21 O 100- -0.57812 ppm 80- 60- 132.02052 235.09627 lsomer 3 40- 69.06984 104.02562 CsH402 C13H1504 297.03913 383.11216 413.12288 C5Hg C7H40 -0.47263 ppm -0.90210 ppm C16Hg O: C21 H19 07 C22 H21 O: 20- -0.55487 ppm -0.41945 ppm 149.02293 -0.80121 ppm -0.95274 ppm -0.52265 ppm T 480 TT 500 60 80 100 120 140 180 200 220 240 260 280 300 320 340 360 380 400 420 T440 460 Figure 9. MS/MS spectra of m/z 469.18 of the three isomers reveals different fragmentation patterns for isomers 2 and 3. Of particular note, thebase peak is 401.12286 and the presence of m/z 132.02049 ion. Conclusions The results of this study demonstrate that the ThermoScientific Q Exactive GC hybrid quadrupole-Orbitrapmass spectrometer, in combination with easy-to-usesoftware tools, is a powerful tool for the profiling ofcomplex samples and for the identification of unknownchemicals. The Orbitrap mass spectrometer deliversexcellent resolution and mass accuracy which leads tofast and confident characterization of samples regardlessof the concentration. A food packaging sample wasquickly screened for known compounds using spectralmatching and rationalisation using accurate mass. El andPCI information leads to confident chemical formulas to beproposed for molecular ions and fragments for compoundswith no library match. Furthermore, the ability to perform high resolution, accurate mass MS/MS experimentscompletes the unknown identification workflow andallows for an even higher level of confidence and providesimportant structural information. References 1. Migration from Food Contact Materials. L. L. Katan(editor), Blackie Academic and Professional, Glasgow,UK, 1996. 2. Barnes, K.A., Sinclair, C.R. & Watson, D.H. (2006)Chemical Migration and Food Contact Materials.Woodhead publishing. 3. Thermo Fisher Scientific AN10492. Chemical profilingand differential analysis of whiskies using OrbitrapGC-MS. Runcorn, United Kingdom. @2016 Thermo Fisher Scientific Inc. All rights reserved. All trademarks are the property of Thermo Fisher Scientificand its subsidiaries. This information is presented as an example of the capabilities of Thermo Fisher Scientificproducts. It is not intended to encourage use of these products in any manners that might infringe the intellectualproperty rights of others. Specifications, terms and pricing are subject to change. Not all products are available in allcountries. Please consult your local sales representatives for details. AN10527 1016 本研究的重点是利用具有高质量分辨率性能和优异质量精度的新型 GC-MS 系统来快速而可靠地鉴定食品包装中的未知化合物。
关闭-
1/9
-
2/9
还剩7页未读,是否继续阅读?
继续免费阅读全文产品配置单
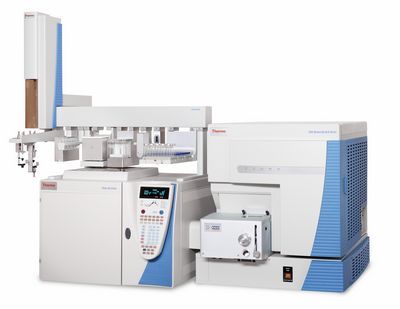
赛默飞色谱与质谱为您提供《食品包装中未知物质检测方案(气质联用仪)》,该方案主要用于包装中未知物质检测,参考标准《暂无》,《食品包装中未知物质检测方案(气质联用仪)》用到的仪器有赛默飞Exactive GC Orbitrap GC-MS系统、赛默飞TRACE 1310 气相色谱仪、赛默飞TriPlus RSH 气相/气质自动进样器。
我要纠错
推荐专场
气相色谱仪(GC)
更多
相关方案
 咨询
咨询