

方案详情文
智能文字提取功能测试中
AtmosphericAtmos. Meas. Tech. Discuss., https://doi.org/10.5194/amt-2018-377MeasurementManuscript under review for journal Atmos. Meas. Tech.Discussion started: 29 November 2018TechniquesC Author(s) 2018. CC BY 4.0 License. AtmosphericMeasurementTechniques oo Discussions Negligible influence of livestock contaminants and sampling system onammonia measurements with cavity ring-down spectroscopy Jesper Norlem Kamp1.2, Albarune Chowdhury, Anders Peter S. Adamsen’ and Anders Feilbergl Department of Engineering, Aarhus University, Aarhus, 8000, Denmark 5 2Arctic Research Centre, Aarhus University, 8000 Aarhus, Denmark SEGES,8200 Aarhus N, Denmark Correspondence to: Anders Feilberg (AF@eng.au.dk) Abstract. Pollution from ammonia (NH3) is a widespread problem due to the effects on the environment and human health. The agricultural sector accounts for nearly all NH emissions in Europe; thus, focus has especially been on NH3 emissions10 from this sector in recent years. We need abatement techniques to reduce NH emissions, and in order to evaluate thetechniques, there is a strong need for reliable NH measurement methods. Photoacoustic spectroscopy (PAS) is often used tomeasure NH concentrations, but recent discoveries show interference from compounds typically present in livestockproduction and during agricultural activities. We tested the performance of the Cavity Ring-Down Spectroscopy (CRDS) fromPicarro as an alternative to PAS for filter effects and laboratory and field calibrations with standard gasses. Furthermore,15 concentrations of ten volatile organic compounds (VOCs) where determined by Proton-Transfer-Reaction Mass Spectrometry(PTR-MS) to test the potential interference of these VOCs. Both laboratory and field calibrations show excellent linearity overa large dynamic range of NH concentrations. The analyzer shows a small humidity effect of up to a few ppb in the extremecase of a nearly water saturated air stream. Besides, from the negligible humidity dependence, there is no interference fromthe tested VOCs. Overall, the CRDS system performs well with only negligible influences from other compounds. 20 1 Introduction 25 Ammonia (NH) is an important atmospheric pollutant as it has negative effects on ecosystems and human and animal health(Aneja et al., 2001; Davidson et al., 2005). Deposition of NH3 can lead to eutrophication and acidification, which has negativeeffects on biodiversity (Sheppard et al.,2011). NH is not a greenhouse gas (GHG), but it is a precursor for aerosol formationthereby influencing the global warming, furthermore different oxidation pathways of NH3 produce nitrous oxide (N2O) andnitric oxide (NO) (Zhu et al.,2013). N2O is a very potent GHG and NO is involved in atmospheric reactions producingtropospheric ozone (Aneja et al., 2001). As a precursor for aerosols and thereby formation of particles in the atmosphere, NHhas harmful effects on human health (Aneja et al., 2001; Baek et al., 2004). Emissions of NH have an impact on ecosystems,global warming and human health, thus it is important to measure NH3 concentrations correctly. Agricultural activities, mainly manure application and management, accounts for around 94% of NH emissions in Europe30 (Nielsen et al., 2017), and much control in the agricultural sector intend to limit these emissions. Reliable measurements in the Atmos. Meas. Tech. Discuss., https://doi.org/10.5194/amt-2018-377Manuscript under review for journal Atmos. Meas. Tech.Discussion started: 29 November 2018C Author(s) 2018. CC BY 4.0 License. OEGUo agricultural sector are highly important to give accurate estimates of NH emissions in order to reduce the emissions e.g. byvalidation of technological improvements within the agricultural sector. Many agricultural studies use photoacousticspectroscopy (PAS) (Poissant et al., 2005; Rom and Zhang, 2010; Saha et al., 2010; Wu et al., 2012; Zhang et al., 2005; Zonget al., 2014), but findings by Rosenstock et al. (2013) and Liu et al. (2018) show high interference on NHs measurements from 5 a variety of organic compounds including carboxylic acids and alcohols. Hassouna et al. (2013) report non-constant bias in theresults from PAS measurements on NH3 and N2O caused by organic compounds often present at agricultural sites, which makethe PAS measurements uncertain in an agricultural setting. Other agricultural studies use CRDS to measure ammoniaconcentrations (Maasikmets et al., 2015; Sintermann et al., 2011). It is challenging to measure NH3 concentrations correctly due to its properties of high water solubility and polarity, which10 cause adsorption on surfaces in the sampling system and within the instrument (Rom and Zhang, 2010; Shah et al., 2006;Vaittinen et al., 2014). This “sticky nature” of NH causes delays in the measurements, giving longer response times (Romand Zhang, 2010; Shah et al., 2006; Vaittinen et al., 2014). Furthermore, it is a challenge to measure NHs in livestock buildings,where dust and particles provide large surface areas for its adsorption in particulate filters. NH3 adsorption can affect responsetime and accuracy of the analyzers, causing a time delay and measuring errors. 15 The air inside animal production buildings contains a variety of chemical compounds,relatively high water content and highdensities of particulate matter. Several NHs analyzers are sensitive to water vapor and other gasses (Bobrutzki et al., 2010;Huszár et al., 2008; Ni and Heber, 2008;Rom and Zhang, 2010; Rosenstock et al., 2013). Such interference can introduceerrors depending on the instrument used. Proper calibration before and during laboratory and field measurement can reducethe potential errors and improve the accuracy of the measurement system. Quantification of the errors can enhance the quality 20 of the NH measurement data, which is essential to research, emission abatement and policy-making. There are varieties ofNHs measurements methods, Bobrutzki et al. (2010) conduct a field inter-comparison of eleven atmospheric NHs measurementtechniques including Cavity Ring-Down Spectroscopy (CRDS), and the results show a good overall agreement between theinstruments on an hourly basis. CRDS provides measurements in real time with high sensitivity, high selectivity and a fast response time. The CRDS analyzer25 maintains high linearity, precision and accuracy over changing environmental conditions without the need for frequentcalibration. The work of Martin et al. (2016) led to an improvement of water vapor interference calculations on Picarro’sCRDS for NH3 measurements. The scale factor error they discovered is approximately 2% of the absolute water concentration.Unfortunately, our Piccaro analyzer has not incorporated this upgraded correction, but the analyzer still corrects for H2Ointerference; thus, we expect this to have insignificant effect on the results. 30 We wish to address the interferences from VOCs further as the PAS technique seems to be inadequate for measurements insome agricultural environments (Hassouna et al., 2013; Liu et al., 2018; Zhao et al., 2012). A great number of VOCs areemitted in agricultural buildings from e.g. silage, manure and the animals (Feilberg et al., 2010; Hafner et al., 2013; Hansen etal., 2012; Ngwabie et al., 2008; Shaw et al., 2007; Yuan et al., 2017). The VOCs can potentially interfere with NH3measurements as seen for PAS. Atmos. Meas. Tech. Discuss., https://doi.org/10.5194/amt-2018-377Manuscript under review for journal Atmos. Meas. Tech.Discussion started: 29 November 2018C Author(s) 2018. CC BY 4.0 License. Our focus is on CRDS and we use the Picarro NH3/H2O analyzer (Picarro Inc., Santa Clara, CA, USA) for all measurementsof NH. The manufacturer states a lower detection limit below 0.5 ppb+0.1% of reading (1s, 1o) and below 0.03 ppb 0.1%of reading (5 min, 1o) (Picarro, 2017). The response time is stated to be less than 30 seconds for 0 to 3 ppm and a recoverytime from 10 to 0.2 ppb of less than 1 hour (Picarro, 2017). Our aim is to demonstrate the performance of the CRDS analyzer 5 for measurements of NHs gas concentration under laboratory and field conditions. Furthermore, to identify and quantifypotential interfering compounds present in livestock buildings with state of the art Proton-Transfer-Reaction MassSpectrometry (PTR-MS) to measure VOC concentration. To our knowledge no studies has focused on the interference fromVOCs on CRDS measurements, which cause major concerns for measurements with PAS techniques (Hassouna et al., 2013;Liu et al., 2018; Zhao et al.,2012). Due to the interferences present in PAS measurement, there is a need for a better alternative, 10 which is debated in the scientific society. Another issue with PAS measurements is the long response time of up to 25 minutes(Rom and Zhang, 2010), which lowers the time resolution of a study. NH3 is underestimated by approximately 14% and 2%after 12.5 and 25 minutes, respectively (Rom and Zhang, 2010). Typical measurements in cattle barns takes places at multiplepoints, e.g. Rong et al. (2014) measure at 7 points in a dairy cow building and Ngwabie et al., (2009) measure at 11 points ina dairy cow barn. The cycle time for a typical setup in a barn would be in the order of 3-5 hours, which makes it impossible to 15 see most temporal variations with only 4-8 measurements per measurements point a day. Thus, the response time is a keyparameter for equipment measuring at multiple points as done in livestock buildings. CRDS has a potential to be more accurate,precise and faster responding alternative to PAS. This study aims to validate CRDS for measurements in the agricultural industry, thus we test for interference with a number of compounds typically present in pig houses and cattle farms where NH3concentration measurements are routine. Laboratory20 tests include determination of the response parameters linearity, response time, influence of particulate filters and chemicalinterference. Field tests include determination of the response parameters linearity, response time and particulate filter effect.To test for the effects of VOC, we used PTR-MS, a powerful tool to measure selected VOCs and trace gasses in real time.Protonated water is a soft ionization source that protonates VOCs in a non-dissociative manner (de Gouw and Warneke,2007;Lindinger et al., 1998). High selectivity and sensitivity are key characteristics of the method along with short response time 25 (de Gouw and Warneke, 2007). PTR-MS is ideal to quantify low concentrations of potentially interfering compounds in realtime. In this paper, we address the accuracy of CRDS in terms of interference from a range of VOCs normally present duringlivestock production and manure handling. CRDS is one of the online and not labor-intensive methods with the potential tomeasure NHs emissions. The focus on reduction of NH emissions (e.g. Directive on the reduction of national emissions of30 certain atmospheric pollutants (EU 2016-2284) (EC, 2016)) makes reliable and accurate measurement techniques essential. Atmos. Meas. Tech. Discuss., https://doi.org/10.5194/amt-2018-377Manuscript under review for journal Atmos. Meas. Tech.Discussion started: 29 November 2018 2 Materials and Methods 2.1 Chemicals, reagents and gasses We used the following chemicals during the experiments: 70 mM acetic acid (VWR int. S.A.S., Fontenay-sous-Bois,France), 27 mM 1-propanol (Merck KGaA, Darmstadt, Germany), 1.3 mM 2-propanol (Sigma-Aldrich Chemie GmbH, Steinheim,5 Germany), 0.7 mM acetaldehyde (Sigma-Aldrich), 4 mM propionic acid (Alfa Aesar GmbH & Co KG, Karlsruhe, Germany),0.8 mM acetone (Merck), 10 mM methanol (VWR), 2.2 mM 1-butanol (Merck), 69 mM ethanol (CCS Healthcare AB,Borlange, Sweden) and 44 mM butanoic acid (Alfa Aesar). Deionized water dissolved the chemicals to the wantedconcentrations. We used the following gasses during the experiments: 101 ppm NH3 (±10%) in N2 calibration gas (AGA A/S, Copenhagen,10 Denmark), pure (99.99%) CO2 (AGA), pure (99.99%) CH4 (AGA) and as zero air compressed air passed through a bed ofsilica gel and charcoal to remove water, ozone, hydrocarbons and other common contaminants. Mass flow controllers (MFCs)from the EL-FLOW (Bronkhorst High-Tech B.V., Ruurlo, Netherlands) series regulated all gas flows with an accuracy oft5%. 2.2 Interference 15 A Picarro NH3/H2Oanalyzer model G2103 (Picarro Inc., Santa Clara, CA, USA) measured the NH3 concentration continuouslyand a high sensitivity PTR-MS (Ionicon Analytik, Innsbruck, Austria) measured concentrations of different VOCs for theinterference tests. The drift tube setting was 600 V, 2.1-2.2 mbar and 60℃, which yield an E/N of approximately 130 Td.Fragmentation of alcohols are normal in PTR-MS and we use the fragmentation of alcohols as described by Brown et al. (2010)to calculate the final concentration with all fragments taken into consideration. 20 One stream of clean air passed through the headspace air over an aqueous solution containing a single compound. Anotherstream diluted the outflow from the headspace. We changed the airflows to get different concentrations of the compound inthe gas phase. The CRDS and PTR-MS received the diluted air streams. 2.3 Linearity, calibration and filter effect We used a flow dilution system with zero air and NH calibration gas (101 ppm) to test the linearity of the CRDS25 measurements. NH3 gas concentrations for the calibration were in the range from 0.20 to 16.8 ppm in the laboratory and from0.27 to 20.0 ppm under field conditions. We performed the calibrations in the laboratory without external filters. Introductionof all gasses in the field was through a multi-position rotary valve (MPV, Cheminert low-pressure valve, model C25, VICIAG International, Schenkon, Switzerland) for 6 min while CRDS was in normal sampling mode. We performed a single pointcalibration in the field to test the system integrity and analyzer response time by introducing 7.8 ppm NH3 calibration gas30 directly into the sampling lines manually removed from their position. We tested the PTFE filters in the laboratory for NH Atmos. Meas. Tech. Discuss., https://doi.org/10.5194/amt-2018-377Manuscript under review for journal Atmos. Meas. Tech.Discussion started: 29 November 2018C Author(s) 2018. CC BY 4.0 License. OEGUo 5 signals by connecting filters used for 2 weeks to a clean air supply under heating to maximum 75°C. Monitoring of the NH3signals continued until the concentration went below 5 ppb; see Table 1 for abbreviations and specifications ofthe used filters.We performed laboratory tests on the response time by switching between ambient air and 1.02 ppm NH3 with the MPVwithout external filters attached. We also tested response time to a step change in NH3 concentration with different externalparticulate filters attached. The concentrations were 0.203 and 10.01 ppm NH3 with filters of different pore size made ofPTFE,glass fiber and quartz. Table 1 shows the specifications of the filters. 2.4 Field testing We conducted field tests in a cattle barn with natural ventilation located in central Jutland outside Viborg, Denmark. The cattle barn is 9 m high, 60 m long and 36 m wide and naturally ventilated. We measured NH3 concentrations in the cattle building10 with CRDS combined with a 10 port (P1-P10)MPV (C25-61800, VICI Valco Inst. Co. Inc., Texas,USA). Measurements wereset up according to Rong et al (2014) and Wu et al. (2012). We considered the division into three 20 m sections inside thecattle barn to be representative of the animal-occupied zone of the barn. We sampled NH3 concentrations from the threesections using PTFE tubes (inner diameter 6 mm, 20 m long) with 20 uniformly distributed sampling openings. The samplingpoints (SP) SP2, SP3 and SP4 were inside the building, with SP2 and SP4 on each ofthe end walls adjacent to the windows 15 placed2.5 m above the floor. SP3 was just below the ridge opening in the middle of the building placed 9 m above the floor.SP1 and SP5 were outside as background measurements from two single points placed 5 m from the building sidewalls at 2.5m height. The sample tubes were between 5 and 50 m long with heating cables attached to avoid condensation inside thetubing. Each sampling line had a secondary suction pump (flow rate of 6-7 L minl) with a PTFE membrane to generate aconstant flow through the lines. A PTFE filter (0.20 pm pore size) removed airborne particulate matter from the sample air20 before the sampling ports of the MPV. Replacement of filters was at last fortnightly. Measurement lasted 6 min for each sampling port with automatic switching, i.e. a measurement cycle was 30 min. 3 Results 3.1 Laboratory tests The CRDS had a highly linear response (R2=0.99998) to NHs concentrations over the dynamic range 0.20-16.8 ppm (Figure25 1). The NH standard calibration gas used for all calibrations had an accuracy of±10%stated by the manufacturer. Themeasured NH3 concentrations in Figure 1 are averages of several hundred measurements and the standard deviations areindicators of stability.Figure 2 shows the result of a step change in concentration from clean air to 1.02 ppm and back to cleanair, where the rise time to 95% concentration level was 13 s and the fall time to 5% concentration level was 19 s. Furthermore,Figure 3 shows response times to step changes to two concentrations (0.203 and 10.01 ppm) with different types ofexternal30 particulate filters. The response times varied for the different filter types with an average rise and fall time of 38 s and 52 s Atmos. Meas. Tech. Discuss., https://doi.org/10.5194/amt-2018-377Manuscript under review for journal Atmos. Meas. Tech.Discussion started: 29 November 2018C Author(s) 2018. CC BY 4.0 License. OEGUo (for 0.203 ppm), and 14 s and 12 s (for 10.01 ppm), respectively (Figure 3). Across all filter types, the response time wasfastest for changes to the highest concentration, see details in Table A2. 5 Measurements on zero air over an hour gave a standard deviation on the NHs concentration of 0.115 ppb. This gives a limit ofdetection (LOD) of 0.35 ppb for three standard deviations and a limit of quantification (LOQ) of 1.15 ppb for ten standarddeviations. see Table 2. We used pure deionized water to produce a range of different humidity without any contaminating compounds. Figure 4 showsthe effects of the humidity changes on the NH3 signal from relative humidity (RH) ranging from 6.3% to 98.6%. The responseto the change in humidity is linear (R2=0.83) with NHs measurements from 1.3 to 4.6 ppb over the given RH range. Figure5 shows the CRDS signals from CO2 and CH4, where random fluctuations in the low ppb level are present. There are10 no apparent interferences from these two compounds. All measured NH3 concentrations for both compounds are below theLOQ. Figure 6 shows the interferences of ten different VOCs, where each row represent one compound. The third column shows aclear pattern for increased water vapor with VOC concentration as water is introduced with the VOCs. NH3 concentrationincreased with increased water vapor for all compounds. The observed interferences were in the range from 0.5 to 5 ppb NH 15 equivalents at VOC concentrations from 6 to 8000 ppb. These VOC concentrations range from levels comparable to field conditions up to levels 1-2 orders of magnitude higher than at field conditions. 3.2 Field Tests In the field, the CRDS also has a highly linear response (R2=0.9995) in the concentration range 0.27-20.04 ppm, see Figure 7. Figure 8 shows the results of a single point field calibration of the system integrity and response time to a sudden change to20 7.8 ppm with response times varying from 6 to 25 s. The calibration gas used in the measurements showed in Figure 7 andFigure 8 had an uncertainty of±10%. 25 Figure 9 shows the signals from 2 weeks old external particulate filters flushed with zero air. The concentration maximumvaried between 25 and 38 ppb. The peak values are comparable to typical ambient laboratory concentrations ranging from 14-37 ppb; see Table A1. Vacuum pumps applied a gas flow rate of minimum 6 L min through the filter over the two-weekperiod, thus minimum 120 m’of air went through each filter. 4 Discussion 30 The CRDS analyzer had a linear response during both laboratory test and field validation (Figure 1 and Figure 7) in the rangefrom approximately 0.2 to 20 ppm; NH3 concentrations in livestock buildings are normally within this range (Heber et al.,2006; Koerkamp et al., 1998). This is in agreement with the manufacturer specifications that guarantees the range from 0 to500 ppb, and with operational and optional expanded range up to 10 and 50 ppm, respectively (Picarro, 201). The fieldcalibration show excellent agreement with the standard gas concentrations. The standard gas had an uncertainty of± 10% Atmos. Meas. Tech. Discuss., https://doi.org/10.5194/amt-2018-377Manuscript under review for journal Atmos. Meas. Tech.Discussion started: 29 November 2018C Author(s) 2018. CC BY 4.0 License. OEGUo according to the data sheet from the manufacturer, which may well explain the small offset (<4%) from the obtainedconcentrations seen in Figure 8. The LOD found in the present study is comparable to the manufacturer’s specifications for lseconds integration time, as seen in Table 2. The charcoal filter used might not clean the zero air generated completelycompared to analytical standard gasses, thus we expect even lower LOD and LOQ by the use of analytical gas standards insteadof air filtered by activated charcoal. The performance of a single point field calibration showed very good agreement with the 5expected concentrations as seen in Figure 8. It is a requirement to have fast responding analyzers to understand the dynamic behavior and diurnal variations of NHs concentrations in animal buildings. Ni and Heber (2008) suggest a response time of less than 2 min to capture temporal NH3 concentration variations. The CRDS shows sufficiently low response times under laboratory (Figure 2 and Table A2) and field10 conditions (Figure 8). These times are also comparable to <30 s for responses to 3 ppm as reported by the manufacturer(Picarro, 2017). Furthermore, there are no clear changes in response time without the use of an external particulate matterfilter. The tested filters vary in response time, but it is clear that the concentration difference in the step change was importantwhere increasing concentration differences gave decreasing response times. The manufacturer reports rise- and fall times ofapproximately 16 seconds, which, compared to the present results, are very similar with some variations. The response to a 15 change from 0 to 1.02 ppm gave 13 s and 19 s for the rise- and fall time, respectively (Fig. 3). Rise times with externalparticulate filters connected were 16 s, 6 s, 13 s, and 25 s, for SP1, SP2, SP3 and SP5, respectively. Adsorption to samplingmaterial including filters explains the differences in response time. Response times are in general faster for higherconcentration differences; see Fig. 4, as surface saturation is faster. The observed concentrations of NH3 released from 2 weeksold particulate filters (Fig. 6) suggest that adsorption of NH to the filter material, surfaces and walls were negligible. The 20 levels released over 1 minute(<50 ppb) should be compared to a filter exposure of ammonia of>100 ppb (ranging in to lowppm levels) over 2 weeks. These results indicate that the use ofexternal filters gives satisfying response times and no problemswith long-term adsorption of NH3 on the filter material. The gasses CO2 and CH4 are present in the atmosphere in relatively high concentration compared to other trace gasses, andanimals produce CO2 and CH4, thus elevated concentrations are normal in animal houses. Over a large dynamic area, we25 observed little scatter and no interference for CO2 and CH4 on NH measurements as seen in Figure 5. The mean concentrationof both compounds are below the LOQ. For the interference of single VOCs, it was as expected that the different dilutions prepared from clean dry air mixed with humid headspace air over a VOC solution gave a correlation between water vapor and VOC concentration. This was also thecase as seen in the subplots in the third column of Figure 6 for all ten volatile compounds. Martin et al. (2016) observe an30 interference from water vapor on NH3 measurements due to spectral line broadening, which the manufacturer corrects for inall models produced after the publication. Our Picarro analyzer from December 2014 does not make this extra correction, thuswe expected a small water dependency for NH3, which we indeed see in Figure 4 and Figure 6. Figure 4 shows the humidityeffect on the CRDS signal generated from pure deionized water and reveals a small dependency for water vapor, which theimprovements by Martin et al. (2016) potentially remove. Nonetheless, our results show up to 4.5 ppb NH for a nearly water Atmos. Meas. Tech. Discuss., https://doi.org/10.5194/amt-2018-377Manuscript under review for journal Atmos. Meas. Tech.Discussion started: 29 November 2018C Author(s) 2018. CC BY 4.0 License. OEGUo saturated air stream with an absolute H2O concentration of approximately 1.1%. Thus, in the extreme case of low NHconcentrations (e.g. 100 pbb) and very humid air, a water vapor interference of up to 5 % of the NH3 signal may be present,but under normal conditions, this is negligible. The ten tested compounds are normally present during agricultural activities in sub-ppm levels (Copeland et al., 2012; Yuan5 et al., 2017). We choose a concentration range that covers a large dynamic area and exceeds the normal maximumconcentration in e.g. livestock buildings to obtain the potential maximum interference and we only observed very small waterinduced interferences. E.g., a 1-butanol concentration of 1.5 ppm gave a CRDS NH3 concentration of 0.9 ppb, i.e. less than0.06% of a 1:1 interference, which Liu et al. (2018) observe for several organic compounds when using photoacoustic NH3analysis. Overall, the difference between high and low concentration for a single VOC was approximately 1-2 ppb, except 10 acetic acid with a difference of nearly 4 ppb, but the differences in water vapor was different for the different compounds.Acetic acid, 2-propanol and propionic acids were the only compounds with absolute humidity above 1% as we used higherflow rates over the headspace to obtain the targeted concentrations. The very moist sample of acetic acid had a maximum of4.6 ppb NH3, which is very low compared to e.g. concentrations in animal buildings, which typically range from < 1 to 20ppm, but in extreme cases up 50 ppm (Heber et al., 2006; Koerkamp et al., 1998). Thus, errors on few ppb introduced by15 humidity effects would have overall impact on the results. For the given setup, the interferences from water vapor were in the same order of magnitude as the LOQ of 1.15 ppb. For more than half of the VOCs, the NHs concentration falls below the LOQfor all or most measurement. This demonstrates a very low interference from the investigated VOCs. Our tests of the Picarro CRDS showed great linearity during both laboratory and fieldwork. The rise- and fall times toconcentrations changes were sufficiently low to measure temporal variations in NH3 concentrations. Examinations of external20 particulate filters lead to no clear recommendations for filter material, but all filter gave acceptable response times and onlysmall amounts ofNH adsorption compared to background levels. We used PTR-MS to determine accurate VOC concentrationfor ten compounds and the compounds gave negligible interference on CRDS NH3 measurements. Code and data availability. Data and code are available upon request to the corresponding author. 25 Author contributions. Conceptualization, A.F., A.C. and J.K.; Methodology, A.F., A.C. and A.P.A.; Validation, J.K., A.Fand A.C.; Formal Analysis, J.K and A.C..; Investigation, J.K. and A.C.; Resources, A.F. and A.P.A.; Data Curation, J.K. andA.C; Writing-Original Draft Preparation,J.K. and A.C.;Writing-Review & Editing, A.F., and A.P.A..; Visualization, J.K.;Supervision, A.F. and A.P.A.; Project Administration, A.F. and A.P.A.; Funding Acquisition, A.F. and A.P.A. 30 Competing interests. The authors declare no conflict of interest. Acknowledgements. The authors thank laboratory technicians Heidi Gronbaek Christiansen and technician Peter StoregardNiels for their valuable help during the experimental part of the study. The authors thank the Danish Milk Levy Foundationfor funding this research. 35 References Aneja, V. P., Roelle, P. A., Murray, G. C., Southerland, J., Erisman, J. W., Fowler, D., Asman, W. A. H. and Patni, N.: Atmos. Meas. Tech. Discuss.,https://doi.org/10.5194/amt-2018-377Manuscript under review for journal Atmos. Meas. Tech.Discussion started: 29 November 2018C Author(s) 2018. CC BY 4.0 License. Oo Atmospheric nitrogen compounds II: emissions, transport, transformation, deposition and assessment, Atmos. Environ.,35(11),1903-1911, doi:https://doi.org/10.1016/S1352-2310(00)00543-4,2001.Baek, B. H., Aneja,V. P. and Tong, Q.: Chemical coupling between ammonia, acid gases, and fine particles, Environ. Pollut.,129(1), 89-98, doi:https://doi.org/10.1016/j.envpol.2003.09.022,2004. 5 Bobrutzki, K. von, Braban, C. F., Famulari, D., Jones,S. K.,Blackall, T., Smith, T. E. L., Blom, M., Coe, H., Gallagher, M.,Ghalaieny, M., McGillen, M. R., Percival, C. J., Whitehead, J. D., Ellis, R., Murphy,J., Mohacsi, A., Pogany, A., Junninen,H., Rantanen, S., Sutton, M. A. and Nemitz, E.: Field inter-comparison of eleven atmospheric ammonia measurementtechniques, Atmos. Meas. Tech.,3(1),91-112, doi:10.5194/amt-3-91-2010,2010. Brown,P., Watts, P., Mark, T. D. and Mayhew, C. A.: Proton transfer reaction mass spectrometry investigations on the effects10 0of reduced electric field and reagent ion internal energy on product ion branching ratios for a series of saturated alcohols, Int.J. Mass Spectrom., 294(2-3), 103-111, doi:10.1016/j.ijms.2010.05.028,2010. Copeland, N., Cape, J.N. and Heal, M. R.: Volatile organic compound emissions from Miscanthus and short rotation coppicewillow bioenergy crops, Atmos. Environ., 60(x), 327-335, doi:10.1016/j.atmosenv.2012.06.065, 2012. Davidson, C. I., Phalen, R. F. and Solomon, P. A.: Airborne Particulate Matter and Human Health: A Review, Aerosol Sci.15 Technol., 39(8),737-749, doi:10.1080/02786820500191348,2005. EC, E. C.: DIRECTIVE (EU) 2016/2284 OF THE EUROPEAN PARLIAMENT AND OF THE COUNCIL of 14 December2016 on the reduction of national emissions of certain atmospher ic pollutants., 2016.Feilberg, A., Liu, D., Adamsen, A. P. S., Hansen, M. J. and Jonassen, K. E. N.: Odorant Emissions from Intensive PigProduction Measured by Online Proton-Transfer-Reaction Mass Spectrometry, Environ. Sci. Technol., 44(15), 5894-5900, 20 doi:10.1021/es100483s,2010. de Gouw, J. and Warneke, C.: Measurements of volatile organic compounds in the earth’s atmosphere using proton-transfer-reaction mass spectrometry, Mass Spectrom. Rev., 26(2),223-257, doi:10.1002/mas.20119,2007.Hafner, S. D., Howard, C., Muck, R. E., Franco, R. B., Montes, F., Green,P. G., Mitloehner, F., Trabue, S. L. and Rotz, C. A.: Emission of volatile organic compounds from silage: Compounds, sources, and implications, Atmos. Environ., 77, 827-839,25 doi:10.1016/j.atmosenv.2013.04.076,2013. Hansen, M. J., Liu, D., Guldberg, L. B. and Feilberg, A.: Application of proton-transfer-reaction mass spectrometry to theassessment of odorant removal in a biological air cleaner for pig production, J. Agric. Food Chem., 60(10), 2599-2606,doi:10.1021/jf300182c,2012. Hassouna, M., Robin, P., Charpiot, A., Edouard, N. and Meda, B.: Infrared photoacoustic spectroscopy in animal houses: 30 Effect of non-compensated interferences on ammonia, nitrous oxide and methane air concentrations, Biosyst. Eng.,114(3), 318-326, doi:https://doi.org/10.1016/j.biosystemseng.2012.12.011,2013. ( Heber, A. J., Ni, J.-Q.,Lim, T. T., Tao,P.-C., Schmidt, A. M . , Koziel,J. A. , Beasley,D. B ., Hoff, S. J .,Nicolai, R. E., Jacobson, L. D. and Zhang, Y.: Quality Assured Measurements of Animal Building Emissions: Gas Concentrations,J. Air Waste Manage. Assoc., 56(10), 1472 -1 483, doi:10.1080/10473289.2006.10465680,2006. ) Atmos. Meas. Tech. Discuss., https://doi.org/10.5194/amt-2018-377Manuscript under review for journal Atmos. Meas. Tech.Discussion started: 29 November 2018C Author(s) 2018. CC BY 4.0 License. Oo Huszár, H., Pogány, A., Bozoki, Z., Mohácsi, A., Horvath, L. and Szabó, G.: Ammonia monitoring at ppb level usingphotoacousticspectroscopyforreenvironmentalapplication1,, SSensors Actuators B Chem..134(2), 1027-1033.doi:https://doi.org/10.1016/j.snb.2008.05.013,2008. Koerkamp, P. W. G. G., Metz, J. H. M., Uenk, G. H., Phillips, V. R., Holden, M. R., Sneath, R. W., Short, J. L., White, R. P. 5 P., Hartung, J., Seedorf, J., Schroder, M., Linkert, K. H., Pedersen, S., Takai, H., Johnsen, J.O. and Wathes, C. M.:Concentrations and Emissions of Ammonia in Livestock Buildings in Northern Europe, J. Agric. Eng. Res., 70(1), 79-95,doi:doi.org/10.1006/jaer.1998.0275,1998. Lindinger, W., Hansel, A. and Jordan, A.: On-line monitoring of volatile organic compounds at pptv levels by means of proton-transfer-reaction mass spectrometry (PTR-MS) medical applications, food control and environmental research, Int. J. Massi0 Spectrom. Ion Process., 173(3), 191-241, doi:https://doi.org/10.1016/S0168-1176(97)00281-4,1998. Liu, D., Rong, L., Kamp, J., Kong, X., Adamsen, A. P. S., Chowdhury, A. and Feilberg, A.: Photoacoustic measurement maysignificantly overestimate NH3 emissions from cattle houses due to VOC interferences, Environ. Sci. Technol., Submitted,2018. Maasikmets, M., Teinemaa, E., Kaasik, A. and Kimmel, V.: Measurement and analysis of ammonia, hydrogen sulphide and15 odour emissions from the cattle farming in Estonia, Biosyst. Eng.,139, 48-59, doi:10.1016/j.biosystemseng.2015.08.002,2015. Martin, N. A., Ferracci, V., Cassidy, N. and Hoffnagle, J. A.: The application of a cavity ring-down spectrometer tomeasurements of ambient ammonia using traceable primary standard gas mixtures, Appl. Phys. B, 122(8 LB-Martin2016),219, doi:10.1007/s00340-016-6486-9,2016. 20 Ngwabie, N. M., Schade, G. W., Custer, T. G., Linke, S. and Hinz, T.: Abundances and Flux Estimates of Volatile Organic Compounds from a Dairy Cowshed in Germany, J. Environ. Qual.,37(2), 565, doi:10.2134/jeq2006.0417,2008.Ngwabie, N. M., Jeppsson, K. H., Nimmermark, S., Swensson, C. and Gustafsson, G.: Multi-location measurements ofgreenhouse gases and emission rates of methane and ammonia from a naturally-ventilated barn for dairy cows, Biosyst. Eng.,103(1),68-77, doi:https://doi.org/10.1016/j.biosystemseng.2009.02.004, 2009. 25 Ni, J.-Q. and Heber, A.J.: Sampling and Measurement of Ammonia at Animal Facilities, in Advances in Agronomy, vol. 98,pp. 201-269, Academic Press.,2008. Nielsen, O. K., Plejdrup, M. S., Winther, M., Mikkelsen, M. H., Nielsen, M., Gyldenkaerne, S.,Fauser, P., Albrektsen, R.,Hjelgaard, K. H., Bruun, H. G. and Thomsen, M.: Annual Danish Informative Inventory Report to UNECE. Emissioninventories from the base year of the protocols to year 2015, Aarhus University, DCE -Danish Centre for Environment and30 Energy.,2017. Picarro,I.: NH3 Analyzer for Ambient Air Datasheet,, doi:Archived by WebCite@ at http://www.webcitation.org/70JfzdB0u,2017.Poissant, L., Pilote, M., Beauvais, C., Constant, P. and Zhang, H. H.: A year of continuous measurements of three atmosphericmercuryspecies (GEM, RGMandd Hg p)) in southern Quebec, Canada, Atmos.Environ., 39(7),, i1.275-1287. Atmos. Meas. Tech. Discuss., https://doi.org/10.5194/amt-2018-377Manuscript under review for journal Atmos. Meas.Tech.Discussion started: 29 November 2018C Author(s) 2018. CC BY 4.0License. AtmosphericOo Discussions doi:10.1016/j.atmosenv.2004.11.007,2005. Rom, H. B. and Zhang, G. Q.: Time delay for aerial Ammonia concentration measurements in livestock buildings, Sensors,10(5),4634-4642, doi:10.3390/s100504634,2010. Rong, L., Liu, D., Pedersen, E. F. and Zhang, G.: Effect of climate parameters on air exchange rate and ammonia and methane 5 emissions from a hybrid ventilated dairy cow building,Energy Build., 82, 632-643, doi:10.1016/j.enbuild.2014.07.089,2014.Rosenstock, T. S., Diaz-Pines, E., Zuazo, P., Jordan, G., Predotova, M., Mutuo, P., Abwanda, S., Thiong'o, M., Buerkert, A.,Rufino, M. C., Kiese, R., Neufeldt, H. and Butterbach-Bahl, K.: Accuracy and precision of photoacoustic spectroscopy notguaranteed, Glob. Chang. Biol., 19(12), 3565-3567, doi:10.1111/gcb.12332,2013. Saha, C. K., Zhang, G., Kai, P. and Bjerg, B.: Effects of a partial pit ventilation system on indoor air quality and ammonia10 emission from a fattening pig room,Biosyst. Eng., 105(3), 279-287, doi:10.1016/j.biosystemseng.2009.11.006, 2010. Shah, S. B., Grabow, G. L. and Westerman, P. W.: Ammonia Adsorption in Five Types of Flexible Tubing Materials, Am.Soc. Agric. Biol. Eng., 22(September 2005), 919-923,2006. Shaw, S. L., Mitloehner,F. M., Jackson, W., Depeters, E. J., Fadel, J.G.,Robinson, P. H., Holzinger, R. and Goldstein, A. H.:Volatile organic compound emissions from dairy cows and their waste as measured by proton-transfer-reaction mass15 spectrometry, Environ. Sci. Technol.,41(4),1310-1316, doi:10.1021/es061475e,2007. Sheppard, L. J., Leith, I. D., Mizunuma, T., Neil Cape,J., Crossley, A., Leeson, S., Sutton, M. A., van Dijk, N. and Fowler,D.: Dry deposition of ammonia gas drives species change faster than wet deposition of ammonium ions: evidence from a long-term field manipulation, Glob. Chang. Biol., 17(12), 3589-3607, doi:10.1111/j.1365-2486.2011.02478.x, 2011. Sintermann, J., Ammann, C., Kuhn, U., Spirig, C., Hirschberger, R., Gartner, A. and Neftel, A.: Determination of field scale 20 ammonia emissions for common slurry spreading practice with two independent methods, Atmos. Meas. Tech.,4(9), 1821-1840, doi:10.5194/amt-4-1821-2011,2011. Vaittinen, O., Metsala, M., Persijn, S., Vainio, M. and Halonen, L.: Adsorption of ammonia on treated stainless steel andpolymer surfaces, Appl. Phys. B, 115(2LB-Vaittinen2014), 185-196, doi:10.1007/s00340-013-5590-3,2014. Wu, W., Zhang, G. and Kai, P.: Ammonia and methane emissions from two naturally ventilated dairy cattle buildings and the 25 influence of climatic factors on ammonia emissions, Atmos. Environ., 61, 232-243, doi:10.1016/j.atmosenv.2012.07.050, 2012.Yuan, B., Coggon, M. M., Koss, A. R., Warneke, C., Eilerman, S., Peischl, J., Aikin, K. C., Ryerson, T. B. and De Gouw, J.A.: Emissions of volatile organic compounds (VOCs) from concentrated animal feeding operations (CAFOs): Chemicalcompositions and separation of sources, Atmos. Chem. Phys.,17(8), 4945-4956, doi:10.5194/acp-17-4945-2017,2017. 30 Zhang,G., Strom, J. S., Li, B., Rom, H. B., Morsing, S., Dahl, P. and Wang, C.: Emission of ammonia and other contaminantgases from naturally ventilated dairy cattle buildings, Biosyst. Eng., 92(3), 355-364.doi:10.1016/j.biosystemseng.2005.08.002, 2005. Zhao, Y., Pan, Y., Rutherford, J. and Mitloehner, F. M.: Estimation of the interference in Multi-Gas measurements usinginfrared photoacoustic analyzers, Atmosphere (Basel)., 3(2), 246-265, doi:10.3390/atmos3020246, 2012. Atmos. Meas. Tech. Discuss., https://doi.org/10.5194/amt-2018-377Manuscript under review for journal Atmos. Meas. Tech.Discussion started: 29 November 2018C Author(s) 2018. CC BY 4.0 License. Oo Discussions Zhu, X., Burger,M., Doane, T. a and Horwath, W. R.: Ammonia oxidation pathways and nitrifier denitrification are significantsources of N2O and NO under low oxygen availability, Pnas, 110(16),6328-6333, doi:10.1073/pnas.1219993110/-/DCSupplemental.www.pnas.org/cgi/doi/10.1073/pnas.1219993110, 2013. Zong, C., Feng, Y., Zhang, G. and Hansen, M. J.: Effects of different air inlets on indoor air quality and ammonia emission 5 from two experimental fattening pig rooms with partial pit ventilation system- Summer condition, Biosyst. Eng., 122, 163-173, doi:10.1016/j.biosystemseng.2014.04.005,2014. Tables Table 1. Specifications of tested particulate filters with abbreviations. Filter material Pore size (um) Thickness (mm) Diameter (mm) Porosity (%) Filter code PTFEI 0.2 0.08 25 74 PTFE 0.2 PTFE 0.5 0.08 25 78 PTFE 0.5 PTFEI 1.0 0.08 25 79 PTFE 1.0 PTFEI 3.0 0.08 25 83 PTFE 3.0 PTFE 5.0 0.08 25 - PTFE 5.0 Glass fiber 0.6 0.21 25 一 GA 55 Glass fiber 0.4 0.56 25 - GB140 Glass fiber 0.8 0.74 25 - GA200 Quartz fiber - 0.38 25 QR100 Polytetrafluoroethylene Table 2. Limit of detection and limit of quantification from a one-hour stable measurements on zero air. N Mean SD LOD (3 x SD) LOQ (10xSD) H20[%] 2065 0.082 0.0019 0.006 0.019 NH3 [ppb] 2065 0.636 0.115 0.345 1.151 Atmos. Meas. Tech. Discuss., https://doi.org/10.5194/amt-2018-377Manuscript under review for journal Atmos. Meas. Tech.Discussion started: 29 November 2018C Author(s) 2018. CC BY 4.0 License. Figures 5 Figure 1. (a) Calibration curve of CRDS from 0.20 to 16.8 ppm NH3 conducted under laboratory conditions; (b) Calibration curvelimited to 0 to 2 ppm. Symbols represent measured values, error bars the standard deviation, and the line is the fitted regressionmodel. Figure 2. (a) CRDS measurements during laboratory testing of the response to a step change in NH3 to (a) 1.02 ppm with rise time(0% to 95% response)=13 s and fall time (100% to 5% response)=19 s; (b) 10.01 ppm with rise time =8 s and fall time=14 s. The10 red lines and areas represent the NH3 standard gas concentration with 10% accuracy. Atmos. Meas. Tech. Discuss., https://doi.org/10.5194/amt-2018-377Manuscript under review for journal Atmos. Meas. Tech.Discussion started: 29 November 2018C Author(s) 2018. CC BY 4.0 License. Discussions Figure 3. The response to a step change in NH3 at (a) 0.203 ppm and (b) 10.01 ppm with and without external inlet filters duringlaboratory testing. The red line and area represent the NH3 standard gas concentration with with 10% accuracy. See the legendabbreviations in Table 1. Figure 4. CRDS signals of NH3 (ppb) in zero air at different concentrations of water vapor, ranging from 6 to 99 % relative humidity(RH) at 22°C under laboratory conditions. Symbols represent measured values and the line is the fitted linear regression model. Atmos. Meas. Tech. Discuss., https://doi.org/10.5194/amt-2018-377Manuscript under review for journal Atmos. Meas. Tech.Discussion started: 29 November 2018C Author(s) 2018. CC BY 4.0 License. Oo Discussions CH [ppm] Figure 5. CRDS signals of NH3 in zero air response to various concentrations of (a) CO2 (480-5848 ppm) and (b) CH4 (2.42-350ppm) under laboratory conditions. Symbols represent measured values and vertical and horizontal bars the standard deviation ofthe measurements. Oo Discussions 1.5 (a) a1工Z 0.5 0 1000 2000 3000 1-Butanol [ppb] H20[%] 1-Propanol interference ar 1.53)1 00.500 500 1000 15002-Propanol [ppb] 1000 Acetaldehyde [ppb] 1d)e0.5工00 500 1000Acetaldehyde [ppb] Acetic Acid interference6 1.5 e 1 工0.5 0 0 1000 2000 Acetic Acid [ppb] AtmosphericOo Discussions Acetone interference H20[%] Propionic Acid [ppb] Atmos. Meas. Tech. Discuss., https://doi.org/10.5194/amt-2018-377 Manuscript under review for journal Atmos. Meas. Tech. EGU Oo Discussions Figure 6. Interference of different organic compounds. Panels with subscript 1 show the CRDS signal to the compound. Panels withsubscript 2 show CRDS signal to the absolute water content. Panels with subscript 3 show absolute water content and theconcentration of the compound. The compounds are (a) 1-butanol; (b) 1-propanol; (c) 2-propanol; (d) acetaldehyde; (e) acetic acid;(f) acetone; (g) butanoic acid; (h) ethanol; (i) methanol; (j) propanoic acid. 5 NH, calibration standard [ppm] Figure 7. Calibration curve of CRDS from 0.27 to 20.04 ppm NH3 conducted under field conditions. Symbols represent measuredvalues and the line is the fitted linear regression model. Atmos. Meas. Tech. Discuss., https://doi.org/10.5194/amt-2018-377Manuscript under review for journal Atmos. Meas. Tech.Discussion started: 29 November 2018C Author(s) 2018. CC BY 4.0License. O Discussions Figure 8. Calibration of the NH3 sampling and measurement system and associated response times of CRDS during field-testing.Introduction of 7.8 ppm NH3 gas was at (a) SP1;(b) SP2; (c) SP4 and (d) SP5 while monitoring the NH3 concentration at the outletport connected to the analyzer.SP denotes sampling point.The rise times were 16 s, 6 s, 13 s, and 25s, for SP1, SP2, SP3 and SP5,respectively. The reed line and area represent the NH3 standard concentration with uncertainty. Figure 9. Levels of NH3 concentration in the 2-week old external particulate filters (PTFE, 0.20 um pore size) measured by the CRDSin the laboratory. Filters collected from the field were installed before each sampling port.SP denotes sampling point. Atmos. Meas. Tech. Discuss., https://doi.org/10.5194/amt-2018-377Manuscript under review for journal Atmos. Meas. Tech.Discussion started: 29 November 2018 AtmosphericOo Discussions Appendix A Table A1. Measured concentrations of NH3, COz and CH4 in laboratory zero air (n = number of data points; CV= coefficient ofvariation). Gas Concentration Mean CV (%) Range (min-max) Measurement duration (h) NH3 ppb 1 43 0.1-5.5 19 CO2 ppm 480 5 460-545 19 CH4 ppm 2.4 10 1.7-3.2 19 5 Table A2. This Rise (0% to 95% response time) and fall (100% to 5% response time) times (S) of the CRDS analyzer formeasurements of NH3 concentrations (0.203 and 10.01 ppm) with or without external inlet particulate filters during laboratorytesting. For filters detail, see Table 1. Filter code 0.203 ppm NH3 10.01 ppm NH3 Rise (s) Fall(s) Rise (s) Fall(s) No filter 30 55 8 14 PTFE 0.2 15 50 10 17 PTFE 0.5 25 50 18 13 PTFE 1.0 35 50 8 13 PTFE 3.0 35 50 15 4 PTFE 5.0 40 45 27 13 GA 55 50 45 13 11 GB 140 65 50 9 16 GA 200 55 50 18 6 QR 100 30 70 13 13 Min 15 45 8 4 Max 65 70 27 17 Mean 38 52 14 12 Interference of different organic compounds. Panels with subscript 1 show the CRDS signal to the compound. Panels with subscript 2 show CRDS signal to the absolute water content. Panels with subscript 3 show absolute water content and the concentration of the compound. The compounds are (a) 1-butanol; (b) 1-propanol; (c) 2-propanol; (d) acetaldehyde; (e) acetic acid; (f) acetone; (g) butanoic acid; (h) ethanol; (i) methanol; (j) propanoic acid.
关闭-
1/20
-
2/20
还剩18页未读,是否继续阅读?
继续免费阅读全文产品配置单
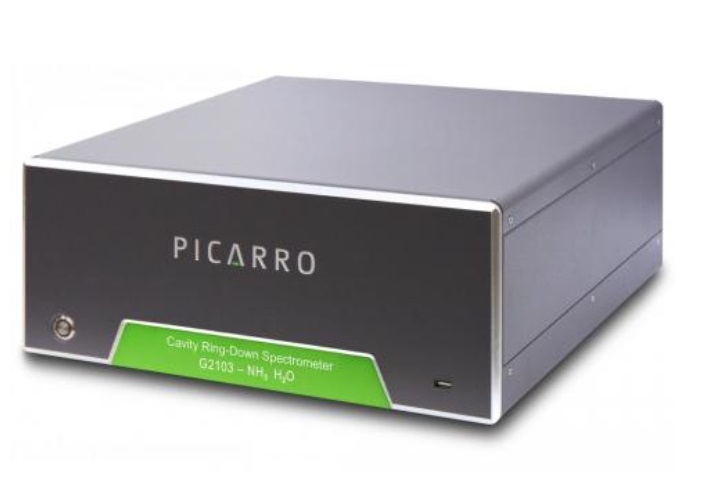
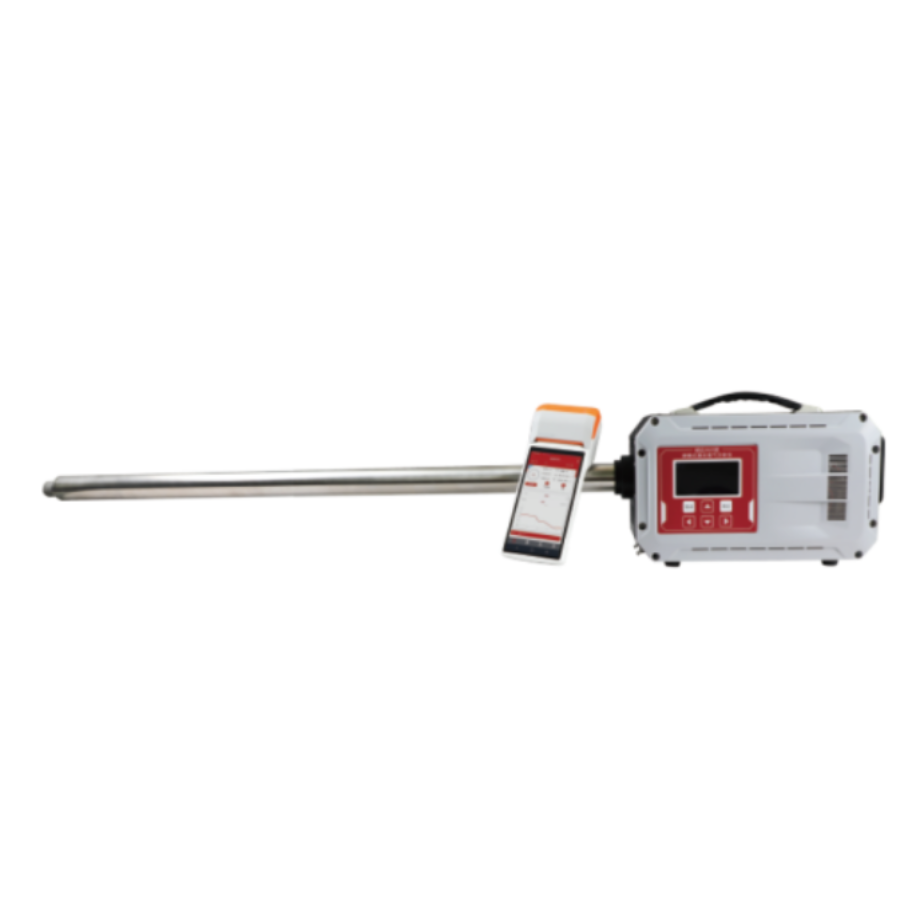
北京世纪朝阳科技发展有限公司为您提供《空气中氨气体检测方案(氨气分析仪)》,该方案主要用于空气中分子态无机污染物检测,参考标准《暂无》,《空气中氨气体检测方案(氨气分析仪)》用到的仪器有Picarro G2103 超高精度氨气(NH3)气体浓度分析仪。
我要纠错
推荐专场
相关方案
 咨询
咨询