

方案详情文
智能文字提取功能测试中
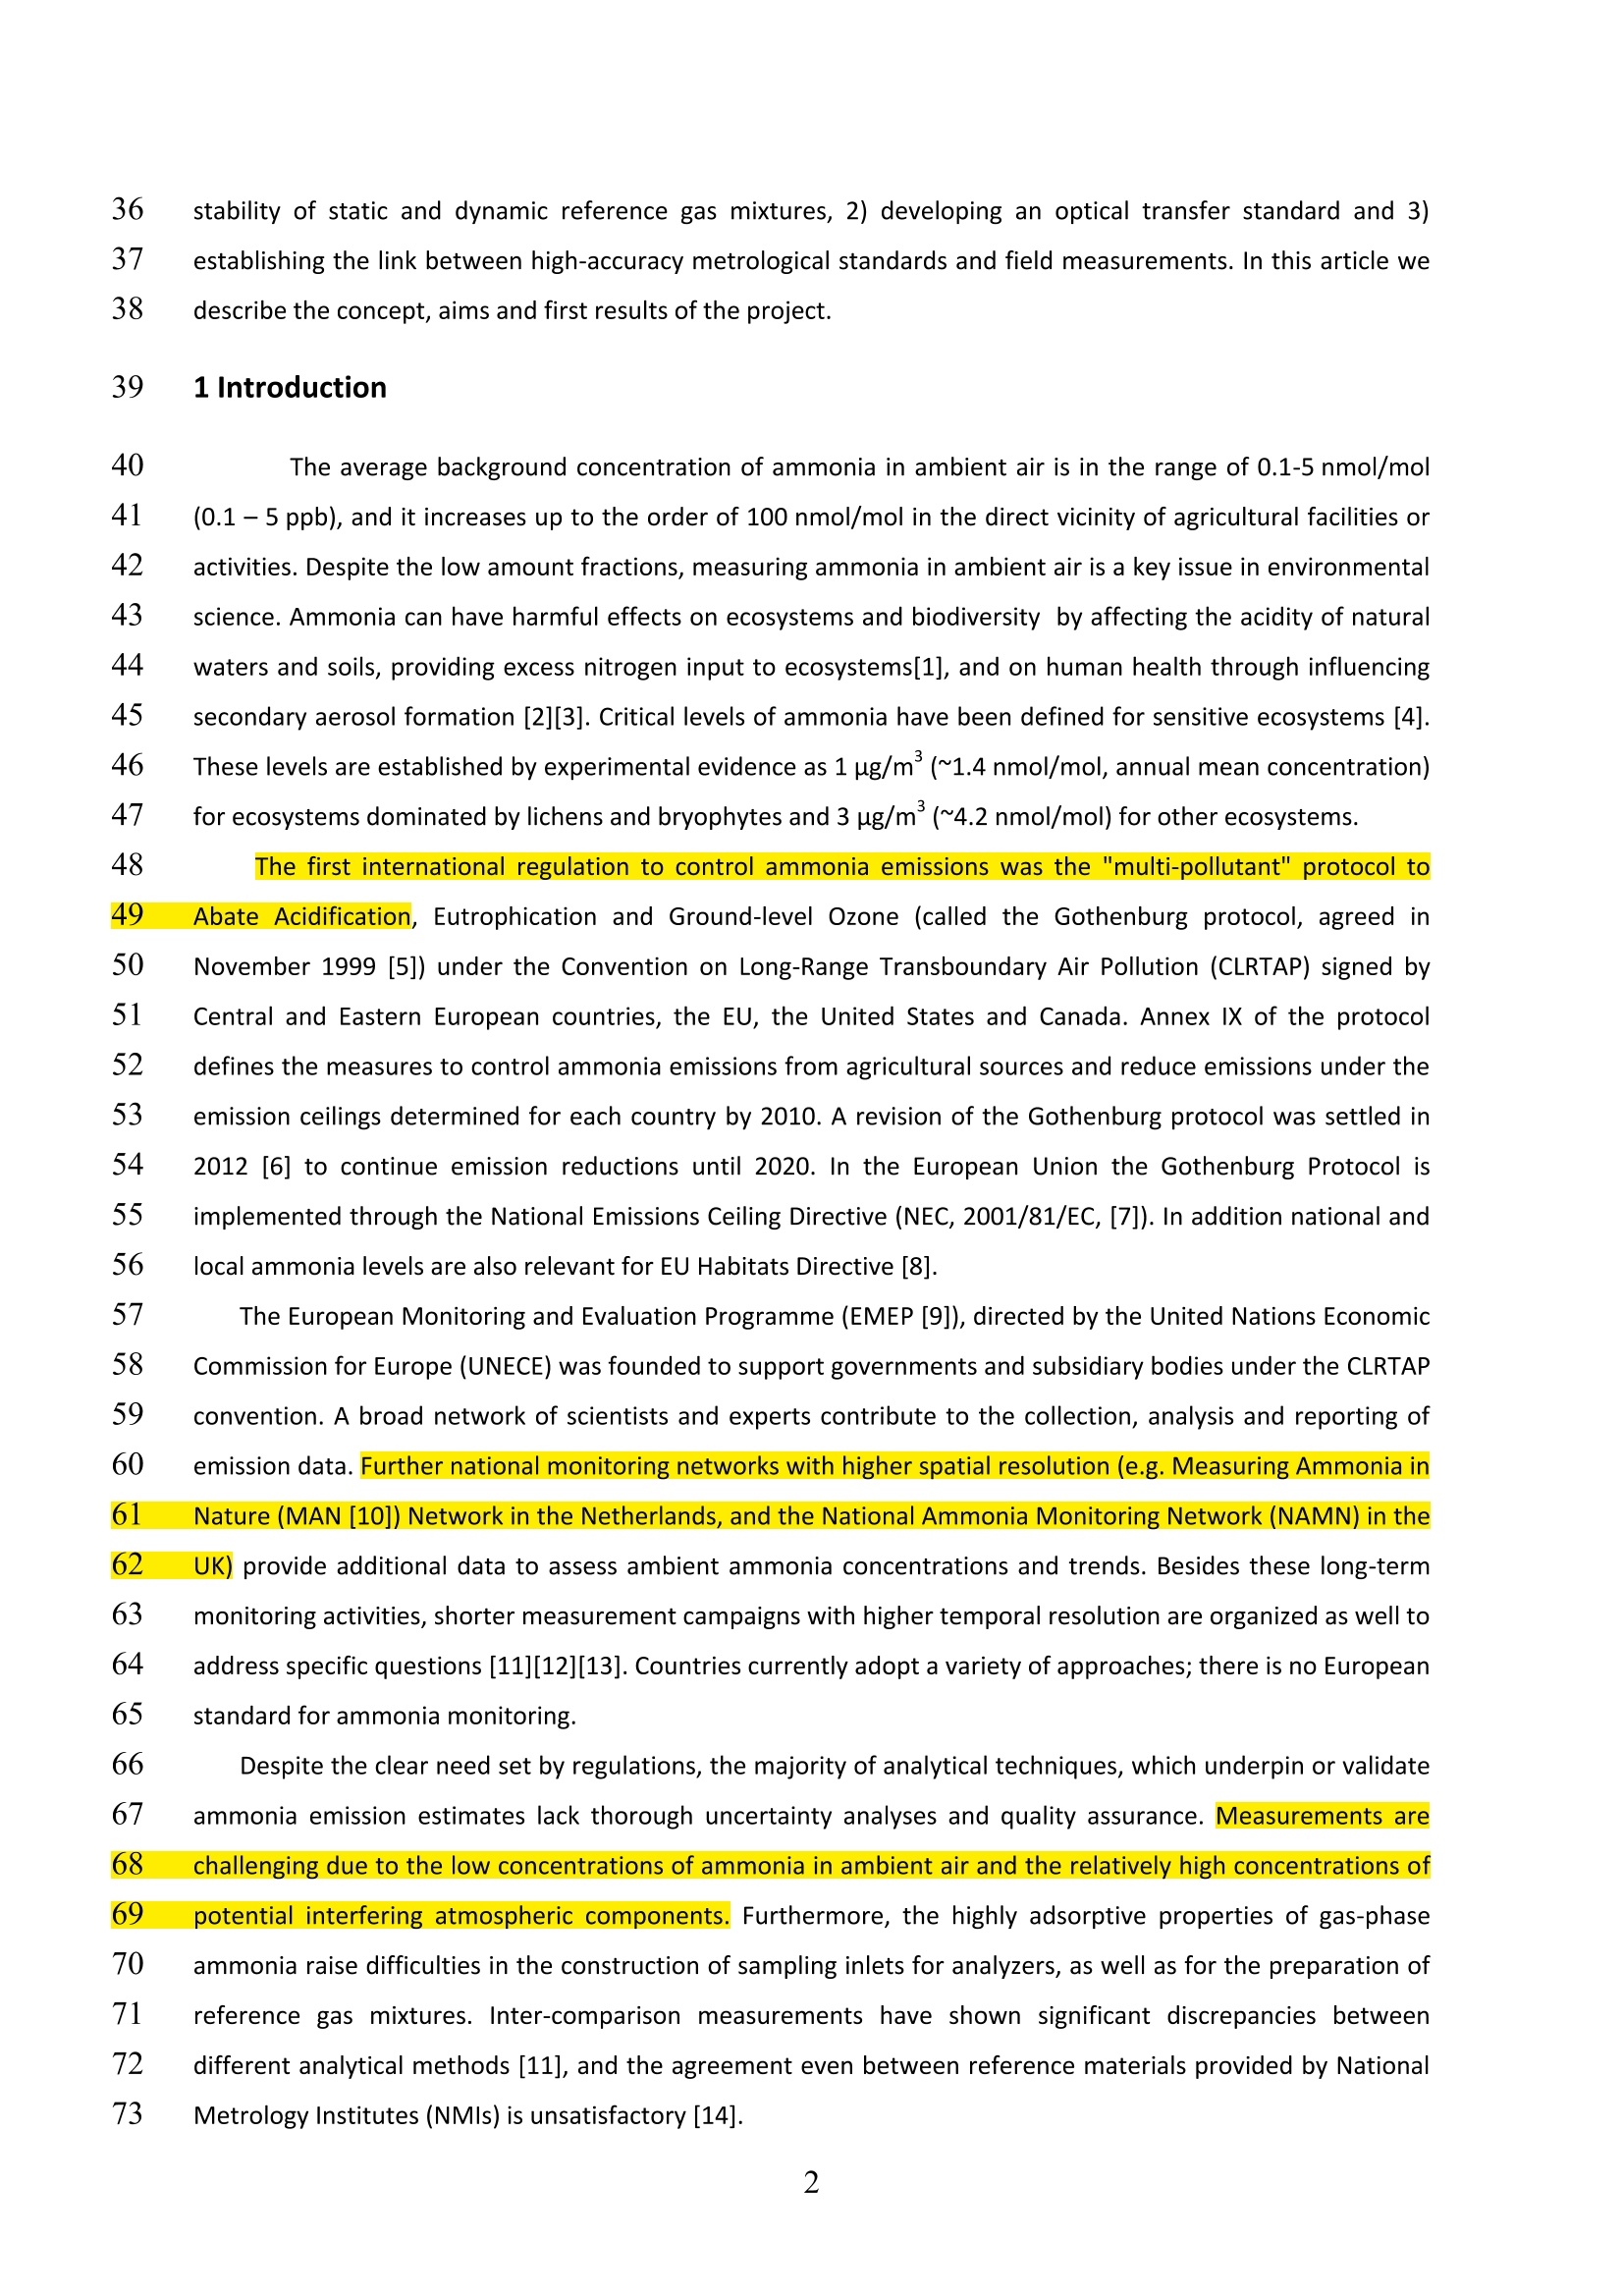
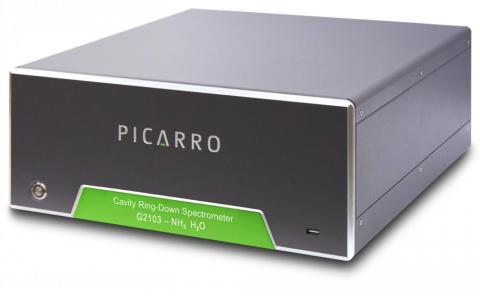
458 542 A metrological approach to improve accuracy and reliability of ammonia2 measurements in ambient air 3 Andrea Pogány', David Balslev-Harder, Christine F. Braban, Nathan Cassidy, Volker Ebert , Valerio Ferracci, 4 Tuomas Hieta, Daiana Leuenberger, Nicholas A. Martin", Celine Pascale, Jari Peltola, Stefan Persijn, Carlo 5 Tiebe, Marsailidh M. Twigg, Olavi Vaittinen,Janneke van Wijk, Klaus Wirtz, Bernhard Niederhauser° 6 7 ‘Physikalisch-Technische Bundesanstalt (PTB), Bundesallee 100, 38116 Braunschweig, Germany 8 ‘Dansk Fundamental Metrologi A/S (DFM), Matematiktorvet 307, DK-2800 Kgs. Lyngby, Denmark 9 Natural Environment Research Council, Centre for Ecology & Hydrology (NERC), EH26 0QB, Bush Estate, 10 Penicuik, Midlothian, United Kingdom 11 “National Physical Laboratory (NPL), TW11 OLW, Teddington, Middlesex, United Kingdom 12 VTT Technical Research Centre of Finland Ltd, Centre for Metrology (VTT), P.O. Box 1000, FI-02044 VTT, Finland 13 °Federal Institute of Metrology (METAS), Lindenweg 50, 3003 Bern-Wabern,Switzerland 14 'Dutch Metrology Institute (VSL), Thijsseweg 11, 2629 JA Delft, The Netherlands 15 BAM Federal Institute for Materials Research and Testing, Unter den Eichen 87, 12205 Berlin, Germany 16 University of Helsinki, Department of Chemistry, A.l. Virtasen aukio 1, P.O. Box 55, 00014, Helsinki, Finland 17 Umweltbundesamt (UBA), Worlitzer Platz 1, 06844 Dessau-RoBlau, Germany 18 currently at: Centre for Atmospheric Science, Department of Chemistry, University ofCambridge, Cambridge CB2 19 1EW, United Kingdom **c-urrently at: Gasera Ltd. (Helsinki Office), A. I. Virtasen aukio 1, FIN-00560 Helsinki, Finland 22 Keywords 23 ammonia in ambient air, traceability, reference gas standards, optical transfer standard, validation and testing 24 infrastructure 25 Abstract The environmental impacts of ammonia (NH3) in ambient air have become more evident in the recent decades, leading to intensifying research in this field. A number of novel analytical techniques and monitoring 28 instruments have been developed, and the quality and availability of reference gas mixtures used for the 29 calibration of measuring instruments has also increased significantly. However, recent inter-comparison 30 measurements show significant discrepancies, indicating that the majority of the newly developed devices and 31 reference materials require further thorough validation.There is a clear need for more intensive metrological 32 research focusing on quality assurance, intercomparability and validations. MetNH3 (Metrology for ammonia in 33 ambient air) is a three-year project within the framework of the European Metrology Research Programme 34 (EMRP), which aims to bring metrological traceability to ambient ammonia measurements in the 0.5- 35 500 nmol/mol amount fraction range. This is addressed by working in three areas: 1) improving accuracy and stability of static and dynamic reference gas mixtures, 2) developing an optical transfer standard and 3establishing the link between high-accuracy metrological standards and field measurements. In this article wedescribe the concept, aims and first results of the project. 1 Introduction The average background concentration of ammonia in ambient air is in the range of 0.1-5 nmol/mol(0.1-5 ppb), and it increases up to the order of 100 nmol/mol in the direct vicinity of agricultural facilities oractivities. Despite the low amount fractions, measuring ammonia in ambient air is a key issue in environmentalscience. Ammonia can have harmful effects on ecosystems and biodiversity by affecting the acidity of naturalwaters and soils, providing excess nitrogen input to ecosystems[1], and on human health through influencingsecondary aerosol formation [2][3]. Critical levels of ammonia have been defined for sensitive ecosystems [4].These levels are established by experimental evidence as 1 ug/m³(~1.4 nmol/mol, annual mean concentration)for ecosystems dominated by lichens and bryophytes and 3 ug/m(~4.2 nmol/mol) for other ecosystems. The first international regulation to control ammonia emissions was the "multi-pollutant"protocol toAbate Acidification, Eutrophication and Ground-level Ozone (called the Gothenburg protocol, agreed irNovember 1999 [5]) under the Convention on Long-Range Transboundary Air Pollution (CLRTAP) signed byCentral and Eastern European countries, the EU, the United States and Canada. Annex IX of the protocoldefines the measures to control ammonia emissions from agricultural sources and reduce emissions under theemission ceilings determined for each country by 2010. A revision of the Gothenburg protocol was settled in2012[6] to continue emission reductions until 2020. In the European Union the Gothenburg Protocol isimplemented through the National Emissions Ceiling Directive (NEC, 2001/81/EC,[7]). In addition national andlocal ammonia levels are also relevant for EU Habitats Directive [8]. The European Monitoring and Evaluation Programme (EMEP[9]), directed by the United Nations EconomicCommission for Europe (UNECE) was founded to support governments and subsidiary bodies under the CLRTAPconvention. A broad network of scientists and experts contribute to the collection, analysis and reporting ofemission data. Further national monitoring networks with higher spatial resolution (e.g. Measuring Ammonia inNature (MAN [10]) Network in the Netherlands, and the National Ammonia Monitoring Network (NAMN) in theUK)) provide additional data to assess ambient ammonia concentrations and trends. Besides these long-termmonitoring activities, shorter measurement campaigns with higher temporal resolution are organized as well toaddress specific questions [11][12][13]. Countries currently adopt a variety of approaches; there is no Europeanstandard for ammonia monitoring. Despite the clear need set by regulations, the majority of analytical techniques, which underpin or validateammonia emission estimates lack thorough uncertainty analyses and quality assurance. NMeasurements arechallenging due to the low concentrations of ammonia in ambient air and the relatively high concentrations ofpotential interfering atmospheric components.Furthermore, the highly adsorptive properties of gas-phaseammonia raise difficulties in the construction of sampling inlets for analyzers, as well as for the preparation ofreference gas mixtures. Inter-comparison measurements have shown significant discrepancies betweendifferent analytical methods [11], and the agreement even between reference materials provided by National Metrology Institutes (NMIs) is unsatisfactory [14]. MetNH3[15] (Metrology for ammonia in ambient air) is a three-year project that started in June 2014 within the framework of the European Metrology Research Programme (EMRP). The project aims to improvecomparability and reliability of ambient ammonia measurements via the development of metrologicalstandards. These standards include both reference gas mixtures and standard analytical methods with the aimof providing traceable ammonia amount fractions in the environmentally relevant range of 0 - 500 nmol/mol.Traceability is a property of the measurement results (in this case the ammonia amount fractions), meaningthat the results can be related to the primary metrological standards (in the end to the definition of the SIunits) through an unbroken chain of calibrations. This chain of calibrations, linking the measurement results tothe highest metrological standards, ensures their reliability. Furthermore, within the chain of calibrations, themeasurement uncertainty introduced by each step is carefully determined, in compliance with the guidelines ofthe ISO-Guide 98-3“Evaluation of Measurement Data - Guide to the Expression of Uncertainty inMeasurement"(GUM) [16]. These well-defined uncertainties and the uniform uncertainty assessment ensurecomparability of measurement results originating from different sources. In this article we first give an overview on the topics studied in the MetNH3 project (Section 2), thereafterwe show selected results in two fields: studying adsorption losses in static and dynamic systemss (Section 3.1),and achieving traceability in the spectroscopic detection of ammonia (Section 3.2). Parts of this work have been presented at the International Congress of Metrology (CIM 2015, heldbetween 21 and 25 September 2015 in Paris, France) [17]. 2 Topics studied in the MetNH3 project This section describes the main topics studied in the MetNH3 project. The first topic is the preparation ofreference gas mixtures with the aim of achieving traceability and reducing uncertainties in both static referencegas mixtures prepared in cylinders (Section 2.1) and reference gases provided by dynamic generators (Section2.2). The second topic deals with optical measurement methods (Section 2.3)with the aim of developing anoptical transfer standard, i.e., a spectrometer that is suitable for the calibration and validation of otherinstruments.A commercial extractive spectrometer and a self-developed sampling-free spectrometer areexamined within the project from a metrological point of view and their applicability as optical transferstandards is evaluated. Selected reference gas mixture(s) and optical transfer standard(s) will be used for thethirdmain objective, the dissemination of the results to field measurement techniques through inter-comparison and validation experiments.Two test facilities are described in Section 2.4, which will serve as theinfrastructure for these experiments. A further important point, the study of adsorption of ammonia ondifferent material surfaces (Section 2.5) plays a role in all afore mentioned activities. ( T he project partners a r e involved in the different topics as follows (see explanation of the abbreviations in the affiliations): V S L,NPL, METAS, BAM and U H a r e d e veloping t h e r e ference gas mixtures a n d performing adsorption studies, PTB, DF M , MIKES-VTT and NERC a re working on the standard optical methods for ammonia detection, the t wo test facilities are being developed a t U B A and NPL and all part n ers are involved in th e dissemination of the results to field measurements. ) 2.1. Static reference gas mixtures in cylinders 111 Ammonia reference gas mixtures with amount fractions down to a few umol/mol can be produced 112 following the approach for gravimetric preparation of gas mixtures (as detailed in ISO 6142 [18]). Although this 113 amount fraction range is at least two orders of magnitude higher than typical ambient values,these mixturesoffer a simple and widely used tool for the calibration of analytical instrumentation when combined with anappropriate dilution system. Figure 1 shows an experimental set-up,which allows calibration over a range of 116 ammonia amount fractions of typically one to two orders of magnitude, depending on the flow rates of the 117 reference gas mixture and the diluting matrix gas. 118 Figure 1: Typical set-up for the calibration of an analytical instrument using a gas mixture in a cylinder, and usual uncertainty components. 123 124 125 CY: gas cylinder containing the reference gas mixture, PR: pressure regulator, GH: gas handling tubes, MG:ammonia-free matrix gas used to dilute the mixture, FC1 and FC2: flow control units, Al: analytical instrumentto be calibrated. u: uncertainty in the ammonia amount fraction in the gas mixture,ufelandu fc22:uncertainty in the gas flow rates set by the flow control units,u: uncertainty added by the presence ofammonia impurities in the matrix gas; and uncertainties caused by adsorption-desorption processes u: inthe cylinder, u: in the pressure regulator, u and u?: in the flow control units, u: in the gas handlingtubes and u: in the analytical instrument. Typical uncertainties of ammonia amount fractions in commercial reference gas mixtures are 5-10 %,whilecertified reference gas mixtures provided by national metrology institutes ((NMIs) often achieve an130 uncertainty (expanded uncertainty, k = 2, referring to 95 % confidence level) down to 1 %. The stability of thegas mixtures is usually guaranteed by the manufacturer for 12-24 months.. These uncertainties are appropriatefor certain applications;Fhowever, uncertainties added by the user while diluting the mixture are not negligible133 and must be accounted for.Uncertainties added by the accuracy of the flow control units (e.g. mass flow134 controllers or critical orifices) are typically in the range of 1 %, provided that the flow control units are regularly135 calibrated.d.Ammonia impurities in most matrix gases are in the sub-nmol/mol range. As an example the136 ammonia impurity in the matrix gas used in our experiments was found to be 0.05 ±0.05 nmol/mol. This value137 is negligible, when preparing mixtures in the amount fraction range above 20 nmol/mol, but might be the138 dominant uncertainty component at lower amount fractions. For comparison, this matrix gas impurity has arelative contribution off22% to the final NHs amount fraction uncertainty, when diluting a mixture of14810 umol/mol NHg in N2 to 20 nmol/mol (assuming 1 % relative uncertainty of the NHs amount fraction in the cylinder,and 1 % relative uncertainty of the flow rates), and a relative contribution around 90 % when dilutingthe same mixture to 1 nmol/mol. Artefacts introduced by the adsorption-desorption processes on the surfacesof the pressure reducer, sampling lines, flow control units and the analytical instrument itself have to beconsideredand minimizedas well., The magnitude of this effect is highly dependent on the experimentalconditions; in the case of a properly designed gas handling system this uncertainty component is negligible,while even a short tubing or device constructed of an adsorbing material might lead to losses up to 30 %. 1411421-143144145146147148149150151152153154155156157158159160161162163164165166167168 An alternative to reference gas mixtures in cylinders is offered bydynamic reference gas generators,169 which provide the opportunity to prepare reference gas mixtures in the environmentally relevant amount170 fraction ranges (0.5-500 nmol/mol). State of the art commercially available mobile gas mixture generators use171 a methodbased on the specific temperature-dependent permeation of the reference substance through a172 membrane into a flow of purified matrix gas, e.g., nitrogen or air, as described in the ISO 6145-10 standard173 [19]. These devices consist of a temperature controllable permeation chamber, in which a reference substance,174 stored in a permeation device, is placed.jThe substance permeating through the membrane into the carrier gas175 (matrix gas)stream causes a continuous mass loss in the permeation device, which can be quantified176 periodic weighting. By precise measurement of the temperature dependent mass loss over time as well as of177 The efforts of the gas metrology community in the field of gravimetric preparation and certification of gasmixtures are aptly summarised in the report of the international key comparison CCQM-K46 [14]. In thiscomparison exercise, mixtures with nominal amount fraction over the range of 30-50 umol/mol weredistributed to the participating NMIs, who in turn certified these mixtures using their own in-house referencestandards and methods. Whilst a certain level of agreement between the different methods used to certify themixtures could be observed, the overall discrepancies were also obvious.Despite of the fact that the stateduncertainties were typically below 2 %, differences up to 5 % have been found between the results obtained bydifferent methods.This disagreement was attributed to a number of reasons, including the different cylinderpassivation techniques used by the participating NMIs to produce their own reference mixtures, and thedifferent analytical techniques used to perform the analysis. For instance, it was discussed that the dynamicpreparation by permeation and subsequent dilution where a continuous gas flow is maintained over severalhours compared against measurements on gas cylinders done over much shorter periods of time can lead todiscrepancies due to adsorption effects. The lack of consensus amongst NMIs may result in poor instrumentcalibration and would affect the comparability of national measurement networks.The MetNH3 project aimsto achieve uncertainties below 1% in reference gas mixtures prepared at the 10 umol/moland 100 umol/mollevel.Gas mixtures are prepared by different project partners, in cylinders from different manufacturers, withdifferent surface passivation treatments. Besides decanting studies to evaluate adsorption losses, stability ofthe gas mixtures will be monitored during the lifetime of the project. The results obtained so far are presentedin Section 3.1. A further key comparison (CCQM K-117) is also planned and will be organized by VSL and NIST in2016-2017, where individual project partners will participate. 2.2. Dynamic reference gas generators the gas flow, the amount fraction of the analyte added to the carrier gas can be calculated. If necessary, the obtained gas mixture is further diluted to the required amount fraction range by the application of mass flowcontrollers or critical orifices. Permeation is a widely used approach for the dynamic generation of gas mixtures of different analytes inthe amount fraction range of nmol/mol to umol/mol; devices from several manufacturers are commerciallyavailable [20][21][22][23] and used for the calibration of on-line analysers in laboratories and in the field.However, despite of their widespread use triggered by their flexibility, ease of operation and reliability, fromthe metrological point of view, commercially available devices show one significant deficiency: they are notpurpose-built for the generation of reference gas mixtures traceable to Sl-standards. They lack traceabilityforemost in temperature and flow measurements but also in the parameters controlling the permeation rate,i.e., time, mass and pressure which impedes the precise assessment of an uncertainty of the generated gas. Weestimate the typical relative expanded uncertainty of NH3 amount fractions in gas mixtures provided bycommercial permeation generators to be 10-20 %. MetNH3 aims to generate ammonia CRM according to ISO/IEC Guide 99:2007 [24] in ambient NHamount fractions of 0.5-500 nmol/mol with a relative expanded uncertainty below 3 %..TTwo different mobilereference gas generators are developed with the purpose of becoming essential for the calibration of on-siteanalyticalinstrumentation of e.g. national rmonitoring networks.Due to strong demand and to promotetechnical diversity, two portable gas generators are developed within the project. The devices have a differentdesign and comprise of different individual parts unless there is technical superiority of one supplier. Amountfractions as low as 0.5 nmol/mol can only be generated when the base mixture from the permeation chamberis further diluted by at least two additional dilution steps. For this purpose, a commercially availablepermeation oven has been combined with thermal mass flow controllers. The NH amount fraction in the generated mixture (XNH3) can be calculated according the followingequation: where PR(T)=Am(T)/At is the permeation rate, i.e., the temperature-dependent mass loss (4m(T)) of thepermeation device per unit time (4t), K=V/M , is et his the ratio of the molar volume of gas (VM) and themolar mass of ammonia(M), Q1 is the flow rate through the permeation chamber, Di and D2 are thedilution ratios in the two additional dilution steps after the permeation chamber (determined from the flowrates through the mass flow controllers used for the dilution) and Xcc is the residual ammonia amount fractionin the carrier gas (matrix gas). In order to generate traceable ammonia amount fractions, all input parametersneeded for the calculation of the ammonia amount fraction have to be traceable to NMI standards.Thisrequires the accessibility of the temperature sensor in the permeation oven, mass flow and pressurecontrollers and the permeation device for calibration purposes. In order to achieve the ambitious aim ofexpanded uncertainty below 3 %, precision and stability of the individual components have to be assured. Asan example, the individual expanded uncertainties of the two most important parameters, i.e., the permeationrate (PR(T)) and the dilution rates (D1 and D2) must not exceed 1.7% and 0.6%, respectively. The low 214 uncertainty in the permeation rate can be achieved by weighting the permeation device using a magnetic 215 suspension balance where the temperature dependent mass loss per unit time can be monitored continuously 216 and under highly stable conditions. Considerable uncertainty, particularly at lower amount fractions is added 217 by residual NH3 in the carrier gas (approximately 0.05±0.05 nmol/mol). 218 2.3. Spectroscopic detection ofammonia 219 During the construction of a spectrometer the first crucial point is the spectral line selection. Ambient 220 ammonia amount fraction is typically one to seven orders of magnitude lower than amount fractions of other 221 atmospheric components (most importantly water vapour, carbon dioxide, ozone and methane), which results 222 in severe spectral interference and cross sensitivities. Figure 2 gives an overview of the infrared spectrum of 223 ammonia and common atmospheric components (data taken from the HITRAN 2012 database [25]). 224 Wavelength /um 225 Figure 2: Simulated infrared spectrum of a) ammonia and common atmospheric interferers: b) water vapour, c) 226 carbon dioxide, d) ozone and e) methane. The wavelength ranges commonly used for ammonia measurements 227 are marked with grey shading. Normalized line strength refers to the line strengths multiplied by typical 228 ambient concentrations (see legend). Data are taken from the HITRAN 2012 database[25]. Two wavelength ranges (indicated by grey shading in Figure 2) are frequently used for ambient ammoniaanalysis by spectroscopy, both having their advantages and disadvantages. The wavelength range around 1.51-1.54 um (6500-6600 cm)has been accessible over a decade using inexpensive, robust diode lasers producedfor dense wavelength division multiplexing (DWDM) in the telecommunication industry. However, the rathersmall line strength of the ammonia lines in this range (< 2x10cm/molecule)requires the use of extremelysensitive detection techniques.On the other hand, measurements using the strongest ammonia absorptionlines in the mid-infrared (MIR) range around 9-11 um (900-1100cm") were, and to a certain extent still are,hindered by the limited availability of light sources,, ddetectors and optical components for this wavelengthrange. Earlier, mainly line tuneable carbon dioxide lasers and lead salt diodes requiring cryogenic cooling wereused in this wavelength range [26], while the rapid development of room temperature quantum cascade lasersmakes measurements in this wavelength range much more feasible nowadays [27]. Besides spectroscopic aspects, another crucialpart is the gas sampling system of the spectrometer.Extractive spectrometers are susceptible to bias and long response times caused by adsorption-desorptionprocesses in the inlet line, and/or in the measurement cell itself. An open path or a sampling-free spectrometerdoes not suffer from such adsorption problems and has the potential to provide significantly shorter responsetimes [27][28]. The MetNH3 project investigates two types of spectrometers, one operating in each of afore mentionedwavelength ranges. Commercial cavity ring-down spectrometers (Model G2103, Picarro Inc.) are being used byseveral project partners and are being characterized from a metrological point of view..These spectrometersuse extractive sampling method, i.e., a gas sample is flown continuously through the measurement cell with~1 slm (standard litre per minute) flow rate..sSpectroscopic detection is performed around 6548 cm using adiode laser light source. Besides, a sampling-free spectrometer is being developed and characterized in theproject. This spectrometer is based on an open multi-pass cell, where ambient air flows freely between the twomirrors, and uses a quantum cascade laser light source operating around 1103.5 cm To overcome the problem of limited accuracy and availability of calibration standards (as described inSections 2.1. and 2.2.), many spectrometers target absolute amount fraction measurements based on the Beer-Lambert law [27][29][30][31], however, only a few of them are thoroughly characterized and validated from ametrological point of view [31]. Our recent studies show that absolute spectroscopic measurement techniques(direct tuneable diode laser absorption spectroscopy (dTDLAS) [30][31], quantum cascade laser absorptionspectroscopy (QCLAS) orr ccavity ring-down spectroscopy (CRDS)) have the potential to achieve traceability inspectroscopic amount fraction measurements without the need for regular calibration with gas standards.s.(Ofcourse, validation , e.g., against a well characterized, traceable reference gas mixture is still necessary[31].Absolute determination of the ammonia amount fraction (xwn) is based on the Beer-Lambert law according to the following equation: for dTDLAS and QCLAS. Traceability of the input parameters pressure (p) and temperature (T) of the gas sampleand optical path length of the cell (L) have already been achieved [30]. The Boltzmann-constant (ke) is knownwith very high accuracy. The isotopic ratio (represented by the correction factor riso) of gas samples originatingfrom natural sources can be estimated with sufficient accuracy based on natural abundances [32]. Usually theline intensity of the probed transition (Sr) and the integrated absorption coefficient (Cint) or integratedabsorbance (Aint) are the most challenging parameters. The quality of available spectral line data in literature is often not satisfactory, and frequently the limiting factor in absolute spectroscopic amount fraction measurements.As an example, until 2012 the HITRANdatabase [25], the most frequently used spectroscopic database in atmospheric science, did not contain anydata of ammonia for wavelengths below 2 um, and even in the latest edition of the database, uncertainties ofthe ammonia absorption line intensities are typically as high as 5-20 %. More detailed studies of individual,application-specifically selected absorption lines (e.g. in [33]) provide only slightly lower uncertainties for a verylimited number of absorption lines.i. There is a clear need for more accurate and traceable spectral line dataThis problem will be addressed in the MetNH3 project. A recent project showed that traceable measurement ofspectral line data of different analytes can be achieved, providing also considerably lower uncertainties thancurrently existing spectral databases [34]. Recently, a robust and flexible method has been developed toachieve traceable line intensities using tuneable diode laser absorption spectroscopy. The measurements areperformed in pure gases to reduce uncertainty in the analyte amount fraction, and at low pressures (below10 hPa) to decrease pressure broadening and ensure good separation of the absorption lines. Distributedfeedback diode laser(s) are used as light source to provide high spectral resolution, combined with a single-passgas cell to decrease alignment errors and provide the opportunity to perform measurements within a largewavelength range using the same set-up (limited only by the transmissivity of the cell windows). Applicability ofthe method for the measurement of CO2 and H2O line intensities with expanded uncertainties in the 1-3 %range has already been demonstrated [35][36]. A similar method will be applied to measure line intensities ofthe probed ammonia transitions. Similarly, pressure broadening coefficients have been measured [37] using amethod which can also be applied for ammonia. It is also aimed to achieve traceability of the integratedabsorption coefficient (0int) or integrated absorbance (Aint). To achieve traceability and quantify uncertainties, aspectral fitting algorithm is being developed within the project. Details of this algorithm are given inSection3.2. Based on such absolute, traceable spectroscopic techniques an optical transfer standard can be developed.Instead of regular calibration using gas standards, the individual components of the spectrometer, i.e., whichgive the input parameters of equation (1) and (2), have to be calibrated regularly against traceable references.This is in most cases (e.g. the calibration of pressure and temperature sensors) easier, provides longer stabilityand can be performed with higher accuracy than calibration of a complete spectrometer using gas standards.We note that validation using traceable reference gas mixtures is still necessary to ensure that no unrevealedsources of bias are present, but is not required as often as calibration in the case of non-absolute measurement methods.Furthermore, validation of an absolute analyticalaliinstrument withn a traceable referencegasgenerator provides more confidence in the reliability of both devices .An optical transfer standard offers therefore a third alternative besides gas cylinders with appropriatedilution systems and dynamic reference gas generators to calibrate or validate field instrumentation. Similarlyto mobile reference gas generators, an optical transfer standard serves as an ideal transfer standard forextensive measurement networks, where calibrations with the same standard are preferred. Additionally, if gasmixture generators are not available, an optical transfer standard can be used for calibration with any kind ofgas mixture (even ambient air); the reference ammonia amount fraction is provided by the optical transferstandard. 2.4. Test facilities for inter-comparison measurements To offer a suitable infrastructure for the validation and comparison experiments, two test facilities arebeing developed in the MetNH3 project. These facilities enable the distribution of gas mixtures provided fromgas cylinders or dynamic generators (or even ambient air) to several ammonia monitoring devices (passive oractive samplers or analytical instruments) without changing its composition, as schematically shown inFigure 3. Such test facilities are not necessarily compicated and bulky installations; e.g., in case only a fewdevices are to be compared, the test facility can be a very simple gas manifold made of a few tubes and fittingsNevertheless, in this section we describe two test facilities, which are being developed within the MetNH3project and are designed for larger scale inter-comparison measurements involving different types of gasstandards and analytical instruments. 322 Figure 3: Schematics of an experimental set-up for validation experiments 334 The first facility, the Controlled Atmosphere Test Facility (CATFAC) is an aerodynamic wind tunnelconstructed of borosilicate glass, which is designed to incorporate individual adjustment of parameters such asammonia concentration, relative humidity, air temperature and air speed. Test atmospheres are generated bydynamically blending stable ammonia reference gas mixtures from cylinders with purified air using calibratedmass flow controllers. The test gas is continuously re-circulated and replenished in the facility by a freshlygenerated mixture of the same composition. The total replenishment flow rate is up to 30 slm. Stabilizationtime of the ammonia amount fraction in the chamber depends strongly on the composition of the gas mixture,and is typically in the range of a few hours.. The specified conditions can easily be maintained over timeintervals of a few hours to several weeks. The CATFAC is primarily designed for carrying out exposure tests withsmaller devices,e.g., different types of ammonia samplers, which are placed inside the facility. Additionally,larger devices, e.g., active denuders or extractive spectrometers, can be connected to the facility to sample the 335 gas circulated in the facility. The first test measurements using a CRDS spectrometer [38] and DELTA denuders 336 [39] have already been performed and showed good results..The agreement between calculated and measured 337 ammonia amount fractionswas better than 3% at the 40 nmol/mol level.A photograph of the CATFAC, 338 without its insulation, is shown in Figure 4. 339 Figure 4: Photograph of the Controlled Atmosphere Test Facility (CATFAC) (colour online) The second facility is a proficiency test facility, developed for the characterization of the performance ofextractive analytical instruments. The facility has been used for comparison experiments for common airpollutants like NO, NO2,SO2, CO and O3 [40], and is currently being adapted for experiments with NH3 mixturesunder dry and humid conditions. The facility consists of a glass line with multiple sampling ports for theindividual instruments. The installation operates under ambient temperature and pressure. Complex gasmixtures can be added to the gas line from up to 14 pressurized gas cylinders and a dilution system using massflow controllers. Time-programmed step changes in the concentration of the individual mixtures can beapplied, controlled by an industrial computer. Gas mixtures from cylinders prepared within the MetNH3project, as well as dynamic generators will be fed into the facility. In addition, an ambient air line can be usedto provide air from outside the building to the connected instruments. The proficiency test facility will be usedto test newly developed instruments with respect to potential interference gases, and to select the mostsuitable transfer standard for ambient measurements. 356 357 358 359 360 361 362 363 364 365 366 367 368 Due to the highly adsorptive nature and reactivity of ammonia,adsorption-desorption processes ondifferent material surfaces crucially influence both the preparation of reference materials and the design ofanalytical instruments. Adsorption induces a negative, while desorption a positive bias in the measuredammonia amount fraction.. Adsorption and desorption are opposite andlargely reversible processes[43].Consequently, the results of studies investigating the adsorption on different surfaces can be taken as a goodestimate for desorption as well.The extent of adsorption of ammonia on glass, metal and polymer surfaces isknown to be significantly different [41][42][43],which makes the choice of the gas wetted materials a centralquestion in designing gas handling systems. Metal surfaces adsorb a large amount of ammonia, which can bedecreased by about 50 % by electro-polishing the surface.e. A/ more significant reduction of adsorption can beachieved by adding an inert coating (e.g. SSilcoNert 2000,D,ttrademark of SilcoTek Corporation [44]) on stainlesssteel,anpdolymer surfaces adsorb even less ammonia than coated metal surfaces. An example for the extentof ammonia adsorption on different material surfaces is given in Table 1 and Ref.[41]. 369 370 Table 1. Adsorption of ammonia on some surface materials. The measurement conditions were the following:ammonia amount fraction 425 nmol/mol, gas flow rate1000 cm/min, ni, pressure 176 hPa and temperature 371 295 K (part of the data taken from [41]). Surface material Adsorption of ammonia/10‘2molecule·cm standard deviation (of 3 measurements) /10molecule·cm° Stainless steel 316L 138 21 Electropolished stainless steel 316L 72 11 Dursan (SilcoTek Corp.) 101 5 SilcoNert 1000 (SilcoTek Corp.) 15 1 SilcoNert 2000 (SilcoTek Corp.) 6 1 Teflon-perfluoroalkoxy (Teflon- PFA) 4 n/a 372 373 374 375 376 377 378 379 380 The preferred materials for the inlet lines of analyzers are polymers including Teflon(PTFE), Teflon-perfluoroalkoxy (Teflon-PFA) or polyvinylidene fluoride (PVDF)..Gas cells, valves and flow control units, wherebetter mechanical stability is required, are often made of coated stainless steel or pyrex. Similarly,mostcylinder manufacturers apply internal passivation treatments or coatings on aluminium cylinders to reduceadsorptionlosses. Studies into using an“active passivation method" by entraining functionalizedperfluoroalkane vapour into the inlet sampling stream are also currently under way to reduce the adsorptioneffects in spectroscopic analyzers; these are, however, still in the research phase [45]. Sampling-free analyticalinstruments are most preferred to overcome artefacts caused by adsorption-desorption processes. 381 Humidity of the gas sample has a strong effect on the adsorption processes; however, the nature of this382 dependence still leaves open questions. For instance,the effect of humidity on ammonia adsorption, driven by383 the competitive adsorption between ammonia and water, is unclear.. Vaittinen et al. [41] observed that 384 385 386 387 388 389 390 391 increased water vapour concentration causes a remarkable decrease in adsorption losses of ammonia, whileexperiments performed by Ellis et al. [46] show the opposite. We note that this inconsistency can be explainedby different definitions of "dry samples" in the two publications. It has been observed that ammoniaadsorption in gas samples with water vapour amount fraction below 100 umol/mol is up to a factor of 5 higherthan in the case of slightly elevated water vapour amount fractions (up to a few 1000 umol/mol). At humiditylevels>10000 umol/mol, ammonia losses in the sampling system increase again. This non-monotonicdependence of ammonia adsorption on humidity results in1Tfundamentally different observations inexperiments performed in slightly different humidity ranges. 392 399 Elevated temperatures areknown to decrease adsorption,thus heating the sampling lilines or the393 measurement cell is a common method to prevent condensation and further decrease adsorptionillosses.394 However, in the case of ambient air measurements, there are concerns that elevated temperature: leads to a395 partitioning of aerosol, such as NH NO,, into NH and HNO, in the gas phase, leading to a positive bias in the396 measurements [11]. The use of filters and impactors to remove aerosols from the air stream prior to entering397 theheatedssamplingline is a widespreadmethodto reduce this positivebias,as wellas to prevent398 contamination of the measurement cell. lIn this case it is important that filters are changed regularly to preventreaction of gas phase ammonia with the aerosol phase captured on the filter, or volatilization of the capturedaerosols. 400401 3 Results402 403 404 405 This section presents results obtained during the first year of the MetNH3 project in two fields. In Section3.1 we present results of adsorption studies in gas cylinders and in gas handling lines made of differentmaterials, and with different coatings. Section 3.2describes first results obtained in the spectroscopicdetection of ammonia with the Picarro G2103 spectrometer. 406 3.1. Study ofadsorption losses in static and dynamic set-ups 407 408 409 410 Adsorption of ammonia in material surfaces is an important issue in several parts of the measurementsystem. In this chapter two examples are presented: 1) adsorption on the walls of gas cylinders after differentcylinder passivation treatments, which determines uncertainty in the prepared static gas mixtures and 2)adsorption in gas handling tubes made of different materials, which influences accuracy of dynamic systems. 411 412 413 414 415 416 417 418 419 An initial screening of a range of commercially available passivated gas cylinders was carried out bygravimetrically preparing a number of mixtures of ammonia in nitrogen at 100 and 10 umol/mol. Two mixtureswere prepared per amount fraction per cylinder type, which were then analysed on a non-dispersive infrared(NDIR) spectrometer or on a photoacoustic spectrometer (PAS). These measurements allowed thedetermination of the ammonia response factor for each mixture based on the instrument response and on thegravimetric amount fraction. The ammonia response factor for a mixture prepared in a cylinder that suffersfrom adsorption effects is lower than that of a mixture prepared in a cylinder in which adsorption occurs to asmaller extent: these measurements therefore allowed filtering out unsuitable cylinders that showed evidentammonia adsorption. The two analytical techniques have comparable uncertainties and were only used for relative measurements (comparison of response factors of cylinders), which ensures comparability of theresults obtained by either method. Three cylinder types showed promising results and were subjected to further tests. These included twotypes of passivated aluminium cylinders, which are frequently used for commercial ammonia mixtures (SpectraSealTM; treatment trademark of BOC [47] with 10l internal volume and AculifeM treatment trademark of AirLiquide [48] with 51 internal volume, both filled up to 140 bar). Aculife is the family name of a series ofproprietary cylinder treatments that is utilized to enhance the stability of reactive gas mixtures. We note thatAirLiquide has developed different types of Aculife cylinder treatments that are adopted for differentcomponents and concentration ranges;inparticular, tthhee itreatmentusedinthis study was the onerecommended for ammonia mixtures at the time of measurement, but a more suitable one has since becomeavailable.The third cylinder type was a commercially available stainless steel cylinder with internal surfacescoated with SilcoNert2000 [44] with 3.785 l internal volume and filled up to 120 bar pressure. These three cylinder types underwent a series of decanting tests in order to quantify the extent ofammonia surface adsorption. For each cylinder type, two mixtures were prepared at 100 umol/mol and two at10 umol/mol (except for the SilcoNert2000 cylinders, which were only tested at 10 umol/mol); these werecertified against a dynamic dilution of ammonia mixtures at higher amount fractions using NDIR or PAS prior todecanting. Each parent mixture was then decanted into an evacuated daughter cylinder of the same type; andfollowing the decanting, all parent and daughter mixtures were certified against the dynamic system. The results of the decant tests are shown in Tables 2 and 3. In Table 2, direct comparison of the certifiedammonia amount fractions of the parent mixtures pre-decant and those of the corresponding daughtermixtures provides a measure of the amount of ammonia adsorbed on the cylinder walls. Losses of~0.5 umol/mol on average are observed for Spectra Seal and Aculife cylinders, whereas the same testsperformed on SilcoNert2000-treated cylinders showed indiscernible losses (<0.1 umol/mol). The attribution ofthe ammonia losses observed in Spectra Seal and Aculife cylinders to the transfer line used for the decant at10 umol/mol can be ruled out, as the same line was used for all cylinder types. In the light of the analyticaluncertainty of the measurements (approximately 1% at the k=2 level for both amount fractions), theobserved losses are only significant at the 10 umol/mol level for Spectra Seal and Aculife cylinders. Therefore,at 10 umol/mol, adsorption of ammonia molecules on cylinder walls is minimised when the internal surfaces ofstainless steel cylinders are passivated using SilcoNert2000. In Table 3, direct comparison of the certifiedamount fraction of each parent mixture pre- and post-decant allows the detection of any effects arising from a50 % pressure drop: these are often observed in cylinders where adsorption of reactive or polar species to theinternal walls occurs, as molecules start to desorb from the walls as the pressure is lowered. The observedvariations in the ammonia amount fraction were found to be smaller than the analytical uncertainty of themeasurements in all cases. Stainless steel cylinders with SilcoNert2000 internal coating showed the least adsorption for NH3. However,Spectra Seal and Aculife cylinders have a larger internal volume, can be filled to higher pressures and arecheaper to produce, therefore these would be better suited for field calibration work once they have beenaccurately certified against standards, e.g., in SilcoNert2000 coated cylinders. Table 2: Difference in certified ammonia amount fraction between parent mixtures pre-decant and daughter 459 mixtures NH3 amount fraction change (umol/mol) Spectra Seal Aculife" SilcoNert2000a 100 umol/molmixtures -0.50±1.0 -0.54±1.0 -0.86±1.0 -0.28±1.0 10 umol/molmixtures -0.70±0.10 -0.14±0.10 -0.49±0.10 -0.67±0.10 -0.02±0.10 +0.07±0.10 analyzed by NDIR, analyzed by PAS Table 3: Difference in certified ammonia amount fraction of the parent mixtures pre- and post-decant NH3 amount fraction change (umol/mol) Spectra Seal Aculife'b SilcoNert2000 a 100 umol/molmixtures +0.09±1.00 +0.17±1.00 +0.25±1.00 +0.53±1.00 -- 10 umol/mol mixtures -0.04±0.10 -0.06±0.10 +0.06±0.10 -0.02±0.10 0.00±0.10 +0.06±0.10 analyzed by NDIR,analyzed by PAS In dynamic measurements, four different types of tubing have been tested in our experiments:Teflon-PFA, uncoated electro-polished stainless steel, and electro-polished stainless steel with SilcoNert2000 coating(SilcoTek Ltd. [44]) and Supelco coating (Sigma Aldrich). Some of these materials were also included in thestudy by Vaittinen et al. [41]. As described in the caption of Table 1, the experiments of Vaittinen et al. [41]were performed at 176 hPa pressure. Although the amount of adsorbed molecules is not expected to showsignificant pressure dependence in this pressure regime, we found it reasonable to repeat the measurementsatt aatmospheric pressure,which better represents the conditions of sampling inlets of analyticalinstrumentation, as well as gas handling lines in dynamic generators. Besides, the typically high uncertainties(standard deviation in Table 1 in the range of 5 to 15 %) observed in adsorption measurements justifyrepetition of the experiments to gain more confidence in the results. The experiments followed the procedure published by Vaittinen et al.[41]. The measurement systemconsisted of a gas generator applying the permeation method described in Section 2.2, which was connected toa CRDS analyser (Picarro G 2103)."This set-up was continuously purged with a mixture of 330 nmol/mol NHs ir N2 5.0. Alternatively, the gas stream can be directed to a test tube before reaching the analyzer, via two SilcoNert2000 coated manually-operated 3-way valves. Prior to exposure to the NHs mixture, the test tube was flushed for 60 minutes with ambient air to remove residual adsorbed NH3, which process is facilitated by the humidity. The adsorbed water is thereafter removed by flushing the test tube for 30 minutes with N2 5.0 with water vapour content below 500 nmol/mol. The test tube was then exposed to the NH3mixture. Adsorption on the surface of the test tube causes a sudden drop of NHs measured concentrations, as shown in Figure 5, whereafter NHs concentrations slowly recover; the timing of the recovery strongly depending on the material surface. The amount of adsorbed molecules is determined from the area of the observed dip in the measured NH3 amount fractions. The numbers of adsorbed NH3 molecules per unit surface area have been determineduntil NHs amount fractions have recovered to 99 % of the initial values. The mean values and the relativestandard deviations over 3 measurements of the differenttnmaterials are as follows: PFA:(9.5±5.4)10molecules/cm, SilcoNert2000: (14.2±2.3)10molecules/cm², Supelco:(23.9±7.1)10molecules/cm², sStainlessSSteelelectro-polished: (152.8±6.5)·10molecules/cm.Theexperiments have been carried out at a flow rate of 1500 cm/min,ambient pressure and 293 K temperature.Adsorption in pristine test tubes not previously exposed to ammonia might be higher than the numberspresented here. However,our repeated measurements show that after the first exposure the amount ofadsorbed molecules is reproducible within the experimental uncertainty during each subsequent exposure. The measured numbers of adsorbed molecules per unit surface area were in the same order ofmagnitude as the results presented in Table 1 in Section 2.5 and confirmed the same relations between thethree materials, which were included in both studies (Teflon-PFA, SilcoNert2000, stainless steel). We note thatthe differences of the results of this study from previous results shown in Table 1 are not significant and aremost probably caused by different amount of residual humidity in the used gas mixtures. Teflon-PFA andSilcoNert 2000 coated stainless steel proved to be the best suited materials to reduce adsorption. Despite ofthe slightly higher adsorption, SilcoNert 2000 coated stainless steel tubing was found to be a better choice thanTeflon-PFA polymer tubing, due to its higher mechanical stability and lower porosity and diffusion. Figure 5: Ammonia gas phase concentration as a function of time in an experiment where clean test tubes ofdifferent materials are abruptly exposed to 330 nmol/mol NH in N2. The sudden drop in the signal is due to the adsorption and gas exchange occurring in the tube. The results displayed are the averages over 3 identicalexperiments. 3.2. Towards traceability in the spectroscopic detection of ambient ammonia Traceability of ammonia amount fractions measured by a commercial1Picarro G2103 spectrometerr isaddressed by the development of a novel data evaluation algorithm, which takes into account all revealedsources of bias.Special emphasis is put on determining uncertainties in the individual input parameters,aiming to give a reliable uncertainty figure for the final ammonia amount fraction as well. Figure 6 shows a typical spectrum measured by the Picarro spectrometer in a gas mixture of 100 nmol/molNH and 2 % H20 in nitrogen. The black symbols indicate the 36 wavenumbers within a spectral window of0.7 cm, where ring-down time measurements are carried out by the spectrometer.The number ofmeasurement points is limited by the free spectral range of the cavity and cannot be increased withoutsignificant technical efforts to vary the cavity length during the measurement. The internal evaluation algorithm of the spectrometer uses a complex spectral fitting algorithm todetermine the peak height of the ammonia absorption lines. Ammonia amount fraction is calculated from theobtained peak heights. Similarly,, hheights of the water vapour peaks are determined and used for thecalculation of water vapour amount fractions, which is necessary for the correction of cross-sensitivitiesoriginating from the overlapping absorption lines. We note that details of the fitting and data evaluationalgorithm are (as in case of most commercial instruments) not fully revealed to the spectrometer user. jToverify correctness of this data evaluation algorithm, an own algorithm is being developed within the MetNH3project to process the raw spectra.. This involves a multi-line fitting algorithm based on our previous works[49][50], where ammonia amount fraction is calculated from the integrated absorption coefficient (Clint) ofthe ammonia lines using the Beer-Lambert law (equation (2)). The fitting algorithm take.; intoaccount six Nlines, eight Hz0 lines and two COz lines, which have influence on the spectrum measured in this spectralwindow. Other common atmospheric components, e.g., CH4 or O3 have no measurable absorption lines in thiswavelength range and are therefore not included in the fitting algorithm. Even the spectral influence of thecolines has been found to be minor (less than 5·10 relative change in the measured NHs amount fractionper umol/mol change in the absolute CO2 amount fraction). Figure 6a and b show the fitted lines andresiduals in a gas mixture containing 100 nmol/mol NH3 and 2% H20. The uncertainty in the integrated absorption coefficient (Cint) has been found to be in the 0.5-9% range,depending on the NH3 and H20 amount fractions. This uncertainty is dominated by three main effects: 1) theuncertainty in the measured ring-downtimes, 2) the limited number of measurement wavenumbers acrossthe absorption lines and 3) the complexity of the measured absorption spectra. Besides, uncertainty of theline intensity (Sr) is significant.Currently we use literature values, which have an absolute accuracy of 10 %.However, line intensity measurements, which will reduce the expanded uncertainty of So below 3 % (k=2)are in progress, and first results are presented in [51].The uncertainty contributions of the pressure,temperature andisotopic composition of the gas sample are negligible, provided that the sensors areregularly calibrated against a traceable reference andl samples with naturall isotopic composition aremeasured. a) 543 6548.6 6548.8 6549.0 6549.2 544 Wavenumber/cm° 545 546 Figure 6: Measured raw data points with the fitted spectrum (a) and residuals (b) in 100 nmol/mol NH3 and 2 %H2O in N2. The measurements were performed using a Picarro G2103 spectrometer.(colour online) 547 Two phenomena have been observed so far, where a newly developed data evaluation algorithm might 548 excel over the data evaluation algorithm provided by the spectrometer manufacturer. As shown in Figure 6, the549 probed NHg absorption lines strongly overlap with H20 absorption lines. Spectral interference is expected due550 to two reasons: a) direct spectral overlap of absorption lines and b) change in the width of the NH3 absorption551 lines due to varying H2O concentration in the matrix gas [52]. The cross-sensitivity is supposed to be corrected552 by the data evaluation algorithm of the spectrometer; however, we observed up to a few percent differences553 between the readings in dry and humid gas samples.Figure 7a shows two calibration lines obtained for the554 CRDS instrument: one in dry gas samples and one in humidified samples with relative humidity of 70 % at 20℃555 (corresponding to ~1.65 % absolute H20 amount fraction, the samples were prepared in the CATFAC facility;556 see Section 2.4 for more details). The slope of the two calibration lines differ by ~4 %, which indicates cross- 557 sensitivity to H20. The data evaluation algorithm is currently being further developed to account for this cross- 558 sensitivity [53]. 559560561562563564565566567568569570571572573574575576577 It has also been observed that the measured ammonia amount fractions are influenced by thecomposition of the matrix gas. Figure 7b illustrates this effect through measurements in air and nitrogen matrixgases in the 50-200 nmol/mol NHs amount fraction range. Instrument response refers to the ratio of themeasured and reference ammonia amount fractions, and has been normalized to the average of themeasurements in air, to show relative changes caused by changing the matrix gas.Error bars in the Figurerepresent estimated expanded uncertainty of the measurements, dominated by uncertainty of the ammoniaamount fraction in the reference gas (prepared by dynamic dilution from a commercial gas mixture of10 umol/mol NHs in N2). As it can be seen in Figure 7b, the data evaluation algorithm provided by themanufacturer results in ~10 % lower readings in nitrogen matrix gas, compared to air. The data evaluationalgorithm developed within the MetNH3 project gives normalized instrument response close to one in both airand nitrogen matrix gases. The reason for this difference is that the manufacturer algorithm uses the height ofthe ammonia absorption peaks for amount fraction calculation, which, due to the matrix gas dependentpressure broadening coefficients of the absorption lines, gives accurate results only in a specific matrix gas, forwhich the algorithm was developed. The evaluation algorithm developed in MetNH3 uses the integratedabsorbance (area under the measured absorptionlines), which is, according to equation (2), independent ofthe matrix gas. We note that the manufacturer recommends using the spectrometer in air matrix gas, where itindeed provides correct readings. However, we would like to emphasise that it is a notable restriction duringcalibration or validation of the spectrometer, since reference gas mixtures are often prepared in nitrogenmatrix gas. 578 579 580 581 582 583 Figure 7: a) Calibration curves of a Picarro G2103 instrument using dry (closed squares) and humidified (opencircles) test gases of ammonia in air, and b) measurement results in air and nitrogen matrix gases,obtained bythe manufacturer's data evaluation algorithm (closed squares) and that developed in MetNH3 (open triangles),where instrument response is normalized to the average of the ratio of the measured and reference ammoniaamount fractions in air and error bars refer to estimated expanded uncertainty. 584 585 586 587 Besides the spectroscopic aspects mentioned above, a possible bias and/or higher uncertainty introducedby sampling artefacts have to be investigated and quantified. In particular,t, response times of the analyzers areaffected by adsorption-desorption processes, which have to be taken into account during measurements inrapidly changing gas mixtures.A significant decrease in the adsorption lclosses can be achieved by proper selection of the materials of the gas handling system, heating of the gas sampling lines and applying a higherflow rate. In our experiments Teflon inlet lines and particle filters are used with a flow rate of at least 1 slm.Response times of the CRDS spectrometer under such conditions were found to be in the range of minutes (10-90% response time below 1.5 minutes, 1-99 % response time below 30 minutes). 4 Conclusions Previous studies revealed significant discrepancies between reference gas mixtures of NH in the pmol/molamount fraction range, as well as between amount fractions measured in the nmol/mol range by differentanalytical techniques. The major reasons for this are the low ammonia amount fractions in ambient air, as wellas the highly adsorptive and reactive nature of the ammonia molecule, which makes both the preparation ofreference materials and accurate analytical measurements challenging. The MetNH3 project aims to improvethe situation through developments in three major fields: 1) development of certified reference materials incylinders and traceable dynamic gas mixture generators,2) ddevelopment and characterization of sampling-freeand extractive spectroscopic instruments aiming to construct an optical transfer standard :and 3) providinginfrastructure for laboratory and field inter-comparison measurements to establish the link between high-accuracy metrological standards and field measurement methods. First results of the project have beendescribed in this article. The first significant results have been achieved in two major fields: the study ofadsorption of ammonia on different material surfaces, and the spectroscopic detection of ammonia by cavityring-down spectroscopy. Decantation studies carried out in cylinders showed that ammonia adsorption on the walls of stainlesssteel cylinders coated with SilcoNert 2000 is insignificant, even lower than the amount of adsorption observedin aluminium cylinders with Spectra SealM and AculifeM surface passivation treatments, which are usuallyapplied for the preparation of commercial ammonia reference gas mixtures. Adsorption studies in dynamicsystems showed similar results: SilcoNert 2000 coated stainless steel tubes showed (similarly to Teflon-PFAtubing) up to 10 times lower adsorption than stainless steel tubing with other surface treatments (Supelco andelectro-polishing). To improve accuracy and reliability of the spectroscopic detection of ammonia with a Picarro G2103spectrometer, a novel data evaluation algorithm is being developed within the project. This algorithm is basedon the determination of the integrated absorption coefficient by spectral fitting and calculation of theammonia amount fraction according to the Beer-Lambert law. Two phenomena have been observed so far,where the novel algorithm might excel over the more simple evaluation algorithm provided by thespectrometer manufacturer. We have shown that dependence of the measured ammonia amount fraction onthe matrix gas (which, e.g., leads to 10% bias when using nitrogen instead of air as matrix gas) can beeliminated using the novel algorithm. Cross-sensitivity to water vapour has also been observed, which leads toa few % lower readings in gas samples with ambient humidity levels. Further development of the dataevaluation algorithm to account for this cross-sensitivity is ongoing. Research in further fields investigated by the MetNH3 project is progressing as well; however, first tangibleresults are expected later during the project. A sampling-free spectrometer based on an open multi-pass celland a quantum cascade laser has been constructed and its metrological characterization is ongoing. It is expected to be the first sampling-free spectrometer providing traceable ammonia amount fraction resultswithout the need for calibration using gas standards. Two dynamic reference gas generators are beingdeveloped, which will be able to provide traceable reference gas mixtures with 0.5 -500 nmol/mol ammoniaamount fractions with lower than 3 % uncertainty (typical uncertainties in the NH3 amount fractions providedby commercial generators are >10 %). Two test facilities, an aerodynamic wind tunnel and a proficiency testfacility are being characterized. These facilities will provide the infrastructure for the inter-comparison ofammonia analyzers and reference gases developed within the project, as well as for the testing and validationof further devices and samplers. 6 Acknowledgements The authors acknowledge financial support and collaboration in EMRP projects. The EMRP is jointly fundedby the participating countries within EURAMET and the European Union. References ( 1] Stevens CJ, D upr C, D orland E, G audnik C, Gowing D J G, Bleeker A, Diekmann M, Alard D, Bobbink R, Fowler D , Corcket E, Mountford J O, Vandvik V, A arrestad P A, Muller S and D ise N B 2010 Nitrogendeposition t hreatens species richness of grasslands a c ross E u rope Environ.Pol l ut. 15 8 2940-5 ) ( [2] Sutton M A, Reis S and Baker S M H 2009 Atmospheric ammonia ed M A Sutton, S Reis and S M H Bak e r (Springer) ) ( [3] Sutton M A, ErismanJ W, Dentener F and Moller D 2008 Ammonia in the environment:From ancienttimes to the present Environ. Pollut. 15 6 583-604 ) ( [4] Air Pollution Information System, http://www.apis.ac.uk ) ( [5] Protocol to the 1 979 Convention on Long-range Transboundary Air Pollution to Abate Acidification , Eutrophication and Ground-Level Ozone, 1979, p. 1-94 ) ( [6] Decision 2012/12 Guidance for adjustments under the Gothenburg Protocol to emission redu c tion commitments or to inventories for the purposes of comparing total national e m issions with them, 2012, p. 1-5 ) ( [7] UNECE 2001 Directive 2001/81/EC of the European Parliament and of the Council, p. 1 -9 ) ( [8] European Comission 1992 Council Di r ective 92/43/EEC of 21 May 1992 on the conservation of naturalhabitats and of wild fauna and flora, p. 1-52 ) ( European M onitoring and Evaluation Programme (EMEP), http://www.emep.int ) ( Lolkema D E, Noordijk H, Stolk A P, Hoogerbrugge R, van Zanten M C and van Pul W A J 2015 TheMeasuring Ammonia in N a ture ( M AN) network in the Netherlands Biogeosciences Discuss. 12 6115-46 ) ( [11] Bobrutzki K Von, B r aban C F, Fa m ulari D, J ones S K, Blackall T, Smith T E L, Bl o m M, C oe H, Gall a gher M, Ghalaieny M, McGillen M R, Percival CJ, Whitehead J D, Ellis R , Murphy J, Mohacsi A, Pogany A, Junninen H , Rantanen S, Sutton M A and N emitz E 2 010 Field inter-comparison of eleven atmosphericammonia measurement techniques Atmos. Meas. T ech. 391-112 ) ( 121 Norman M, Spirig C, Wolff V, Trebsl, Flechard C, Wisthaler a.,SchnitzhoferR, H a nsel a. a n d Neftel a. 2008 I ntercomparison of ammonia measurement techniques at an intensively managed grassland site(Oensingen, S witzerland) Atmos. Chem. Phys. Discuss. 8 19791-818 ) 666 131 Sutton M A, Nemitz E, Theobald M R, Milford C, Dorsey J R, Gallagher M W and Hensen A 2009Dynamics of ammonia exchange with cut grassland : strategy and implementation of the GRAMINAEIntegrated Experiment Biogeosciences 6 309-31 667 [14] Veen AM H Van Der, Nieuwenkamp G, Wessel R M, Maruyama M, Heo G S, Cox G, Harris P M, 668 669 Guenther F R, Rhoderick G C, Konopelko L A and Kustikov Y A 2010 International Comparison CCQMK46-Ammonia in Nitrogen Metrologia 47 08023 670 1151 EMRP MetNH3 project, http://www.metnh3.eu 671 672 [16] 2008 JCGM 100:2008 Evaluation of measurement data - Guide to the expression ofuncertainty inmeasurement (International Organization for Standardization) 673 674 675 676 171 Pogany A, Balslev-harder D, Braban C F, Cassidy N, Ebert V, Ferracci V, Leuenberger D, Luttschwager N,Martin N, Pascale C, Tiebe C, Twigg M M, Vaittinen O, Wijk J Van, Wirtz K and Niederhauser B 2015Metrology for ammonia in ambient air - concept and first results of the EMRP project MetNH3 17"International Congress of Metrology pp 1-9 ( 677 181 ISO 6142:2006 Gas analysis. P reparation of calibration gas mixtures. Gravimetric method ) 678 1191 ISO 6145-10:2012-06, Gas analysis - Preparation of calibration gas mixtures using dynamic volumetric679 methods-Part 10:Permeation method. ( 680 1201 LNI Schmidlin SA, www.Inischmindlin.ch ) ( 681 211 Owlstone Ltd.,www.owlstonenanotech.com ) 682 1221 VICI AG International, www.vici.com ( 683 [231 Kin-Tek Laboratories Inc.,www.kin-tek.com ) 684 [241 2012 JCGM 200 : 2012 International vocabulary of metrology-Basic and general concepts and685 associated terms (VIM) (International Organization for Standardization) 686 687 688 689 690 691 692 251 Rothman L S, Gordon I E, BabikovY, Barbe a., Chris Benner D, Bernath P F, Birk M, Bizzocchi L, BoudonV, Brown L R, Campargue a., Chance K, Cohen E a., Coudert L H, Devi VM, Drouin B J, Fayt a., Flaud J-M, Gamache R R, HarrisonJJ, Hartmann J-M, Hill C, Hodges J T, Jacquemart D, Jolly a., Lamouroux J, LeRoy R J, Li G, Long D a., Lyulin OM, Mackie C J, Massie S T, Mikhailenko S, Muller H S P, Naumenko O V,Nikitin a. V, Orphal J, Perevalov V, Perrin a., Polovtseva E R, Richard C, Smith M a. H, Starikova E, SungK, Tashkun S, Tennyson J, Toon G C, Tyuterev V G and Wagner G 2013 The HITRAN2012 molecularspectroscopic database J. Quant. Spectrosc. Radiat. Transf. 130 4-50 693 694 695 1261 Schilt S, Thevenaz L, Nikles M, Emmenegger L and Huglin C 2004 Ammonia monitoring at trace levelusing photoacoustic spectroscopy in industrial and environmental applications Spectrochim. Acta-PartA Mol. Biomol. Spectrosc. 60 3259-68 696 697 271 Miller D J, Sun K, Tao L, Khan M a. and Zondlo M a. 2014 Open-path, quantum cascade-laser-basedsensor for high-resolution atmospheric ammonia measurements Atmos. Meas.Tech. 7 81-93 698 699 700 701 1281 Volten H, Bergwerff J B, Haaima M, Lolkema D E, Berkhout a. J C, Van Der Hoff G R, Potma CJ M,Wichink Kruit R J, Van Pul W a J and Swart D PJ 2012 Two instruments based on differential opticalabsorption spectroscopy (DOAS) to measure accurate ammonia concentrations in the atmosphereAtmos.Meas. Tech.5 413-27 702 703 [291 Owen K and Farooq A 2014 A calibration-free ammonia breath sensor using a quantum cascade laserwith WMS 2f/1f Appl. Phys. B 116 371-83 704 705 706 301 Pogany A, Wagner S, Werhahn O and Ebert V 2015 Development and Metrological Characterization ofa Tunable Diode Laser Absorption Spectroscopy (TDLAS) Spectrometer for Simultaneous AbsoluteMeasurement of Carbon Dioxide and Water Vapor Appl. Spectrosc. 69 257-68 707 708 ( [311 Buchholz B , Bose N and Ebert V 20 1 4 Absolute validation of a diode laser hygrometer via intercomparison with the German n a tional primary water vapor standard Appl. Phys. B 116 883-99 ) 709 710 ( [321 Berglund M and Wieser M E 2011 Is o topic c o mpositions of the elements 2009 (IUPAC Technical Report) Pure Appl. Chem. 83 397-410 ) 711 712 713 ( [33] Owen K, Es-sebbar E T and F arooq A 2013 Measurements of NHs linestrengths and collisional broadening coefficients i n N2,02, CO2, and H20 near 1103.46cmJ.Qua n t. Spectrosc. Radia t . Trans f . 12156-68 ) 714 [34] Werhahn O, Brunzendorf J, Nwaboh J A, Serdyukov A, Werwein V and Ebert V 2014 Spectral reference 715 716 line data relevant to remote sensing applications: a review and outline of the EUMETRISPEC projectProc. SPIE 92420D 717 718 1351 Pogany A, Ott O, Werhahn O and Ebert V 2013 Towards traceability in CO2 line strength measurementsby TDLAS at 2.7 um J. Quant. Spectrosc. Radiat. Transf. 130 147-57 719 720 [36] Pogany A, Klein A and Ebert V 2015 Measurement of water vapor line strengths in the 1.4-2.7 umrange by tunable diode laser absorption spectroscopy J. Quant. Spectrosc. Radiat. Transf. 165 108-22 721 722 723 [37] Ortwein P, Woiwode W, Wagner S, Gisi M and Ebert V 2009 Laser-based measurements of linestrength, self- and pressure-broadening coefficients of the HclR(3) absorption line in the firstovertone region for pressures up to 1 MPa Appl. Phys. B 100 341-7 724 [381 Picarro Inc., www.picarro.com 725 726 ( 391 Wyers G P, Otjes R P and Slanina J 1993 A continuous-flow denuder for the measurement of ambient concetrations and surface-exchange fluxes of ammonia Atmos. Environ. 27A 2085-90 ) 727 728 729 ( [40] Barbiere M , S tummer V, Lagler F and Mucke H-G 2013 Evaluation of the Laboratory ComparisonExercise for NO, NO2, SO2, CO and Og Langen (D) 1*- 6" September 2013 EC Harmonization Programfor Air Quality Measurements (Luxembourg) ) 730 731 ( [41] Vaittinen O, Metsala M, Persijn S, Vainio M and Halonen L 2013 Adsorption of ammonia on t reatedstainless stee l and polymer surfaces Appl. Phys. B 115 185-96 ) 732 733 ( [421 Mukhtar S, Rose A J, Capareda S C, Boriack C N, Lacey RE, Shaw B W and Parnell C B 2003 Assessmentof ammonia adsorption onto tef l on and LDPE tubing Agric. Eng. Int. CIGR J. V BC 03 012 ) 734 735 ( [431 Henningsen J and Melander N 1997 Sensitive measurement of adsorption dynamics with nonresonant gas phase photoacoustics Appl. Opt. 36 7037-45 ) 736 441 SilcoTek Inc., www.silcotek.com 737 738 739 ( [45] Roscioli J R,Zahniser M S, Nelson D D , Herndon S C and Kolb C E 2015 New Approaches to Measuring Sticky Molecules: Improvement of Instrumental Response Times Using Active Passivation J. Phys. Chem. A 150624112729005 ) 740 741 742 ( [46] Ellis R a., Murphy J G, Pattey E , Van Haarlem R , O’Brien J M and Herndon S C 2 0 1 0 Characterizing aQuantum Cascade Tunable Infrared Laser Differential Absorption Spectrometer (QC-TILDAS) for measurements of atmospheric ammonia Atmos. Meas. Tech. 3 397-406 ) 743 471 Spectra-Seal, Registration Nr. 3853813,2010, BOC Limited 744 481 AcuLife, Registration Nr. 4104439,2012, Air Liquide America Specialty Gases LLC 745 746 ( [49] Buchholz B, Kuhnreich B, S mit H G J and Ebert V 2012 Validation of an extractive, airborne, compactTDL spectrometer for atmospheric humidity sensing by blind intercomparison Appl. Phys. B 110 249-62 ) 747 748 ( [50] Nielsen L 2002 E valuation o f measurements by the me t hod of least squares Algorithms for Approximation IV ed J Levesley, IJ Andreson and J C Mason (University of Huddersfield) pp 170-86 ) 749 750 ( [51] Pogany A, Werhahn O, Ebert V 2016 High-accuracy ammonia line intensity measurements at 1.5 mm Imaging and Applied Optics 2016, OSA technical D i gest (online),Optical Society of America, JT3A.15 ) 751 752 ( 1521 Schilt S 2010 Impact of water vapor on 1.51 um ammonia absorption features used in tra c e gas sensingapplications Appl. Phys. B Lasers Opt. 100 349-59 ) 753 754 755 ( 1531 Martin NA, Ferracci V, Cassidy N, Hoffnagle JA 2016 The application of a cavity ring-down spectrometer to measurements of ambient ammonia using traceable primary standard gas mixtures Appl. Phys. B 1 2 2219 DOI:10.1007/s00340-016-6486-9 ) Photograph of the Controlled Atmosphere Test Facility (CATFAC)
关闭-
1/23
-
2/23
还剩21页未读,是否继续阅读?
继续免费阅读全文产品配置单
北京世纪朝阳科技发展有限公司为您提供《大气中氨气体检测方案(氨气分析仪)》,该方案主要用于空气中分子态无机污染物检测,参考标准《暂无》,《大气中氨气体检测方案(氨气分析仪)》用到的仪器有Picarro G2103 超高精度氨气(NH3)气体浓度分析仪。
我要纠错
推荐专场
相关方案
 咨询
咨询