

方案详情文
智能文字提取功能测试中
Journal of Computational Information Systems 9: 7(2013) 265;)2659-2666Available at http://www.Jofcis.com 2660D. Luo et al. /Journal of Computational Information Systems 9: 7(2013)2659-2666 Classification of Hundred-grass-oil Samples Using E-nose* Dehan LUO1* Yu SUN1, Jiajun ZHUANG1, H. Gholam HOSSEINI2 l School of Information Engineering, Guangdong University of Technology, Guangzhou 510006, China"School of Engineering,Auckland University of Technology, Private Bag 92006, Auckland 1142,New Zealand Abstract One of the differences between Traditional Chinese Medicine (TCM) and its ordinary counterpart is thecomposition of products. The ingredients of TCM are complex mixtures of natural products or extractswith various active constituents while in ordinary medicine, all of the active ingredients are singlecompounds and can easily be analyzed. Therefore, the classification of TCM with complex mixturesis not well adapted with the classical discriminative techniques which apply to ordinary medicine.Quality assessment of TCM is an important factor for analyzing those complex matrices and givescomprehensive quantitative data about the global ingredients. Electronic nose (E-nose) can be used forquality assessment and classification of TCM. The aim of study is to classify four groups of hundred-grass-oil (HGO), one of the popular TCM, from different production batches using a portable E-nose(PEN3). Principal component analysis (PCA) and linear discriminant analysis (LDA) were used toinvestigate the classification ability of PEN3.The results of PCA analysis showed a good separationamong four groups of HGO. Loadings analysis was used to optimize the number of sensors that show ahigher influence on the distribution of the PCA plot. A better classification result is obtained by LDAanalysis. Keywords: Traditional Chinese Medicine (TCM); Electronic Nose (E-nose); Identification ofHundred-grass-oil; PCA; LDA 1 Introduction Improvements in electronic nose technology over the last 20 years have enabled us to employ E-nose in automatic identification of HGO among other TCM and classifying four groups of HGObased on their production batches. A portable PEN3 E-nose comprising an array of metal oxidesemiconductor (MOS) sensors with partial specificity and an appropriate pattern recognitionsystem, making it capable of recognizing simple or complex odors [1]. ( *Project supported by the National N atural Science Foundation o f China t hrough Project ( No. 6 0971105) andthe Guangdong Natural Science Foundation through Project (No. S2011020002906). ) ( *Corresponding author. ) ( Email address: dehanluo@gdut.edu.cn (Dehan LUO). ) ( 1553- 9 105 / C opyright @ 2013 Bi n ary Information Press ) ( April 1,2013 ) Pattern recognition techniques such as principal component analysis (PCA), linear discrimi-nant analysis (LDA), discriminant function analysis (DFA), cluster analysis (CA), and artificialneural network (ANN) have been used for data analysis in E-nose based applications [2, 3].In thisstudy,PCA and LDA techniques have been employed and their performance in classification ofthe selected samples of HGO has been compared. Based on the concept of “nasal olfaction”, one of traditional empirical methods for identifyingand classifying TCM [4], we proposed a simple and quick method for classifying TCM samples byan E-nose. During the past few years, E-nose technology systems have gained remarkable devel-opment. This technology ese instruments have been widely and successfully used in different fieldsespecially in food and beverage industry, such as identification of spoiled beef l5], detection andevaluation of fish freshness [6, 7], modeling the ripening of Danish blue cheese[8], discriminationor classification of wine2, 9, 10, monitoring the aroma of different kinds of fruit 3, 11, 12, 13].However, very little work has b1 Ceen conducted so far to classify TCM with an E-nose.The aimof this study is to classify HGO from different production batches, using a pattern recognitiontechnique, and evaluate the discrimination capability of an e-nose system. 2 Materials and Methods 2.1 Experimental samples This study was carried out using four groups of Luofushan HGO samples with different productionbatches provided by Guangdong Luofushan Pharmaceutical Co. Ltd. as described in Table 1.HGO is a kind of emerald green clarified liquid made of 79 different TCM with fragrant smell. Table 1: Information of HGO samples used in this experiment Group label Sample name Production batch Production date p060528 HGO 1 L06E281 20060528 p070504 HGO 2 L07E041 20070504 p080118 HGO3 L08A181 20080118 p080304 HGO4 L08C041 20080304 2.2 Portable E-nose Experiments were performed with a portable electronic nose (PEN3) produced by AIRSENSEAnalytics GmbH in Schwerin, Germany. PEN3 is equipped with an array of 10 different MOSsensors positioned into a small chamber (V=1.8ml), a sampling apparatus and a pattern recogni-tion software named WinMuster. Table 2 summarizes the sensitivity list of all sensors in PEN3.The response data collected by PEN3 is defined as the ratio of conductance: G/G0. G representsthe resistance of each sensor in the chamber after the exposition to the headspace gas in the vialand G0 represents the resistance while the sensors expose to the zero gas filtered by active carbon. Table:22: The sensitivity list of 10 sensors in PEN3 Number in array Sensorname Sensitiveto Detection Range/ppm S1 W1C Aromatic components 10 S2 W5S Nitrogen oxides, very sensitive 1 S3 W3C Ammonia and aromatic components 10 S4 W6S Mainly hydrogen, selectively, (breath gases) 100 S5 W5C Alkanes and aromatic components 1 S6 W1S Propane 100 S7 W1W Sulfur organic compounds 1 S8 W2S Ethanol 100 S9 w2W romatic components and organic-sulfides 1 S10 W3S Propane(selective sometimes) 100 2.3 Experimental set up and data collection Figure 1 shows the experimental set up for data collection which was carried out in an air-conditioned laboratory where the temperature was kept at 27±1 degrees Celsius and the humidityat 46±3%. The HGO samples with different production batches were injected into four vials (40ml) labeled p060528, p070504, p080118 and p080304, respectively. The dose of each sample inthe vial is 0.5 ml. Then four vials were hermetically capped with plastic wrap for 1 hour inorder to generate a steady headspace respectively. The sampling time for each sample is 770seconds, which is enough for each sensor to reach a stable value. The rinsing time is set as 110seconds, during which the sensors are rinsed with charcoal filtered to force the signals of sensorsto baseline. One measurement circle would last for about 6 minutes. Meanwhile, due to the highsensitivity of the second sensor W5S, the automatic dilution was set to be activated when theprime transient response (G/G0) of sensor W5S rose above 3, in order to protect the sensor arrayfrom being overloaded. Static headspace sampling (SHS) method was used because SHS is the Fig.1: Experimental Setup for headspace volatile sampling most common technique for its accessibility [15]. During the measurement process, the headspaceof each vial was pumped over the sensors in PEN3 with a constant flow speed of 400 ml/min.The collected data set would be automatically stored in a personal computer connected to PEN3after measurement was completed. The headspace gas of each vial of HGO sample was measured8 times continuously. Thus 32 data sets were collected for all 4 groups of HGO. 3 Results and Discussion 3.1 Sensor response The data sets acquired were first analyzed by Matlab 7.1 to reconstruct the response curves andradial plot of the 10 sensors. Figure 2 shows the typical transient responses of the 10 sensors tothe four groups. The response curves represent the ratio of the conductance of each sensor versussampling time when the volatile gas of one sample group reached the sensor chamber. Figure 2shows rapid change at the beginning of the sampling time particularly for sensor 2 (W5S). Butthe curves reach to the steady state soon due to the automatic dilution. After approximately40 seconds all the sensors reached stable values except sensor 2, which changed evenly after 60seconds. The contributions of the 10 sensors to the four groups of HGO are similar by comparingthe response curves of the latter 30 seconds in the four graphs below. Some static features might Fig. 2: Response curves of 10 sensors to the four groups against sampling time be extracted from the data sets, such as the final conductance (G) of each sensor, conductanceincrement (G=G-G0),the ratio of the conductance (G/G0) of each sensor and so on. In this study, the ratio of the conductance of each sensor between the 61st and 64th second ofthe sampling time was extracted as the static feature for further analysis. 3.2 Principal component analysis Initially, the data sets were rescaled by dividing the data by the standard deviation. After analyz-ing by PCA [14], the dimensionality of the data sets was reduced to a lower dimension. Usuallythe first two principal components will carry the most information of the old variables.Thecorresponding plots of the first two principle components are shown in Figure 3. The principalcomponents in the plot represent the eigenvectors of data sets processed by PCA and are pre-sented in descending order. It is shown in Figure 4, that the first two components capture most information (88.73% totally) of the variance in the data sets. All the clusters of the groups weredispersive and stretched obviously in the direction of transverse axis except that of the grouplabeled p070504 which was a bit convergent. In the PCA plot the higher the interclass distancebetween two clusters, the higher the difference between them. The first two groups (p060528 andp070504) could be easily distinguished within the four clusters; however, the clusters of the lattertwo groups (p080118 and p080304) did not differ much. This small overlap joint could be due tothe fact that the latter two groups are of closer production dates, making the aroma ingredientof them seem to be more similar and therefore the sensors response to them are near akin. Fig.3: The PCA score plot of four groups measured using SHS *The figure here means that the classification rate between group p060528 and group p070504is 98.5%. Table 3 shows the classification rate among the four groups calculated by WinMuster. Overall,the classification rate is satisfying except that between group p080118 and group p080304 (only72.7%). Tablee3: Information of HGO samples used in this experiment p060528 p070504 p080118 p080304 p060528 — 98.5% 99.4% 99.6% p070504 98.5% 97.6% 99.3% p080118 99.4% 97.6% 72.7% p080304 99.6% 99.3% 72.7% 3.3 Loadings analysis Single sensoorrSs 1may have a bad influence on the analysis result. That means, a sensor may onlyreact on disturbing compounds, not on compounds important for the discrimination. Usefulinformation for the selection of sensor signals to be eliminated may be obtained by the loadingsanalysis. The loadings analysis is well correlated to the PCA; it is based on the same algorithm, butin this case, it is calculated for the sensors themselves. It is useful to check for the influence(loading) of a sensor on the distribution of data sets.The direction where the sensors in thel1o0aadings analysis are located corresponds to the direction of the PCA plot distribution. By thismethod we could switch off some sensors that had a minor influence on the distribution in thePCA plot [16]. Figure 4shows a loading plot of the loading factors associate to PC1 and PC2 forthe samples. The points in the plot represent the sensors used in the experiment. Sensors, withloading parameters close to zero for a particular principal component, have a low contribution tothe total response of the array, whereas high values indicates a discriminating sensor [12]. So wecould consider switching off the sensor that has less influence on the result of PCA analysis. Ifa group of sensors have similar response to the samples, we could consider replacing the groupwith one of its member. One group of sensors including W1C, W5S, W3C and W2W evidently Fig. 4: Loadings analysis related to the first two principal components have higher influence in the current pattern files than the second group including W6S, W5C,W1S, W1W, W2S, and W3S6 sensors., among which Sensor W3S has almost no influence amongthe second group of sensors while the other 5 sensors in this group have closer influence so thatthey might be represented by one of the group member. Sensor W5C has a lower detection range(1ppm) while exposure to aromatic components as shown in Table 2. By considering the factors aforementioned, a subset of sensors including[W1C, W5S, W3C,W5C (a representative from the second group) and W2W] sensors is retained as an optimizedsensor array. The corresponding PCA plot of data sets of these 5 sensors is shown in Figure 5. 3.4 Linear discriminant analysis The response data of PEN3 for each group between the collection times (61st and 64th) wereextracted and analyzed by LDA analysis. The analytic result is shown in Figure 6. As is shownin Figure 6, LDA function 1 (LD1) and function 2 (LD2) accounted for 95.017% and 3.2718% ofthe variance, respectively. The clusters of the data sets are obviously divided into four groups,allowing an easy discrimination of the four sample groups with different production batches. Thisis very satisfactory because it clearly shows a better classification by LDA analysis. Fig. 5: The PCA score plot of the HGO groups by a subset of sensors Fig. 6: Analytic result of the HGO groups by LDA 4 Conclusion For the purpose of classification of TCMs (four groups of HGO samples with different productionbatches), experiments have been carried out with PEN3. The results show that it is practical andeffectual to classify the congener TCMs samples by an electronic nose system and appropriatepattern recognition algorithms. The PCA analysis had a poor performance in clustering of the groups labeled p080118 andp080304. However, a better classification result is obtained by LDA analysis. Besides, we coulduse loadings analysis as a means of sensors optimization. As a result of loading analysis it was found that with a subset of sensors including 5 mostsensible sensors, the clustering of the selected four groups seemed to be more convergent thansimilar clustering approach using all sensors. Acknowledgement The authors would acknowledge the Guangzhou University of Chinese Medicine for providing theAtractylodes samples. References ( 1] J. Lozano, T. Arroyo, J . P. Santos, et al. E lectronic nose for wine ageing d e tection. S e nsors and Actuators B, 133 (2008) : pp . 18 0- 186. ) ( Jesús Lozano, Jose Pedro S a ntos, M anuel Al e ixandre, et al . I d entification o f typical wine aromasby means of a n electronic nose. IEEE Sensors Journal, 6 (2006): pp. 173 - 178. ) ( [3 ] Amalia Z. Berna, J e roen Lammertyn, Stijn Sae v els, et al. El e ctronic nose sy s tems to study shelflife and cultiva r effe c t on tomato aroma profile. Sensors an d Actuators B, 97 (2004): pp. 324 - 333. ) ( [4 ] Zhang L i xin, Zhao Yannan, Yang Zeho n g, et al. Clas s ification of t r aditional Chinese medicineby n earest-neighour c lassifier and genetic algorithm. In Proceedings of t he Fifth I nternationalConference on I nformation Fusion, 2002, v ol. 2, Page (s) : pp. 1596 -1 601. ) ( [5] S. Panigrahi, S. Balasubramanian, H. Gu , et al . Neural-network-integrated electronic nos e systemfor identification of spoiled bee f . LWT-Food Science and Technology, 39 ( 2 006): p p . 1 3 5-145. ) ( 6 H. G holamHosseini H . , D. Lu o Deh a n, H. Liu H ong x iu, et al . Inte l ligent processing of E- n oseinformation for f ish freshness assessment. P roceedings of the 2007 International Conference onIntelligent Sensors, Sensor Networks and Information P r ocessing, 2007, P a ge (s): pp. 1 7 3- 17 7 . ) ( 7 N. E l B arbri, E . Llobet, N. El B a ri, e t al. Application o f a p o rtable electronic n o se system toassess the freshness of Moroccan sardines. M aterials Science and E n gineering: C, 28 (2008): pp . 666 - 670. ) ( 81 J. T rihaas,L. Vognsen, P. V. Nielsen. Electronic nose: new tool in modeling the ripening of Danishblue cheese. Internationa l Dairy Journal , 1 5 (2005): pp.679-691. ) ( [9 ] M. P ilar Martf, Olga Busto, Josep Guasch. A pplication of a headspace m ass spectrometry systemto t he d ifferentiation and classification o f w ines according to th e ir or i gin, va r iety and ageing.Journal of Chromatography: A, 1057 (2004): pp.211 - 2 1 7. ) ( [10 ] J J . Lozano, J . P. Santos, J. Gutierrez, et al. Comparative study o f sampling systems combined withgas sensors for wine d iscrimination. Sensors and Actuators B, 126 (20 0 7): pp. 616 623. ) ( [11] J J esús Brezmes, Ma. Luisa Lopez Fructuoso, Edu a rd Llobet, et al. Eva l uation of an electronic noseto assess fruit ripeness . IEEE Sensors Journal, 5 (2005): pp. 97 -10 8 . ) ( [12] Antihus Hernandez Gomez, J u n Wang, Guixian Hu, et a l. Electronic nose te c hnique potentialmonitoring mandarin maturity. Sensors and Actuators B, 113 (2006): pp. 347-353. ) L Simona Benedetti, Susanna Buratti, Anna Spinardi, et al. Electronic nose as a non-destructive toolto characterise peach cultivars and to monitor their ripening stage during shelf-life. PostharvestBiology and Technology, 47 (2008): pp. 181-188. [14] Huichun Yu, Jun Wang. Discrimination of LongJing green-tea grade by electronic nose. Sensorsand Actuators B, 122 (2007): pp. 134 140. [15] M. Pilar Martf, Ricard Boque, Olga Busto, et al. Electronic noses in the quality control of alcoholicbeverages. Trends in Analytical Chemistry, 24 (2005): pp. 57 -66. ( [16] Antihus Hernandez Gomez, Guixian H u , J u n Wang, et al. E v aluation o f t o mato maturity byelectronic nose. Computers and E lectronics in Agriculture, 54 (2006): pp. 44 -5 2. ) 样品: 本研究以广东省罗孚山药业有限公司提供的四批不同生产批次的罗浮山HGO样品为研究对象。仪器:德国AIRSENSE电子鼻 pen3检测指标:中草药气味识别分类检测过程: 将不同批次的HGO样品分别注入标记为p 060528、p 070504、p 080118和p 080304的4个小瓶(40 Ml)。每瓶样品的剂量为0.5毫升。四个小瓶分别用塑料薄膜密封1小时,以产生一个稳定的顶空。每个样本的采样时间为70秒。实验结果: 电子鼻可用于中药质量评价和分类。本研究的目的是通过使用便携式电子鼻(PEN 3)从不同的角度对流行的中草药百草油(Hgo)进行分类。采用主成分分析(PCA)和线性判别分析(LDA)对PEN 3的分类能力进行了研究。PCA分析结果表明,HGO四组间有良好的分离效果。通过LDA分析,得到了较好的分类结果。结论: 结果表明,一种便携式PEN 3电子鼻,包括具有部分特异性的金属氧化物半导体(MOS)传感器阵列和适当的模式识别系统,其能够识别简单或复杂气味,对同源TCMS样本进行分类,该方法具有较好的实用性和效果。
关闭-
1/8
-
2/8
还剩6页未读,是否继续阅读?
继续免费阅读全文产品配置单
北京盈盛恒泰科技有限责任公司为您提供《百草油中中药气味检测方案(感官智能分析)》,该方案主要用于植物油脂和提取物中理化性质检测,参考标准《暂无》,《百草油中中药气味检测方案(感官智能分析)》用到的仪器有德国AIRSENSE品牌PEN3电子鼻。
我要纠错
推荐专场
感官智能分析系统(电子鼻/电子舌)
更多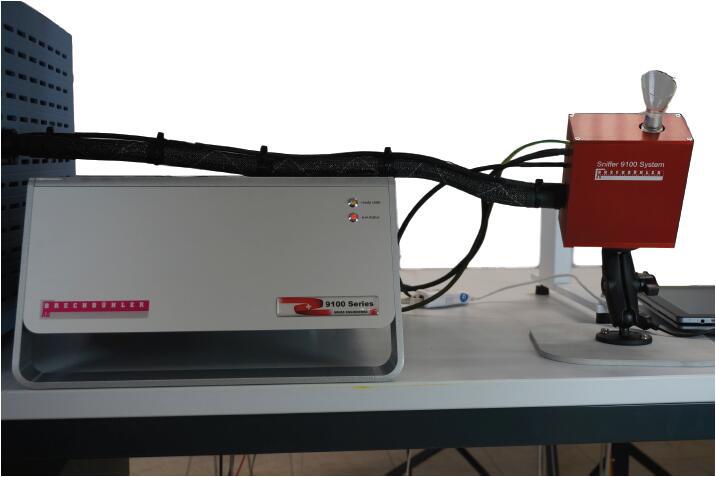
相关方案
 咨询
咨询