

方案详情文
智能文字提取功能测试中
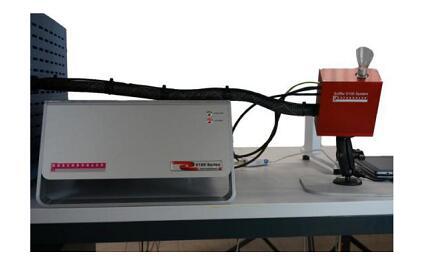
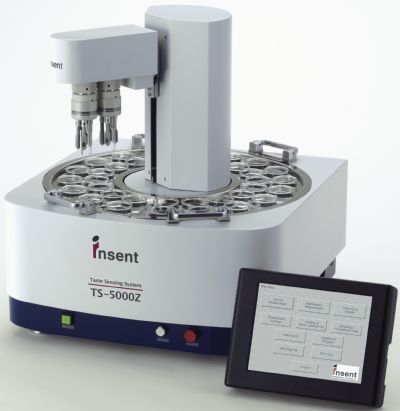
J. Ocean Univ. China (Oceanic and Coastal Sea Research)ISSN 1672-5182,202120(1):213-220E-mail:xbywb@ouc.edu.cn CAO et al./ J.Ocean Univ. China (Oceanic and Coastal Sea Research) 202120:213-220214 https://doi.org/10.1007/s11802-021-4447-3 http://www.ouc.edu.cn/xbywb/ Flavor Characteristics of Different Crops of Laver(Porphyra yezoensis) During One Harvest Cycle CAO Rong 2, HU Mengyue’, ZHAO Ling", WANG Lianzhu",and LIU Qil* 1) Yellow Sea Fisheries Research Institute, Chinese Academy ofFishery Sciences, Qingdao 266071, China2) Laboratory for Marine Drugs and Bioproducts of Qingdao National Laboratory for Marine Science andTechnology, Qingdao 266237, China 3) College of Food Science and Technology, Ocean University of China, Qingdao 266003, China (Received January 9, 2020; revised October 15, 2020; accepted October 21, 2020) @ Ocean University of China, Science Press and Springer-Verlag GmbH Germany 2021 Abstract The taste and odor analysis of the first, second, fourth and sixth crops of laver (Porphyra yezoensis) was obtained byelectronic tongue, taste-related compound, electronic nose and gas chromatography-ion mobility spectrometer (GC-IMS). Throughthe detection of the electronic tongue, the pleasant tastes such as umami and richness are more intense in the early crops, which isconsistent with the analysis results of free amino acids and flavored nucleotides. The electronic nose can clearly distinguish betweendifferent laver crops. GC-IMS separated and identified 36 volatile components from lavers, mainly including aldehydes, ketones,alcohols, esters, acids and aromatic substances. For the early harvested crops, nonanal, octanal, hexanal and benzaldehyde have asignificant contribution to odor because of the high concentration and low threshold of these compounds. For the later harvestedcrops, the concentration of most ketones and some aldehydes increased. 1-Octen-3-ol, malondialdehyde and heptanal constituted themain odor characteristics. Key words Porphyra yezoensis; flavor characteristic; electronic tongue; electronic nose; gas chromatography-ion mobility spec-trometer 1 Introduction Due to the increasing awareness of dietary nutritionand health, consumers are becoming more and more in-terested in eating seaweeds (Jimenez-Escrig, 2011). Laveris one of the most important economic algae in the world.It belongs to the Rhodophyta phylum, Protoflorideophy-ceae class, Bangiales order, Bangiaceae family, and Por-phyra genus. Laver products are popular for their highnutritional value and unique flavor, especially umami(Nakamura, 2011). So far, more than 130 kinds of laverhave been reported worldwide, among which Porphyrayezoensis and Porphyra haitnensis are the two mainaquaculture species. Laver can be harvested 5-6 timesduring an aquaculture cycle. Both consumers and pro-ducers concern about quality differences between the dif-ferent crops. Now, consumers no longer only care about whether theproduct is nutritious, but also have higher requirementsfor its flavor. The flavor of aquatic products consistsmainly of odor and taste. The researchers have studied thevolatile odor components ofvarious aquatic products ( *Corresponding author. T el: 0086-532-85830760 ) ( E-mail: liuqi@ysfri.ac.cn ) (Varlet et al., 2006; Francois et al., 2012; Li et al.,2013)and made ideal progress in analytical methods, such asheadspace solid-phase microextraction (HS-SPME) (Che-ong et al., 2010), two-dimensional gas chromatographycoupled to time-of-flight mass spectrometry (GCxGC-ToF MS) (Cheong, 2011), electronic nose (Alasalvar et al.,2015) and gas chromatography-ion mobility spectrometer(GC-IMS)(Criado-Garcia et al., 2016). Taste substances are mainly non-volatile and water-soluble, such as inorganic ions, organic acids, free aminoacids, peptides, nucleotide and related compounds. At pre-sent, research on the taste of aquatic products is mainlyfocused on aquatic animals such as fish (Fujimaki et al.,2014), shellfish (Cho and Sang, 2014), shrimp (Cheungand Li-Chan, 2014) and crabs (Hayashi et al., 2010). Fewstudies focus on the taste of economic algae such as laver. Previous studies have confirmed that there are signifi-cant differences in the nutrient composition of differentlaver crops (Zhao et al., 2018). However, little informa-tion is available about the flavor characteristics of differ-ent laver crops. In this paper, as the typical species innorthern China, P. yezoensis was collected as an experi-mental object. To identify the flavor characteristics of P.yezoensis, the odor and taste of different crops harvestedduring one aquaculture cycle were analyzed using anelectronic nose and an electronic tongue respectively. The taste substances such as free amino acids and flavorednucleotides were also determined. This is the first reporton the odor and taste analysis of lavers collected at dif-ferent dates. 2 Materials and Methods 2.1 Materials P. yezoensis used in this study was collected from JingBay, which is in Shandong Province, China. The harvestdate was 1/02/2018 for the first crop, 1/14/2018 for thesecond crop, 2/10/2018 for the fourth crop and 3/15/2018for the sixth crop. The reagents and chemicals used in thisstudy were of analytical grade and purchased from SigmaCorp. 2.2 Taste Profile Analysis The taste characteristic of laver was analyzed by usingTS-5000Z taste sensing system (INSENT Technology Co.,Ltd., Japan). Dried laver powder 5.0 g was mixed with100 mL boiling distilled water. After soaking in a flaskfor 5 min, the mixture was centrifuged (3000 g, 5min).The supernatant was taken and cooled to room tempera-ture. Then, the electronic tongue which loaded differentsensor electrodes was used to examine umami, bitterness,astringency, saltiness, sourness and their aftertastes. Eachsample was examined for 3 times. All the test data wereanalyzed by using the system’s build-in software. Thereference solution used in this study was a mixed solutionof potassium chloride and tartaric acid, which was anartificial simulation to human saliva. The cleaning solu-tion for anode was a mixture of distilled water, potassiumchloride, ethanol and potassium hydroxide. The cleaningsolution for cathode was a mixture of distilled water,ethanol and hydrochloric acid. 2.3 Taste Related Compounds Determination Sulfosalicylic acid method was used for the detectionand quantification of free amino acids. High performanceliquid chromatography method was used for measuringnucleotides. 5.0g laver powder was immersed in hydro-chloric acid solution (0.01 molL) for 30 min, then fil-trated and mixed with sulphosalicylic acid solution (8%,m/v) in a ratio of 1:1 (v/v). The mixture was centrifugedand filtered through a 0.45 um filter membrane, then de-termined by L-8800 amino acid automatic analyzer (Hi-tachi Technology Co., Ltd., Japan). 5.0g dried laver powder was added into 25.0mL per-acetic acid solution (10%, m/v). After homogenizationand centrifugation, the supernatant was collected andneutralized to pH 6.5. The supernatant was filteredthrough a 0.45 um filter membrane. The leachate wascollected and examined by 1260 HPLC (Agilent Tech-nology Co., Ltd., USA). The contents of adenosine mo-nophosphate (AMP), inosine monophosphate (IMP) andguanosine monophosphate (GMP) were determined bycomparing the retention time and peak area of the samplewith the standard compounds. Taste active value (TAV) was calculated according tothe following formula (Gong et al., 2014): Equivalent umami concentration (EUC) was calculatedaccording to the following formula (Gong et al., 2014). MSG represents monosodium glutamate. 1218 is a sy-nergistic constant. a; represents the quantity of umamiamino acid (g/100g). b;represents umami coefficient ofamino acid to MSG (Glu 1.0, Asp 0.077).a; represents thequantity of umami nucleotides (g/100 g). b representsumami coefficient of nucleotides to IMP (IMP 1.0, AMP0.18. GMP 2.3). 2.4 Odor Profile Analysis PEN-3 electronic nose (Airsense Technology Co., Ltd.,Germany) was used for the odor characteristic analysis.The E-nose is equipped with 10 metal oxide sensors.Each sensor is sensitive to a specific class of volatilecompounds. 1.0g dried laver powder was placed in a 50mL head space bottle and kept at 60℃ for 10 min for sta-bilization. The test project was set as following: 120s forwashing, 5s for sample injection, 90s for measurement.The gas flow rate was 200 mL min. Data acquisitioninterval was set at 1s. Data of a 10-s interval before theend of the test was collected and processed by usingbuilt-in software (WinMuster, Version 1.6.2) for principalcomponent analysis (PCA). 2.5 Volatile Compounds Detection Dried laver powder of 0.5 g was placed in a 20 mL headspace bottle and kept at 60℃ for 10 min. Then, Flavor-specR gas chromatography-ion mobility spectrometer(GC-IMS) (G.A.S. Technology Co., Ltd., Germany) wasused for the analysis of volatile compounds. According tothe NIST database and IMS database, the volatile sub-stances were determined and plotted in a diagram by us-ing the Gallery-Plot function of the built-in LaboratoryAnalytical Viewer (LAV) software. 2.6 Statistical Analysis SPSS 17.0 was used for the experimental data analysis.The results were represented by the mean±standard de-viation. The significance of difference was analyzed byDuncan multiple comparison method. P<0.05 indicates asignificant difference. 3 Results and Discussion 3.1 Taste Characteristic of Different Crops of Laver The response of the electronic tongue to different lavercrops is shown in Fig.1. All data are absolute output val- ues and the reference solutions (simulated artificial saliva)is the baseline. According to the Weber-Fechner’s law,when the intensity of a flavored substance changes by 20%, the human tongue can recognize this difference(Shigemoto, 2003). Therefore, the 20% intensity variationrange is defined as the taste unit. Fig.1 Taste characteristics of different Porphyra yezoensis crops. The different letters in the same category indicates sig-nificant difference (P<0.05). In terms of umami, the first laver crop has the highestintensity, while the sixth crop has the lowest, showing agradual decline. Umami taste was first proposed as a ba-sic taste by Kikunae Ikeda in 1909 when he founded thatbrown seaweeds contain large amount of free glutamicacid (Mouritsen et al., 2019). Umami is associated withdeliciousness and contributes a lot to the overall taste oflaver.The richness that can be considered as the aftertasteand durability of umami varies in a similar manner. Thesecond laver crop has the highest richness value, not thefirst crop. This is because the richness is not only relatedto the absolute content of the taste-related compounds,but also to the type of these chemicals. The second lavercrop richness is more intense, suggesting that the contentand variety of umami compounds may be different fromthe content and type of other crops. The salty taste of lavers is due to their seawater livingenvironment and absorption properties. The saltiness ofthe first and second crop was close, significantly higherthan the fourth and sixth crops (P<0.05). Salty taste ismainly produced by Na, K and other inorganic cations.These cations can enhance other tastes (Nakata et al.,1995), such as the stronger umami of the first crop andthe second crop. Bitterness and astringency are the negative tastes oflaver. The bitterness and astringency of the early lavercrops are relatively weak, which is contrary to the chan-ges in umami and richness. The intensity values of after-taste-bitterness and aftertaste-astringency are lower than1.0, which means the contribution to the taste is very little. Electronic tongues are able to detect single chemicalsas well as mixtures by means of electrochemical tech-niques and particular sensor membranes (Vlasov et al.,2002). Over the past 20 years, many types of electronictongues have been reported (Ciosek and Wroblewski,2007; Kobayashi et al., 2010). However, most are ex- perimental laboratory setups. The INSENT taste sensingsystem used in this study is one of the few devices com-mercially available. This system is a potentiometric mul-tichannel taste sensor and equipped with up to eight lipidmembrane sensors, each representing a gustatory stimulusor mouth feeling (Kobayashi et al., 2010). As an instru-ment to reduce the number of human taste tests, elec-tronic tongue has been widely used in the area of foodindustry, such as comparison of different products, qualityassessment, and quality control (Escuder-Gilabert andPeris, 2010). This study confirmed that the taste profile ofdifferent laver crops can be analyzed by the INSENTtaste sensing system conveniently and accurately. How-ever, electronic tongue will never be able to integrate allsensory, physiological and psychological aspects of hu-man taste sensation into a single analytical procedure.Therefore, there is still a long way to go to develop a ‘realartificial tongue’(Woertz et al., 2011). 3.2 Contents of Taste-Related Compounds inDifferent Crops of Laver Free amino acids and flavored nucleotides are the ma-jor taste related substances for aquatic products (Chenand Zhang,2007). In terms of laver, free amino acids playan important role in the presentation of overall taste. Thetotal amount of free amino acids in the first laver cropwas 4237.62 mg/100 g. The species of high content arealanine (Ala), glutamic acid (Glu), aspartic acid (Asp)and valine (Val). This is consistent with previous studieson brown algae, which concluded that the contents of Gluand Ala are significantly higher than other free aminoacids in konbu, bull kelp, wakame, macro kelp and seapalm (Mouritsen et al., 2019). The total amount of freeamino acids in the second crop was 3485.29 mg/100 g,which was significantly lower than the first crop (P<0.05), but the species and proportions were similar. The total amount of free amino acids in the fourth crop was2801.94mg/100g, and the high content of species wereAla, Glu,Val, Asp and threonine (Thr).No threonine wasdetected in the first and second crop. This amino acidmay be closely related to the physiological activity oflate-harvested laver. Changes in the ecological environ- ment such as temperature, salinity and illumination inten-sity will also affect the physiological components of laver.The total amount of free amino acids in the sixth crop wasas low as 1181.18mg/100g. Except for tyrosine (Tyr) andhistidine (His), the content of various amino acid is lowerthan that of the early harvested crops (Table1). Table 1 Free amino acid composition in different Porphyra yezoensis crops and their TAVs Amino Taste attribute acid Threshold (mg/100g) First laver crop Second laver crop Fourth laver crop Sixth laver crop Content TAV Content TAV Content TAV TAV Content (mg/100g) (mg/100 g) (mg/100g) (mg/100g) AspUmami (+) 100 365.47±1.013.65 296.18±0.97°2.96 98.52±1.23° 0.99 31.54±0.66"0.32 GluUmami (+) 30 1321.29±0.8744.041107.26±1.07°36.91794.37±2.01° 26.48 445.07±0.89 14.84 Gly Sweet (+) 130 18.37±0.33°0.14 23.40±0.19 0.18 21.16±0.17 0.16 7.82±0.270.06 AlaSweet (+) 60 2271.05±2.1837.851799.62±1.50°29.991537.26±1.38°25.79 500.94±2.018.35 Ser Sweet (+) 150 28.16±1.050.19 31.77±1.23° 0.21 30.55±0.65° 0.20 ND ND Thrr Sweet (+) 260 ND ND ND ND 95.36±0.71° 0.37 63.39±1.050.24 Phe BIitter (-) 90 12.71±0.30°0.14 16.84±0.19° 0.19 13.71±0.44' 0.15 11.52±0.320.13 TyrBitter (-) ND 8.22±0.45° ND 10.56±0.78 ND 11.62±0.60° ND 12.88±0.35*ND Hiss Bitter (-) 20 3.81±0.120.19 3.09±0.31° 0.15 3.20±0.23° 0.16 4.35±0.090.22 Leu Bitter (-) 190 23.29±0.620.12 26.83±0.55 0.14 20.77±1.18° 0.11 23.17±0.400.12 Ile Bitter (-) 90 12.35±0.090.14 13.18±0.27* 0.1512.17±0.25° 0.14 9.27±0.38°0.10 Val Sweet/Bitter (-) 40 119.31±0.46°2.98 110.55±0.64°2.76 105.27±0.92° 2.63 50.26±1.17"1.26 Met Bitter/Sweet/Sulfurous (-) 30 12.73±0.550.4214.95±0.22° 0.50 11.15±0.41 0.37 1.76±0.13*0.06 ArgBitter/Sweet (+) 50 28.20±0.220.5625.27±0.18° 0.5119.56±0.78° 0.39 17.52±0.830.35 LysSweet/Bitter (-) 50 12.66±0.13°0.25 17.59±0.18° 0.3517.27±0.57° 0.35 8.69±0.26°0.17 Total amount 4237.62±8.38° 3497.08±8.49° 2801.94±12.96° 1188.18±8.81 Notes:‘+’means pleasant;‘-’means unpleasant; “ND’means not detected; the different superscript letters in the same row indicates sig-nificant difference (P<0.05). Human perception of taste depends on the content ofthe flavored substances and its taste threshold.Taste ac-tive value (TAV) is widely used to evaluate the taste in-tensity of foods. When a compound has a TAV of lessthan 1.0, the corresponding substance contributes little tothe overall taste. When the TAV is greater than 1.0, thecorresponding substance has a positive contribution to thetaste (Gong et al., 2014). A higher value means greatercontribution. The amino acids that contribute greatly tothe taste of laver are Glu (umami) and Ala (sweet), whichis consistent with a very pleasant overall taste. The TAVsof Glu and Ala in the sixth laver crop were significantlylower than that of the early crops (P<0.05). This may beone of the reasons for the relatively mild taste of the laterharvested lavers. Adenosine monophosphate (AMP), inosine mono-phosphate (IMP) and guanosine monophosphate (GMP) are typical tasty nucleotides (Fuke and Ueda, 1996). Thecontents of umami-related nucleotides in different lavercrops and their TAVs are shown in Table 2. In all laversamples, the AMP content was at a low level and contrib-uted little to the taste. GMP has a limited contribution tothe taste and the TAVs are in the range of 0.96 to 2.19. Ofthe three nucleotides, IMP is the most contributing sub-stance to taste. It is known that only few seaweeds con-tain appreciable amounts of inosinate and laver is one ofthem (Mouritsen et al.,2019). The first crop had a TAV of5.06, the second crop was 5.49, the fourth crop was 2.33,and the sixth crop was 2.22. The second laver crop hasthe highest TAV, which may be related to higher richnessvalues, as shown in Fig.1. Flavored nucleotides and umami amino acids can pro-duce a synergistic effect, which has a considerable con-tribution to umami, usually measured by EUC. There Table 2 Contents of umami-related nucleotides in different Porphyra yezoensis crops and their TAVs Nucleotide Threshold First laver crop Second laver crop Fourth laver crop Sixth laver crop Content Content Content Content (mg/100g) TAV TAV TAV TAV (mg/100g) (mg/100g) (mg/100g) (mg/100g) AMP 50 22.18±0.09° 0.44 20.24±0.12° 0.40 19.78±0.37° 0.40 13.17±0.11 0.26 IMP 25 126.52±0.13° 5.06 137.28±0.22" 5.49 58.31±0.26 2.33 55.56±0.28° 2.22 GMP 12.5 27.38±0.20° 2.19 20.39±0.45° 1.63 16.33±0.93° 1.31 11.99±0.50" 0.96 Note: The different superscript letters in the same row indicates significant difference (P<0.05). have been some research reports on EUC of fish andshrimp, such as Pseudosciaena crocea (Zhou and Wang,2019), Euphausia superba and Exopalaemon carinicauda(Cao et al.,2018). However, little literature about EUC ofalgae is available. The EUC of first, second, fourth andsixth laver crop was 318.43 gMSG/100g, 259.20gMSG/100g, 97.70gMSG/100g and 46.86gMSG/100g, respec-tively. This continuous reduction in EUC is consistentwith the conclusions reached by the electronic tongue. Inaddition to free amino acids and flavored nucleotides,peptides, inorganic ions, organic acids and some othersubstances can also have an effect on the taste (Maehashiet al., 1999). Therefore, more in-depth research is needed. 3.3 The Overall Odor Differences Among DifferentLaver Crops Electronic nose is mainly composed of an odor sampler,a gas sensor array and a signal processing system (Perisand Escuder-Gilabert, 2009). The PEN-3 electronic noseused in this study is equipped with 10 sensors, corre-sponding to different types of volatile compounds, suchas aromatic ingredients, nitrogen oxygen compounds,alkanes, sulfide,etc. Principal component analysis (PCA)is used to process the raw data collected by the electronicnose. Longitudinal and transverse axis were denoted as yand x axis, respectively (Fig.2). The percentages of data Fig.2 Results of principal component analysis of different Porphyra yezoensis crops by E-nose. variability explained by PCi and PC2 were 91.02% and8.60% respectively, which means that PC and PC2 coverthe sample information. For the four laver samples, thereis a clear distinction between the electronic nose signalregions. The first crop and the second crop having similarodors tended to closely distribute the distance on thetwo-dimensional graph, while the signal regions corre-sponding to the fourth crop and the sixth crop are distant.At present, electronic nose technology has been widelyused in aquatic species identification (Zhang et al., 2012),freshness assessment (Han et al, 2013) and qualityevaluation (Wilson et al., 2013). The experimental data ofthis study show that the electronic nose can distinguishdifferent laver crops. 3.4 Volatile Compounds of Different Laver Crops Volatile substances play an important role in the overallflavor of food, and affect consumers acceptance of theproducts greatly (Werkhoff et al., 1998). Previous studieshave confirmed that there is a significant correlation be-tween nori (dried laver) quality and volatile compounds,using a gas chromatography-mass spectrometer (GC-MS)(Miyasaki et al., 2014). GC-MS has been widely used anddemonstrated as a powerful analytical method for the Fig.3 Gas chromatography-ion migration spectrum graph ofP. yezoensis. Each point represents a volatile compound, thecolor depth and area indicate concentration. determination of volatile compounds in complex samples.However, GC-MS has some disadvantages, such as highrequirements for the pretreatment of samples, long detec-tion time, expensive equipment and high maintenancecost. Gas chromatography-ion migration spectrometer(GC-IMS) provides a convenient alternative for the de-tection of volatile compounds, due to its excellent selec-tivity and sensitivity, high speed of analysis, small size,and low power consumption as demonstrated by a seriesof publications (Snyder et al., 1993; Kanu and Hill, 2008;Gerhardt et al., 2018). Furthermore, because IMS sepa-rates ions based on mobilities rather than mass, selectivedetection among compounds of the same mass but dif-ferent structures are possible (Gerhardt et al., 2018). Inthis study, GC-IMS was used to analyze the volatilecompounds of lavers. GC-IMS separated and identified36 volatile components (Fig.3.) from laver, mainly in- cluding aldehydes, ketones, alcohols, esters, acids andaromatic substances. The differences in volatile substances of different lavercrops are shown in Fig.4. The concentrations of somecompounds (mainly alcohols) were relatively stable in allfour samples, such as citronellol, linalool oxide, 2-ethyl-1-hexanol, 1-phenylethanol, trimethylpyrazine, ethanoland acetone. However, due to the higher threshold value(Anupam et al., 2010), these substances contributed littleto odor. As the harvest period increases, the concentrationof most volatile acid substances in the laver declines.such as pentanoic acid, butanoic acid and 3-methylbutyricacid. The concentration of butyrolactone and hexanol alsoshowed a significant decrease. The concentrations of non-anal (grassy smell), octanal (grease smell), hexanal (fishysmell) and benzaldehyde (almond smell) in the first andsecond crops are higher, and the threshold value (Fratini Citronellol The first crop The second crop The fourth crop Fig.4 The major volatile compounds of different P. yezoensis crops. The color depth represents concentration of the volatilecompound; M means monomer; D means dimer. et al., 2012) of these aldehydes is at a very low level.Therefore, these aldehydes are important for the odor oflaver. These findings are consistent with those of Mi-yasaki et al. (2014), who pointed out that excellent-gradelaver products were characterized by higher content ofoctanal. The concentration of some ketones in the lateharvested laver samples tends to increase, such as cyclo-hexanone and 2-3-butanedione. In the sixth crop, 1-Oc-ten-3-ol (mushroom smell),, malondialdehyde (cocoasmell), heptanal (sweet smell) compounds which havesignificant contribution to odor (Na and Hong, 2012) alsohave a relative high content. The concentration of othercompounds fluctuated with the harvest period, such asmaltol, 2-butanone, 2-ethylfuran and phenylacetaldehyde.Phenylacetaldehyde has a grassy and flower smell (Franket al.,2009), which contributes a lot to the pleasant odoroflaver. 4 Conclusions In this study, the flavor characteristics of different lavercrops during a harvest cycle were determined by elec-tronic tongue, electronic nose and gas chromatography-ion mobility spectrometer. According to the experimentaldata, early laver crops have a stronger intense umamitaste, a more pleasant odor and higher free amino acidsand flavored nucleotides content, making them moresuitable for producing seasonings and recreational sea-weed products. The results of this study can provide ref-erences for the high-valued and efficient utilization oflavers. Acknowledgements This work was supported by the National Key R & DProgram of China (No. 2018YFD0901004), the SpecialFun- ds for the Technology System of Modern Agricul-tural Industry (No. CARS-50), and the Central Public-interestScientificInstitutionBasal ResearchhFund.YSFRI, CAFS (No. 20603022020013). References ( Alasalvar, C., Pelvan, E., Bahar, B., Korel, F., and Olmez, H., 2015. Flavour of n a tural and roasted turkish hazelnut varieties (Corylus avellana L . ) b y d e scriptive s e nsory analysis, e l ec- tronic nose and chemometrics. I nternational Journal of Food Science & Technology, 47 (1): 122-131. ) ( Anupam, G., K a zufumi, O., and Toshiaki, O., 2010. Ide n tifica-tion and characterization of headspace volatiles of fish miso, a Japanese fish m eat b a sed fermented paste, with special em- phasis on effect of fish species and meat washing . Food Che-mistry, 120 (2):621-631. ) ( Cao,R., Z h ao, L., Sun, H. , and Li u , Q., 20 1 8. Nutritional char- acteristics and umami assessment of Euphausia superba a nd Exopalaemon carinicauda. F o od Science, 7 (5): 1 49-153. ) ( Chen, D . W., and Zhang, M., 2007. Non-volatile t a ste activecompounds i n t h e m e at of Chinese mi t ten cr a b (E r iocheirsinensis). Food Chemistry, 104 (3): 1200-1205. ) ( Cheong, K. W., Tan, C. P., Mirhosseini, H. H amid, N. S. A ., ) ( Osman, A., and Basri, M . , 2010. E q uilibrium h e adspaceanalysis of volatile flavor compounds extracted from soursop (annona m uricata) using solid-phase microextraction. Food Research International, 43 (5): 1270-1276. ) ( Cheong, K. W., Tan, C. P. , M irhosseini, H., Chin,S. T., Man, Y. B. C ., and Hamid, N. S. A., 20 1 1. Op t imization of e quilib-rium h eadspace analysis of volatile flavor compounds of ma- laysian soursop (Annona m u ricata): Comprehensive two-di-mensional gas c hromatography t i me-of-flight m ass spec-trometry (GCxGC- T OFMS). Fo o d Chemistry, 12 5 (4): 1 4 81-1489. ) ( Cheung, I . W. Y . , and L i -Chan, E. C. Y. , 2014. Ap p lication oftaste sensing system f or characterization of enzymatic h ydro-lysates from shrimp processing by-products. Food Chemistry,145 (7):1076-1085. ) ( Cho, W . I., and Sang, M. K ., 2014. Taste compounds and bio-functional activities of the sandy beach clam h ydrolysate forthe shellfish flavoring condiment. J ournal o f Aquatic FoodProduct T echnology, 25(1):24-34. ) ( Ciosek, P ., and Wroblewski, W . , 2007. Sensor arrays for li q uid sensing-electronic t ongue systems. Analyst, 1 3 2 (10):96 3 . ) ( Criado-Garcia, L ., A rce, L., and V a lcárcel, M . , 2016. So l id phase e xtraction to enhance s ensitivity when h eadspace-gas chromatography-ion mobility sp e ctrometer is used: De t ermi-nation of phenol i n environmental s a mples. A n alytical Meth-ods, 8 (27):5388-5397. ) ( E scuder-Gilabert, L., a nd Peris, M ., 2 010. Review: Highlights inrecent applications of electronic tongues in food a nalysis. Analytica Chimica Acta, 665 ( 1 ) : 15-25. ) ( Fuke S ., and Ueda Y ., 1996. Interactions betwee n umami and other flavor characteristics . Trends in Food Science & T e ch- nology,7(12): 407-411. ) ( Francois, L ., P ascal, T., N athalie, K ., F rederic, N., Pierre, M.,Ossarat, K., Jean, L. B. , and Guillaume, D ., 2 012. E volutionof volatile odorous compounds during the storage o f Euro-pean s eabass ( Dicentrarchus l abrax). Food Chemistry, 131 (4):1304-1311 . ) ( Frank, D., Poole, S . , and Kirchhoff, S. , 20 0 9. Investigation ofsensory a nd volatile c haracteristics of farmed a nd wild b a r- ramundi (Lates calcarifer) u sing g as c hromatography-olfac- tometry m ass s p ectrometry and descriptive se n sory analysis. Journal of Agricultural and Food Chemistry, 57 (21): 10 3 02-10312. ) ( Fratini, G., Lois, S., and P azos, M . , 2012. Volatile profile ofAtlantic shellfish speci e s by HS-SPME GC/MS. F o od Re - search International, 48 (2):856-865. ) ( Fujimaki, M., Arai, S., Yamashita, M . , Kato, H. , and Noguchi,M., 2014. Taste peptide fractionation f rom a fish protein hy-drolysate. Journal of the Agricultural Chemical Society of Ja-pan, 37(12):8. ) ( Gerhardt, N ., B irkenmeier, M ., S chwolow, S . , R o hn, S . , andWeller, P., 2018. Volatile-compound f i ngerprinting by head-space-gas-chromatography ion-mobility spectrometry (HS- GC-IMS) as a b enchtop alternative to ' H NM R prof i ling for assessment of the authenticity of honey. Analytical C h emistry, 90 (3):1777-1785. ) ( Gong, J., Tao, N. P ., and Gu, S. Q., 2014. Overview of umami substance in f ood a nd i ts detection methods. C hina Condi- ment,39(1): 1 29-135. ) ( Han, F., H uang, X . , and T e ye, E., 2013. Nondestructive detec- tion of fish freshness d uring its p reservation b y combining electronic nose and e lectronic tongue t echniques in conjunc- tion with chemometric analysis. Analytical Methods, 6 ( 2 ) : 529-536. ) ( Hayashi, T., Yamaguchi, K., and Konosu, S ., 2010. S ensoryanalysis of taste-activ e components i n t he extract of boiled snow crab meat. Journal ofFood Science, 46 (2): 479-483. ) ( Jimenez-Escrig, A., Gomez-Ordonez, E., and Ruperez, P., 2011. Seaweed as a source of novel nutraceuticals: Su l fated po l y-saccharides and peptides. Advances i n F ood and NutritionResearch, 64:325-337. ) ( Kanu, A . B., a nd Hill, H. H.,2008. Ion mobility spectrometry detection for gas chromatography. J ournal of Chromatogra- phy A, 1 177 (1): 1 2-27. ) ( Kobayashi, Y., Habara, M . , Ik e zazki, H. , Ch e n, R., Naito, Y., and T oko, K.,2010. Advanced taste sensors based on arti f icial lipids with global selectivity to basic t a ste qualities and highcorrelation to sensory scores.Sensor, 10 (4):3411-3443. ) ( Li, C. P., Wu, J. J., and Li, Y., 2013. Identification of the aromacompounds in stinky mandarin fish (Siniperca chuatsi) andcomparison o f volatiles during f e rmentation and st o rage. In-ternational Journal of Food Science & T e chnology, 4 8 (11): 2429-2437. ) ( Maehashi, K., M atsuzaki, M., and Y a mamoto, Y., 1999. Iso l a-tion of peptides from an enzymatic hydrolysate of food pro- teins and characterization o f their taste properties. Journal ofthe Agricultural C hemical Society of Japan,63 (3): 55 5 -559. ) ( Miyasaki, T., Ozawa, H., Banya,H., Tanaka, H., Usui, M., andHanaoka, K., 2014. Discrimination of excellent-grade ‘ nori ’ ,the dried Laverporphyra s p p. w i th a n alytical m ethods f o rvolatile compounds. F i sheries Science, 80 (4): 827-838. ) ( Mouritsen, O. G., Duelund, L., Petersen, M. A., H a rtmann, A. L., and F rost, M. B ., 2019. Umami taste, free amino acid compo- sition, and volatile compounds of brown seaweeds. Journal of Applied Phycology,31:1213-1232. ) ( Na, S ., and H ong, S., 2 012. Identification of odour-active com-pounds in dried and r oasted nori (Porphyra yezoensis) using asimplified gas chromatography-SNIF technique. Flavour and Fragrance Journal,27(2): 1 57-164. ) ( Nakamura, E., 2 011. One hundred years since t he discovery ofthe‘umami'taste f r om seaweed br o th by Kikunae Ikeda, who transcended his time. Chemistry-An A sian J ournal, 6 ( 7):1659-1663. ) ( Nakata, T ., Takahasi, M., Nakatani, M., K uramitsu, R., Tamura,M., and O kai, H ., 1 995. R ole of basic and acidic fragments i ndelicious peptides (Lys-Gly-Asp-Glu-Glu-Ser-Leu-Ala) a nd ) ( the taste behavior o f sodium a n d potassium salts in acidic oli- gopeptides. Bioscience B iotechnology and B i ochemistry, 5 9 (4):689-693. ) ( P eris, M., a nd Escuder-Gilabert, L., 2 0 09. A 21st century tech-nique f or f ood control: E lectronic n oses. A nalytica ChimicaActa, 638(1): 1 -15. ) ( Shigemoto, K ., 2 003. W eber-Fechner’s l a w a n d demand func- tion. Microeconomics, 9: 41-46. ) ( S nyder, A. P . , Harden, C. S., B r ittain, A. H., Man, G. K. , Arnold, N. S ., and Meuzelaar, H . L. C ., 1 993. P ortable hand-held gaschromatography/ion mobility spectrometry device. Journal ofAnalytical Chemistry, 65 ( 3): 299-306. ) ( Varlet, V., Knockaert, C., Prost, C., and S erot, T ., 2006. C om-parison of odor-active volatil e compounds of f resh a nd smoked salmon. Journal of Agricultural and Food Chemistry,54(9):3391-3401. ) ( Vlasov, Y., Legin, A., and Rudnitskaya, A., 2002. Electronic tongues a nd their analytical application. Analytical and Bio- analytical Chemistry, 373 ( 3 ): 136-146. ) ( Werkhoff, P., Giinter t , M., Krammer, G. , Sommer, H., andKaulen, J., 1998 . Vacuum headspace method in aroma re-search: F lavor chemistry o f yellow pa s sion fruits. Journal ofAgricultural and Food Chemistry, 46 (3): 1 076-1093. ) ( Wilson, A. D., Oberle, C. S . , and Oberle, D. F., 2013.De t ectionof off-flavor i n c atfish u sing a conducting polymer electro-nic-nose technology. Sensors, 13 (12) : 15968-15984. ) ( Woertz, K ., T i ssen, C ., K l einebudde, P. , a n d Br e itkreutz, J . , 2011. T aste sensing systems (electronic tongues) fo r pharma-ceutical applications. I nternational Journal of Pharmaceutics, 417:256-271. ) ( Zhang, M., Wang,X., and Liu , Y., 2012. Species discriminationamong t h ree kinds o f puffer fish u sing an e lectronic nosecombined w i th olfactory sensory evaluation. S e nsors, 1 2 (9): 12562-12571. ) ( Zhao, L ., Cao, R ., Wang, L. Z., a nd L iu, Q .,2018. N u tritional analysis and umami a s sessment of Pyropia yezoensis from Jing Bay. Progress in Fishery Science, 39 (6):134-140. ) ( Zhou, F. , and W ang, X., 2 0 19. Effect o f heat extraction on wa-ter-soluble t aste substances i n p r ocessing products of chilledlarge yellow croaker (Pseudosciaena crocea). Food Science& Nutrition, 7 (12):3863-3872. ) ( (Edited by Ji Dechun) ) Springer 研究内容:利用电子舌、味觉相关化合物、电子鼻和气相色谱-离子迁移谱仪对第一、二、四、六种紫菜(Porphyra yezoensis)的味道和气味进行了分析。通过电子舌的检测,早期作物的鲜味、丰富度等令人愉悦的味道更加强烈,这与游离氨基酸和风味核苷酸的分析结果相一致。电子鼻能清楚地区分不同的紫菜作物。GC-IMS从紫菜中分离鉴定出36种挥发性成分,主要包括醛类、酮类、醇类、酯类、酸类和芳香类物质。对于早期收获的作物,壬醛、辛醛、己醛和苯甲醛对气味的贡献较大,因为这些化合物的浓度高,阈值低。后期收获的作物,大部分酮类和部分醛类的含量增加。1-辛烯-3-醇、丙二醛和庚醛构成了主要的气味特征。主要检测设备: 电子舌 TS-5000Z 日本INSENT公司 电子鼻 PEN 3 德国AIRSENSE公司文献基本信息:
关闭-
1/8
-
2/8
还剩6页未读,是否继续阅读?
继续免费阅读全文产品配置单
北京盈盛恒泰科技有限责任公司为您提供《紫菜中风味特征检测方案(感官智能分析)》,该方案主要用于水产品中理化分析检测,参考标准《暂无》,《紫菜中风味特征检测方案(感官智能分析)》用到的仪器有德国AIRSENSE品牌PEN3电子鼻。
我要纠错
推荐专场
感官智能分析系统(电子鼻/电子舌)
更多
相关方案
 咨询
咨询