低固体污泥(LSS)、脱 水污泥(DS)和高固体 污泥(HSS)pH测定中样品的振荡
检测样品 土壤
检测项目 物理指标
参考标准 HJ 962-2018 土壤 pH值的测定 电位法


方案详情文
智能文字提取功能测试中
评价全过程中限制沼气生产和提高沼气生产效率的因素Evaluation of the factors limiting biogas production in full-scale processes and increasing the biogas production efficiency1克污泥与4ml蒸馏水混合,混合物在格哈特Laboshake振荡器上150rpm振荡1小时To measure pH,1.0 g of sludge was mixed with 4 mL of distilled water, and the mixture was shaken for 1 h at 150rpm (Laboshake;Gerhardt,Königswinter,Germany).Environmental Science and Pollution Research (2020) 27:28155–28168https://doi.org/10.1007/s11356-020-09035-1RESEARCH ARTICLE Environ Sci Pollut Res (2020) 27:28155–2816828156 Evaluation of the factors limiting biogas production in full-scale processes and increasing the biogas production efficiency Afamia I. Kouzi1 &Matti Puranen2 &Merja H. Kontro1 Received: 17 September 2019 /Accepted: 22 April 2020/ Published online: 15 May 2020# The Author(s) 2020 Abstract Biogas production from sewage sludge volatile solids (VS) by anaerobic digestion slows down towards the end of the process, among inhibitory factors being pH increase upon ammonia accumulation, poorly digestible biomaterials, and high fixed solid (FS) content. The possibility of concentrating the digested sludge VS (41.7–56.6%on a dry weight basis) by surface and bottom layer separation with biogas post-production was studied. Furthermore, the potential to recycle concentrated VS and digested sludge back to the process after adjusting pH 7.0 to optimal for biogas-producingmicrobes and after acid, alkali, thermal, and sonolytic treatments was examined. In general, pH 7.0 control alone improved biogas production from the recycled digested sludge themost. An equally good improvement in biogas production was achieved by recycling the digested sludge, which had been heated until ammonia had evaporated and the pH dropped to 7.0 (1–2 h, 75 °C), and at the sametime,VS was degraded. The biogas production fromthe sonicated and recycled sludge was almost as good as fromthe pH-adjusted, or heat-treated recycled sludge. After the acid and base treatments of the digested sludge, the recycled sludge yielded often the lowest biogas volume, as the added chemicals increased the FS concentration, which proved to be amore important inhibitory factor than poorly degrad-able VS. The high FS content significantly reduced the benefits of the treatments. By separating the surface and bottom layers with biogas post-production, the surface layer of VS was concentrated to 51.6–61.8%,while different compositions of the layers affected the biogas production. Keywords Digested sludge . Post-treatment . Volatile solids . Fixed solids . pH changes . Layer separation Abbreviations KW Kruskal-Wallis test BDS Bottom layer of DSLSS Low solid sludge BHSS Bottom layer of HSSPCA Principal component analysis BLSS Bottom layer of LSSRMA Repeatedmeasures ANOVA BP Biogas plantSDS Surface layer of DS DS Dewatered sludgeSHSS Surface layer of HSS E1 Experiment 1SLSS Surface layer of LSS E2 Experiment 2VS Volatile solids FS Fixed solidsWWTP Wastewater treatment plant HSS High solid sludge MW Mann-Whitney test Responsible editor: Ta YeongWu * Merja H. Kontro merja.kontro@helsinki.fi 1 Faculty of Biological and Environmental Sciences, Ecosystems and Environment Research Programme, University of Helsinki, Niemenkatu 73, 15140 Lahti, Finland 2 Labio Ltd, Sapelikatu 7, 15160 Lahti, Finland Introduction The risk of hazardous compounds limits the utilization of sewage treatment plant sludge, biogas production being one of the most common applications (Chen et al. 2008; Chen et al. 2014; Tyagi and Lo 2011). Indeed, anaerobic digestion for thermal and electrical renewable energy purposes has be-comea well-established technology in the wastewater effluent treatment worldwide. The microbial process converts wastewater sludge volatile solids (VS) into biogas; other pos-sible substrates includemanure, energy crops, andmunicipal solid waste (Appels et al. 2008; Gaida et al. 2017; Weiland 2010). Anaerobic biogas production is a four-stagemicrobial process consisting of hydrolysis, acidogenesis, acetogenesis/dehydrogenation, and methanation, of which hydrolysis is considered to be the rate-limiting step (Nguyen et al. 2015; Weiland 2010; Feki et al. 2015; Grübel and Suschka 2015). Biogas-producing bacteria mainly belong to phyla Proteobacteria, Firmicutes, and Bacteroidetes, while themost common archaeal bacteria related tomethane production be-long to orders Methanomicrobiales ,Methanosarcinales , Thermoplasmatales , and Methanobacteriales (Goswami et al. 2016; Han et al. 2019). The final biogas product consists mainly ofmethane (60–70%inmaximum)and carbon dioxide (Appels et al. 2008). The VS concentration decreases during the anaerobic di-gestion due to biogas production, thereby concentrating the inhibitory or even toxic substances of the waste streamand the intermediates ofmicrobialmetabolism. The accumulation of inhibitory compoundsmay eventually prevent biogas produc-tion, such as inorganic ions, heavymetals, and ammonia and hydrogen that affect pH (Appels et al. 2008; Chen et al. 2008; Chen et al. 2014).Microorganisms require inorganic ions for growth, though theymay affect growth rate and become toxic at high concentrations (Appels et al. 2008; Chen et al. 2008). For heavy metals, toxic concentrations have been estimated (Bååth 1989; Giller et al. 1998). Methanogens are the least tolerant for pH rise due tomicrobial degradation of proteins and urea to ammonia (Appels et al. 2008; Chen et al. 2008). The optimal pH range for the high solid sludge digestion is between 6.0 and 8.5 (Chen et al. 2007; Lay et al. 1997; Weiland 2010). Nevertheless, the relative importance of these various inhibitory factors in ending biogas production is not well known, although biogas production is a very common process (Zhang and Li 2019). Biogas-producing microorganisms first consume easily available nutrients and then those that are more difficult to digest (Carrère et al. 2010;Weiland 2010). Therefore, a sub-stantial fraction of the organicmaterial in the final stages of biogas production is poorly microbiologically degradable, consisting of cellulose, hemicellulose, lignin, and other com-plex organic structures such as hair (Chen et al. 2007; Chen et al. 2008; Tyagi and Lo 2011; Weiland 2010). Enhanced digestion of poorly biodegradable organic compounds at the end of biogas production would enable VS to be recycled back into biogas production and improved recovery of organicma-terial. Techniques that have been reported to improve the hy-drolysis of difficult-to-decompose organic fractions and in-crease bacterial biogas production include acid or alkali treat-ment, thermal treatment, and sonication (Apul and Sanin 2010; Barber 2016; Carrère et al. 2010; Tyagi and Lo 2011; Zhang et al. 2010; Zhang et al. 2016; Chiu and Lo 2016). However, the effectiveness of these differentmethods in im-proving biogas production over, for example, pH control alone is difficult to compare, as different VS hydrolysis tech-niques have rarely been compared under the same conditions with the same slurry batches. An alternative approach would be the concentrating VS to circumvent the above-presented inhibitory conditions. One such method would be flotation, in which solids are lifted to the surface by attaching to gas bubbles, followed by recovery (Rubio et al. 2002). The pos-sibility of utilizing biogas post-production in flotation (Zeng et al. 2019) to concentrate VS for hydrolysis and recycling back to biogas production has not been studied. Against this background, the hypothesis of the research was that surface and bottom layer separation with post-produced biogas may concentrate VS and, after digestion, they can be recycled to increase biogas production. Furthermore, it was hypothesized that VS transformation to biogas can be improved by the following post-treatments: pH adjustment, and digesting difficult-to-decompose organic fractions, combined with recycling back into the process. The VS digestion methods used were acid/alkali, thermal, and sonolytic treatments. 低固体污泥(LSS)、脱 水污泥(DS)和高固体 污泥(HSS) Materials andmethods Samples and chemical analyses Low solid sludge (LSS) and dewatered sludge (DS) were col-lected in Lahti Aqua Ltd. wastewater treatment plant (WWTP, Lahti, Finland), and high solid sludge (HSS) was collected in Labio Ltd. biogas plant (BP, Lahti, Finland), all immediately after biogas production.WWTP produced biogas in low solid process and BP in high solid biogas production process. The sewage sludge was used as a rawmaterial in both processes, and BPmixed the source-separated biowaste with the sewage sludge in a ratio of about 3:1. For experiment 1 (E1), the LSS was aerated after biogas production, but not for experiment 2(E2). Aeration reduces microbial biogas-producing activity. Samples for E1 were collected on November 29, 2017, and those for E2 on February 7, 2018. On the sampling day, the sludges were weighed for total (TS), fixed (FS), and volatile (VS) solid analyses; for pHmeasurements; element analyses, surface, and bottomlayer separations; and formeasuring time-dependent changes in sludge pH (experiment 3, E3). Then, the sludges were frozen at − 20 °C for biogas production experiments. TS (heating for 20 h at 105 °C), FS, and VS (heat treatment for 4 h at 550 °C) of the sludges were determined in triplicate as presented earlier (Kerminen et al. 2018). Tomeasure pH,1.0 g of sludge wasmixed with4mLofdistilled water, and the mixture was shaken for 1 h at 150 rpm(Laboshake; Gerhardt, Königswinter, Germany). Then, the liquid was separated by centrifugation at 2027 rpm (Heraeus 1S-R with 75002002rotor, DJB Labcare, Buckinghamshire, UK; 3000×g ,10 min), and pH was measured using InoLab series pH 720 m (Weilheim, Germany) (Kurola et al. 2011). Alternatively, pH was measured using the pH paper (Fisher Scientific, Hampton, NH, USA). Carbon and nitrogen were determined using LECO CNS-2000 elemental analyzer (LECO Corporation, St. Joseph,MI, USA) as presented pre-viously (Talja et al. 2008). Tomeasure the elements Al, Co, Cr, Cu,Mn, Ni, Fe, Zn, P, V, and Pb, the sludge was treated with nitric acid in a MARS 6 microwave digestion system according to the manufactures instructions (CEM Corporation,Matthews, NC, USA). Then, the samples were diluted with water to a nitric acid concentration of 2% (vol/vol), and the elements were measured using the Sciex Elan 6000 ICP-MS equipment (Perkin Elmer Inc.,Waltham,MA, USA). Themethod is based on standards (SFS-ISO 17294-12004; SFS-EN ISO 17294-2 2016). Surface and bottom layer separation For E1, to separate surface and bottomlayers by biogas post-production, 2.0 L of LSS (wet weight (wt) 2010 g; TS,51 g) was transferred to a 6-L plastic container. A 1.0-L volume of DS (wet wt, 600 g; TS, 159 g) and HSS (wet wt, 885 g; TS, 175 g) was mixed with 1.5 L of distilled water in 6-L plastic containers. The sludges in triplicate were incubated at the room temperature of 21± 2 °C for 40 days. The surface layers were collected, waterwasseparatedbycentrifugationat2027rpm (3000×g , 10 min), and the sludges were frozen at −20 °C for the biogas production experiment. For E2, to separate surface and bottom layers, 2.0 L of LSS (wet wt, 1930 g; TS, 70 g) was transferred to a 3-L plastic container. DS (wet wt, 600 g; TS, 161 g) and HSS (wet wt, 885 g; TS, 208 g) of 1.0 L were mixed with 1.5 L of distilled water and incubated in 3-L plastic containers, all at the room temperature of 21 ± 2 °C in triplicate. The surface and bottom layers were collected after 28 (HSS, surface layer 7.4 g dry wt,bottom layer281gdrywt)and33days(LSS, surface layer 10.3 g dry wt; bottom layer 89.6 g dry wt;DSsurfacelayer,32.9gdrywt;bottom layer,320 g dry wt); water was removed by centrifugation at 2027 rpm(3000×g , 10min), and the sludges were frozen at −20 °C for the biogas production experiment. To follow the surface and bottom layer separation, another set of similar incubations in triplicate was done from DS and HSS, and the samples were collected from bottom and surface layers after 5, 12, 19, 26, and 28 days. Biogas production All biogasmeasurements were done in triplicate, and biogas yield was calculated asmL of biogas/g of VS on a dry weight basis. In E1, to measure biogas production, the methane-producing microbial community of the WWTP was trans-ferred to 20-mL syringes in 10mL of LSS, with and without pH 7.0 adjustments. Then acid- or alkali-treated and acid- or alkali-neutralized sludges were recycled to the LSS with pH 7.0. The LSS properties were as follows: pH, 9.0; TS, 2.5 ±0.1%; VS, 45.6 ± 0.1% of TS; FS, 54.4 ± 0.1% of TS. The quantities of TS, VS, and FS in the sludges of E1 and the VS substrate to inoculum ratios (S/I ratios) are presented in Table 1. The average of VS S/I ratios was 0.76 ± 0.31 in E1, and the ratio ranged between 0.41 and 1.24; i.e., changes in the ratiosmay have hadminor effects on biogas production, which has been the best close to S/I ratio of 1:1 (Córdoba et al.2018). Biogas production wasmonitored fromthe increase in gas volume in an airtight syringe with a flexible piston for 24 days at 37 °C (model C25KC incubator shaker, New Brunswick Scientific Co., Edison, NJ. USA). In E2, tomea-sure biogas production, the WWTP methane-producing mi-crobial community was transferred to a 20–50-mL syringe in 5mLofLSS, with and without pH 7.0 adjustment. The treated sludges (acid/alkali treatment, thermal treatment, sonication) were recycled to the LSS with pH 7.0. The LSS properties were as follows: pH, 7.9; TS, 3.7 ± 0.1%; VS, 54.6 ± 9.1%of TS; FS, 45.4 ± 9.1%of TS. The quantities of TS, VS, and FS in the sludges of E2, and the VS S/I ratios are presented in Table 1. The average VS S/I ratios were 1.52 ± 0.89 in E2, and the ratio ranged between 0.54 and 2.90. Biogas production at 37 °C and under 30 rpm shaking was followed for 14 days. Digested sludge post-treatments to improve biogas production All experiments were done in triplicate. TS, VS, FS, and wet weights of sludges in the treatments were as presented in Table 1. In E1, the LSS volume was 10mL (digested sludge collected after aeration) in biogas production experiments, and the sludge treatments in the first experiment were pH 7.0 ad-justment and acid and alkali hydrolysis. In E2, the LSS vol-ume was 5mL (digested sludge collected prior to aeration) in biogas production experiments, and the treatments were as follows: pH 7.0 adjustment; acid and alkali hydrolysis; ther-mal treatment; and sonication. pH adjustment In E1, the initial pH values of the LSS, DS, and HSS were 9.0,8.0, and 10.0, respectively. Biogas production in the sludges (LSS bacterial inoculum10mL) wasmeasured with and with-out pH 7.0 adjustment. In E2, the initial pH values of the LSS, Table 1 Total solid (TS), volatile solid (VS), and fixed solid (FS) concentrations; wet weights; and/or substrate to inoculum VS ratios (S/I ratio) of sludges in treatments, and in biogas production experiments. Values are presented as average ± S.D (n = 3) Sludges in treatments Wet weight TS (g dry weight) VS (g dry weight) FS (g dry weight) Experiment 1 (E1) Low solid sludge (LSS) 10mL 0.251 ± 0.009 0.115 ± 0.004 0.136 ± 0.005 Surface layer of LSS (SLSS) 1.0 g 0.092 ± 0.004 0.047 ± 0.001 0.045 ± 0.003 Dewatered sludge (DS) 1.0 g 0.263 ± 0.001 0.142 ± 0.001 0.121 ± 0.001 Surface layer of DS (SDS) 1.0 g 0.143 ± 0.007 0.076 ± 0.004 0.067 ± 0.003 High solid sludge (HSS) 1.0 g 0.197 ± 0.003 0.091 ± 0.001 0.106 ± 0.003 Surface layer of HSS (SHSS) 1.0 g 0.151 ± 0.061 0.071 ± 0.013 0.080 ± 0.072 Experiment 2 (E2) Low solid sludge (LSS) 5.183 0.183 ± 0.002 0.099 ± 0.016 0.083 ± 0.017 Surface layer of LSS (SLSS) 1.305 0.100 0.053 ± 0.001 0.047 ± 0.001 Bottom layer of LSS (BLSS) 1.044 0.100 0.053 ± 0.001 0.047 ± 0.001 Dewatered sludge (DS) 1.869 0.500 0.283 ± 0.002 0.217 ± 0.002 Surface layer of DS (SDS) 1.616 0.200 0.111 ± 0.002 0.089 ± 0.002 Bottom layer of DS (BDS) 1.570 0.200 0.111 ± 0.001 0.089 ± 0.001 High solid sludge (HSS) 2.125 0.500 0.208 ± 0.008 0.292 ± 0.008 Surface layer of HSS (SHSS) 1.463 0.200 0.103 ± 0.013 0.097 ± 0.013 Bottom layer of HSS (BHSS) 1.412 0.200 0.163 ± 0.048 0.337 ± 0.048 Sludges in biogas production experiments S/I ratio TS (g dry weight) VS (g dry weight) FS (g dry weight) Experiment 1 (E1) 0.251 ± 0.009 0.115 ± 0.004 0.136 ± 0.005 Low solid sludge (LSS) 0.41 ± 0.01 0.343 ± 0.011 0.162 ± 0.005 0.181 ± 0.006 Dewatered sludge (DS) 1.24 ± 0.04 0.257 ± 0.005 0.514 ± 0.009 0.257 ± 0.004 Surface layer of DS (SDS) 0.66 ± 0.03 0.394 ± 0.014 0.190 ± 0.007 0.204 ± 0.007 High solid sludge (HSS) 0.79 ± 0.03 0.448 ± 0.010 0.206 ± 0.003 0.242 ± 0.007 Surface layer of HSS (SHSS) 0.62 ± 0.13 0.402 ± 0.070 0.186 ± 0.011 0.216 ± 0.076 Experiment 2 (E2) 0.083 ± 0.017 Low solid sludge (LSS) 0.54 ± 0.08 0.282 ± 0.002 0.100 ± 0.016 0.130 ± 0.017 Surface layer of LSS (SLSS) 0.283 ± 0.002 0.152 ± 0.017 0.131 ± 0.017 Bottom layer of LSS (BLSS) 0.54 ± 0.09 0.683 ± 0.002 0.152 ± 0.016 0.300 ± 0.019 Surface layer of DS (SDS) 1.14 ± 0.20 0.383 ± 0.002 0.211 ± 0.015 0.172 ± 0.015 Bottom layer of DS (BDS) 1.14 ± 0.19 0.383 ± 0.002 0.211 ± 0.016 0.172 ± 0.017 High solid sludge (HSS) 2.13 ± 0.34 0.683 ± 0.002 0.308 ± 0.019 0.375 ± 0.020 Surface layer of HSS (SHSS) 1.04 ± 0.04 0.383 ± 0.002 0.203 ± 0.029 0.180 ± 0.030 Bottom layer of HSS (BHSS) 0.420 ± 0.032 1.72 ± 0.74 0.683 ± 0.002 0.263 ± 0.032 SLSS, BLSS, DS, SDS, BDS, HSS, and SHSS, and BHSS was 7.9, 8.7, 8.7, 8.8, 7.4, 7.4, 8.5, 8.3, and 8.3, respectively. Biogas production in the sludges (LSS bacterial inoculum 5 mL) was measured with and without pH 7.0 adjustment. In E1 and E2, the pH 7.0 was adjusted with 37%hydrochloric acid (HCl), and pH wasmeasured using pH paper. In E3, to monitor whether the sludge pH could be lowered to 7.0 during storage at the room temperature of 21 ± 2 °C without acid addition, DS (dry wt 26.8 g) and HSS (dry wt 23.5 g) with the wet wt of 100 g were transferred in a 0.5-L decanter class covered with an aluminum foil. The samples of 1.0 g were taken after 0, 1, 2, 5, 6, 12, 32, and 35 days for the pHmea-surement. The pH was measured using InoLab series pH 720m as presented above. Acid and alkaline hydrolysis To study the effects of acid hydrolysis of digested sludge on biogas production, the pH value of sludge was adjusted to pH 1.0, 2.0 or 3.0 using 37% HCl, and the solutions were incu-bated at the room temperature of 21 ± 2 °C for 24 h (Devlin et al. 2011). To study the effects of alkaline hydrolysis of digested sludge on biogas production, the pH values of sludges were adjusted to pH 10.0 or 12.0 using 10Mpotassi-um hydroxide (KOH), and the solution was incubated at the roomtemperature of 21 ± 2 °C for 48 h (Rafique et al. 2010). After the treatments, the samples were neutralized; i.e., pH 7.0was adjusted using HCl or KOH. In E1, the acid-treated (pH 1.0, 2.0, and 3.0) or alkaline-treated (pH 10.0, and 12.0) sludges were recycled to biogas production; i.e., the sludges were amended in 10mLof LSS to measure biogas production. The acid- or alkaline-treated sludge samples were SLSS (pH 1.0 and 12.0), DS (pH 1.0and 12.0), SDS (pH 1.0, 2.0, 3.0, 10.0 and 12.0), HSS (pH 1.0 and 12.0), and SHSS (pH 1.0 and 12.0). In E2, the acid-treated (pH 3.0) or alkaline-treated (pH 10.0) sludges were recycled to biogas production; i.e., the sludges were amended in 5mL of LSS tomeasure biogas production. The acid- or alkaline-treated sludge samples were SLSS (pH 10.0), and BLSS (pH 10.0), DS (pH 3.0 or 10.0), SDS (pH 10.0), BDS (pH 10.0), HSS (pH 3.0 and 10.0), SHSS (pH 10.0), and BHSS (pH 10.0). Thermal treatment (heating) and sonication In E2, to disrupt the sludge microbial cells and VS, and to change sludge rheology, the sludges were heated in a water path (Grant SUB 14, Cambridge, UK) at 75 °C until the pH fell to 7.0 due to ammonia evaporation (Barber 2016; Bonmatí and Flotats 2003; Climent et al. 2007; Tyagi and Lo 2011). The incubation time varied between 1 and 3 h. The heat-treated sludges were amended in 5 mL of LSS to measure biogas production. The heat-treated sludges were SLSS (3 h), BLSS (3 h), DS (3 h), SDS (2 h), BDS (2 h), HSS (2 h), SHSS (1 h), and BHSS (1 h). The high pressure created by sonication causes microbubble formation, which collides and releases energy for radical formation and biological material disruption (Apul and Sanin 2010). For sonolytic treatment, the sludges were sonicated for 60 min at 43 kHz and 320 W (Branson 8510 Ultrasonic, Danbury, USA) until the pH fell to 7.0. The sonicated sludges were amended in 5mL of LSS and biogas production wasmeasured. The sonicated sludges were DS and HSS. Calculations The results were calculated as an average ± standard deviation (S.D.) (n = 3). Statistical analyses were performed using IBM SPSS Statistics 24 (New York, USA). The repeatedmeasures ANOVA (RMA) followed by pairwise comparisons (PC) was used to determine whether the VS concentration differed be-tween the surface and bottom layers of DS and HSS and whether the sludge pH changed during storage. The principal component analysis (PCA) was used to elucidate the distribution of inorganic ions into the surface and bottom layers of DS and HSS. Two-factor (sludge, treatment) Kruskal-Wallis (KW) test followed by Mann-Whitney ’s test (MW) was used to determine whether sludge compositions and treatments had an effect on biogas yield. Results and discussion The LSS total solid content of 3.1 ± 0.6%ofwet wt was low at the end ofWWTP biogas production process. It was increased by centrifugation to 26.6 ± 0.31% of the DS, while the total solid content of the BP HSS was 21.6 ± 2.2% after biogas production. The percentages of VS in the LSS (E1, 45.6 ±0.1% of dry wt; E2, 54.6 ± 9.1%), DS (E1, 54.1 ± 0.1%; E2,56.6 ± 0.4%), and HSS (E1, 46.3 ± 0.8%; E2, 41.7 ± 1.7%) were still quite high at the end of biogas production. The pH values of the LSS (E1 9.0/E2 7.9), DS (E1 8.0/E2 8.8), and HSS (E1 10.0/E2 8.5) were close to the upper limit of biogas-producing bacteria (about pH 8.5) or higher,mostlikely due to ammonia release from proteins and urea (Appels et al. 2008; Chen et al. 2007; Lay et al. 1997;Weiland 2010) (Table 2). As the factors like high element/FS concentration, high pH, and difficult-to-digest VS composition are suggested to limit biogas production (Appels et al. 2008; Chen et al. 2008), the importance of these factors in reducing biogas yields to below profitable levels at VS concentrations as high as 41.7–56.6%was evaluated. Furthermore, the possibility to concentrate the VS of the LSS, DS, and HSS by lifting onto the surface with biogas post-production and to digest them intomore suitable substrates for biogas-producing bacteria was studied. Surface and bottom layer separation The feasibility of concentrating VS by raising to the surface using biogas post-production was studied, as gases are known to carry suspendedmatter on the water surface (Rubio et al.2002). In E1, the initial VS concentration of 46.3 ± 0.8% for HSS increased to 61.8 ± 3.6% in the surface layer and de-creased to 42.9 ± 7.3% in the bottom layer, the difference be-ing 18.9% in 40 days. Then, in E2, the changes in the VS concentration were followed during the incubation (Fig. 1a). The VS concentration in the surface layer of HSS increased significantly from 41.7 ± 1.7% to 51.6 ± 6.6% in 28 days, while the bottom layer VS concentration decreased to 32.7± 9.6% (RMA-PC, p = 0.001). The greatest difference in VS concentration between the surface and bottom layers was achieved in 19 days, and it was again asmuch as 18.9% on a dry weight basis. Based on total C, 60.1% (236.5 ±11.2 g/kg) of total C was accumulated on the surface of HSS and 39.9% (157.3 ± 9.0) on the bottom, the difference of 20.1% being close to that calculated on the basis of VS (Table 2). In contrast to HSS, the VS concentration for DS 二 寸 60 寸 一 一 Q 一2 寸 HSS (per VS) wt) SHSS (per dry 寸SHSS (per VS) 一 BHSS (per dry wt) wt) BHSS (per VS) 51.6 ± 6.6 二 32.7 ± 9.6 503.1 ± 28.6 236.5 ± 11.2寸465.3 ± 79.7 157.3 ± 9.0 508.5 ± 138.4 65.7 ± 4.4 31.7 ± 2.2 62.2 ± 10.3 15.9 ± 2.0 50.7 ± 10.0 8.5 8.3 8.3 8.3 8.3 53.5 ± 12.3 39.5 ± 6.2 76.6 ± 12.0 35.3 ± 2.0 108.1 ± 6.1 48.9 ± 13.0 39.1 ± 3.6 75.9 ± 7.0 26.8 ± 1.6 82.2 ± 4.9 22.9 ± 6.5 15.0 ± 2.6 29.1 ± 5.0 6.8 ± 0.4 20.8 ± 1.2 < LOD-8.2 5.5 ± 0.6 10.6 ± 1.2 < LOD-3.1 < LOD-9.5 41.3 ± 5.0 30.0 ± 2.1 58.1 ± 4.0 21.3 ± 1.4 65.3 ± 4.3 104.5 ± 10.8 91.4 ± 5.2 177.3 ± 10.0 33.9 ± 4.0 103.8 ± 12.2 326.2 ± 57.7 234.1 ± 20.7 453.8 ± 40.1 137.0 ± 2.0 419.6 ± 6.1 32.6 ± 1.4 17.6 ± 2.1 34.0 ± 4.0 13.3 ± 2.0 40.7 ± 6.1 < LOD-285.4 252.4 ± 5.2 489.3 ± 10.0 < LOD-110.2 < LOD-337.4 57.1 ± 11.5 41.3 ± 6.7 80.1 ± 13.0 36.7 ± 4.0 112.5 ± 12.2 15.3 ± 2.9 13.5 ± 0.5 26.2 ± 1.0 8.9 ± 1.0 27.3 ± 3.1 一 V 一一 口 子 寸 寸 ci 一 寸 品 二 V 全 一 6060 一 Fig. 1a Volatile solid (VS) content in the dewatered sludge (DS) surface (SDS) and bottom (BDS) layers, and in the high solid sludge (HSS) surface (SHSS) and bottom (BHSS) layers, separated by biogas post-production (n = 3; the average of standard deviations, 2.2%). b Principal component analysis score plot showing the separation of DS, SDS, BDS, HSS, SHSS, and BHSS along the PC1 and PC2 axes based on the ele-mental compositions. c Loading values for elements along the PC1 and PC2 axes did not differ between the surface and bottom layers (E1:initial 54.1 ± 0.1%, end 54.0 ± 1.4%; E2: initial 56.6 ± 0.4%, end 55.5 ± 0.9%, RMA-PC, p = 0.161). Similarly, the VS concentration for LSS did not differ between the surface and bottom layers (E2: initial 52.9 ± 0.6%, end 52.5 ± 0.5%). Thus, the highest percentage of VS that could be accumulated on the surface layer varied between 51.6 and 61.8% of dry weight (Fig. 1a; Table 2). The quantity of sludge brought to the surface by biogas post-production was low, only about 2.6% of HSS, and 10.3% of DS based on the dry weight. However, all large solids were removed fromthe surface before weighting, which leads to an underestimation of the separation efficiency espe-cially in HSS, which contained source-separated biowaste with plastic bag residues. Elemental concentrations in the sur-face and bottom layers of HSS and DS were usually equal to or higher than in the sludges prior to separation the layers, which indicates that part of the VSmay have been lost during the layer separation process as volatile biogas, or as dissolved in the liquid phase due to water addition (Table 2). The major differences in the elemental compositions per VS were due to differences between HSS and DS, covering 82.7%of variance in the PCA (Fig. 1b). The concentrations of Fe, P, Co, Cu,Mn, Ni, and Zn in DS were higher than in HSS, while those of Al and V were highest in HSS (Fig. 1c and Table 2). Cr and Pb concentrations did not differ much be-tween HSS and DS. Differences in elements between sludges, surface layers, and bottomlayers accounted for 15.0%of var-iance along the PCA PC2 axis (Fig. 1b, c). Elemental concen-trations per VS had a tendency to increase in the following order: Sludge < surface < bottom (Table 2). Their concentra-tions were among the highest in the DS bottom layer, where the VS content was almost the sameat the surface and bottom. However, the P, Cu,Mn, and Zn concentrations were highest in the surface layer of HSS (VS, 51.6%), which had much more VS to adsorb elements than the bottom layer (VS,32.7%). Although elemental concentrations were affected by sur-face and bottom layer separation, still quite high concentra-tions were found in both layers. Especially Cu and Zn con-centrations were high enough to inhibitmicrobial activity in all sludges (Bååth 1989), and increasing elemental concentra-tions generally increase osmotic pressure. The surface and bottomlayer separation was not very efficient in concentrating the elements, but it may be possible to use to increase the surface layer VS concentration relative to the bottom. Factors that are known to affect the surface and bottom layer separation include the efficiency ofmethane post-production, water quantity, substances dissolved in water, sludge compo-sition, and pH (Rubio et al. 2002). For example, Cr, Cu, Ni, and Zn are released from the sludge into the liquid at low pH values below 6.3 (Adams and Sanders 1984; Wong et al.2002). The optimization of these conditions could improve the separation efficiency. In addition, surface and bottomlayer separation immediately at the end of biogas production pro-cess could bemore efficient, and the biogas produced during surface separation could be recovered. The activity of the biogas-producingmicrobial community would not be affected by aeration as a post-treatment, transportation, and storage under aerobic conditions for up to 24 h prior to the start of experiments, and freezing, as was in this study. Digested sludge post-treatments to improve biogas production To improve biogas production fromrecycled digestate, the pH of the digestate was adjusted to 7.0, which is optimal for methane-producing bacteria (Appels et al. 2008; Chen et al.2008). In addition, sludge VS were hydrolyzed by acid, alkali, heat, or sonolytic treatment, followed by recycling to biogas production. Based on statistical analysis using KW, the treat-ments (p < 0.001) and recycledmaterials (p < 0.050) affected especially biogas production, as shown below. Digested sludge pH adjustment In E1 and E2, the pH of the LSS, DS, and HSS, and their surface and bottom layers was adjusted to pH 7.0 from the pH values of 7.4–10.0, and then the sludges were recycled to biogas production. Biogas production was compared with that in the same recycled sludge without adjusted pH (Figs. 2 and 3, black bars). Generally, the recycling of non-pH-adjusted sludges to biogas production increased biogas yield compared with LSS without pH adjustment, except not the SLSS (Fig. 3a) and BHSS (Fig. 3c) recycling. Similarly, according to Yadvika et al. (2004), the sole recirculation of sludge back to biogas production has increased biogas yield, but onlymar-ginally. Biogas yield was further increased, when the pH of the sludges was adjusted to 7.0 (MW, p < 0.001; Figs. 2 and 3, black bars). Indeed, adjusting the pH of themicrowave H2O2pre-treated sludge also improved biogas production (Eswari et al. 2016). Thus, ammonia release from proteins and urea appeared to raise the pH of sludges above the optimum of biogas production (Appels et al. 2008; Chen et al. 2008). Adjusting the pH of the recycled digested sludge was one of themost effectivemethods for achieving a high biogas yield. In E3, the pH of DS and HSS wasmonitored for 35 days to determine if it could be lowered to pH 7.0 during storage without the addition of acid or base. The water evaporated during incubation, as dry weight increased from 26.8 to 48.2% in DS (RMA-PC, p = 0.002) and from 23.5 ± 0.8 to 77.1 ± 17.7%inHSS (RMA-PC,p = 0.002). At the sametime, the pH of the coarse and aerobic DS decreased fromthe initial pH 8.8 to pH 6.8–7.2 in 5–6 days, and further to 5.3 in 35 days (RMA-PC; p < 0.001) (Fig. 4). For comparison, in the surface and bottom layer separation, the pH of DS with added water only decreased from 8.8 to 7.4 during 33 days of incubation under saturated conditions (Fig. 1, Table 2). During DS stor-age in E3, the decrease in pH was associated with only a 2.9%decrease in total N, from46.1 ± 5.7 to 44.9 ± 1.2 g/kg (RMA-PC, p = 0.003) (Fig. 4). Total C decreasedmore in E3, 29.8%from305.3 ± 33.5 to 214.3 ± 12.0 g/kg (RMA-PC, p < 0.001), while the VS percentage remained almost the same (57.1 ±0.6%of dry wt) for 35 days. Ammonia released fromproteins and urea appeared to bemicrobiologically bound to biomass in coarse and aerobic DS, as only little nitrogen was lost even though the pH decreased. Simultaneously some carbon was lost in cellular respiration. In E3, the pH changes in HSS differed from those in DS. The pH of HSS increased from an initial pH of 8.5 to 8.9during a 35-day incubation (RMA-PC, p < 0.001), while total N decreased by 61.9%from27.3 ± 1.0 g/kg to 10.4 ± 0.7 g/kg (RMA-PC, p = 0.003). Total C decreased asmuch as 64.5%, from 209.7 ± 12.3 g/kg to 74.4 ± 5.4 g/kg (RMA-PC, p ≤0.001), though these changes were not clearly seen in the VS content (initial 41.7 ± 1.7%; final 48.6 ± 15.7% of dry Fig. 2Treatments (Treat), and volatile (VS) and fixed (FS) solid contents (g/kg dry wt) in experiment 1 (E1). Black bars: Biogas production in LSS (pH 9.0, pH 7.0), and in LSS amended with DS (pH 8.0, pH 7.0) or HSS (pH 10.0, pH 7.0); the first value without pH adjustment, and the second with pH 7.0 adjustment.White bars: Biogas production in LSS amended with acid-treated (treatment pH/biogas production pH: pH 1/7, 2/7, and 3/7) or alkali (pH 10/7, 12/7) SLSS, DS, SDS HSS, or SHSS, followed by neutralization For all treatments, the average of standard deviations was 0.61mL/g VS (n = 3) Fig.3E2, treatments (Treat, n = 3), and volatile (VS) and fixed (FS) solid contents (g/kg dry wt). a Black bars: Biogas production in LSS (pH 7.9, pH 7.0), and in LSS amended with SLSS (pH 8.7; pH 7.0) or BLSS (pH 8.7, pH 7.0) without and with pH 7.0 adjustment. White bars: Biogas production in LSS amended with alkali-treated (treatment pH/biogas pro-duction pH: pH 10/7) SLSS or BLSS, followed by neutralization. Gray bars: Biogas production in LSS amended with temperature-treated (75 °C/3 h) SLSS or BLSS. b Black bars: Biogas production in LSS amended with DS (pH 8.8, pH 7.0), SDS (pH 8.3, pH 7.0), or BDS (pH 8.3, pH 7.0) without and with pH adjustment. White bars: Biogas production in LSS amended with acid-treated (3/7) oralkali-treated (10/7) DS, SDS, or BDS, followed by neutralization. Gray bars: Biogas production in LSS amended with temperature-treated DS (75 °C/3 h), SDS, or BDS (75 °C/2 h). Horizontal line bars: Biogas production in LSS amended with sonicated DS. c Black bars: Biogas production in LSS amended with HSS (pH 8.5, pH 7.0), SHSS (pH 7.4; pH 7.0), or BHSS (pH 7.4, pH 7.0) without and with pH adjustment. White bars:Biogas production in LSS amended with acid-treated (3/7) or alkali-treated (10/7) HSS, SHSS, or BHSS, followed by neutralization. Gray bars: Biogas production in LSS amended with temperature-treated HSS (75 °C/2 h), SHSS, or BHSS (75 °C/1 h). Horizontal line bars: Biogas production in LSS amended with the sonicated HSS. For all treatments, the average of standard deviations was 3.3mL/g VS (n = 3) wt). Thus, under saturated conditions, biogas production at HSS seemed to continue and ammonia was released further, which was reflected in the increase in pH and the removal of some of the ammonia by evaporation. Altogether, under aer-obic conditions at about 21 °C, ammonia in the digested sludge seemed to be incorporated to biomass and pH de-creased to 7.0 in a few days, but under saturated conditions, the ammonia will remain in solution or evaporate slightly so that the pH will not decrease. To remove ammonia from the system, for instance, stripping of ammonia is required (Bonmatí and Flotats 2003). Digested sludge acid, alkali, thermal, and sonolytic treatments In E1, the sludges were treated with acid (pH 1.0, 2.0, or 3.0) or alkaline (pH 10.0, or 12.0) and then recycled to biogas production at pH 7.0 (Fig. 2, white bars). According to the results, the biogas yields after the pH 1.0 and 12.0 treatments of the recycled sludges were lower than after the pH 7.0 ad-justments (MW, p < 0.001). The biogas yields were the best after the pH 1.0, 3.0, and 10.0 treatments of the recycled sludges (p ≤ 0.050), the pH 10.0 treatment being the best (MW, p = 0.050), as also reported in Chen et al. (2007), Zhang et al. (2010), and Feki et al. (2015). The ability of pH 3.0 and 10.0–treated recycled sludges to improve biogas pro-duction was further investigated in E2 (Fig. 3, white bars). The results showed that the recycling of pH 3.0 and 10.0–treated sludges improved the biogas yield less than the pH 7.0 adjust-ment alone (MW, p ≤ 0.021). Digested sludge VS heat and sonolytic hydrolyses were also studied in E2. The recycled slurry was heated at 75 °C or sonicated until the pH fell to 7.0 due to ammonia evapora-tion (Fig. 3, gray bars). According to the results, the heat treatment of the recycled sludges improved the biogas yield as much as the pH 7.0 adjustment (MW, p = 0.304), in Fig. 4The changes in the pH of dewatered (DS) and high solid (HSS) sludges during the incubation at the temperature of 21 ± 2 °C for 35 days (the average of standard deviations, 0.05; n = 3) agreement with other studies stating that thermal treatment is one of themost effective pre-treatments (Bougrier et al. 2006; Hao et al. 2016; Kim et al. 2003; Pérez-Elvira et al. 2006). Thus, the ammonia recovery by heat stripping would at the sametimedigest the VSmore susceptible tomicrobial use and recyclable back to biogas production (Bonmatí and Flotats 2003). The biogas yields after 1–2-h heating of the recycled sludges were among the highest (Fig. 3b, c, gray bars), while 3-h heating appeared to have adverse effects on biogas pro-duction (Fig. 3a, gray bars). The biogas yields fromsonicated and recycled DS and HSS did not differ from the yields after heat treatment of the sludges (MW, p = 0.108), but sonication was less efficient treatment than pH 7.0 adjustment (MW, p =0.003) (Fig. 3b, c, horizontal line bars). Digested sludgematerials The sludges recycled for biogas production were LSS, DS, and HSS and their surface and bottom layers. In E1, biogas yields from the recycled LSS, DS, and HSS did not differ (MW, p ≥ 0.453; Fig. 2). The compositions of the sludges were quite similar, the FS content ranging from 136 to 257 g/kg dry wt and the VS content ranging between 115and 216 g/kg dry wt. In E2, by contrast, biogas yield from recycled DS (FS, 300 g/kg dry wt) was higher than from recycled HSS (FS, 375 g/kg dry wt; MW, p = 0.002), while that fromLSS (FS, 83 g/kg dry wt) did not differ significantly from DS and HSS, due to large difference in biogas produc-tion between untreated (no biogas produced) and pH 7.0–ad-justed LSS (MW, p = 1.000; Fig. 3, black bars of LSS, DS, and HSS). VS content was highest in DS (383 g/kg dry wt),mod-erate in HSS (308 g/kg dry wt), and lowest in LSS (100 g/g dry wt), and still, the biogas yield was highest in pH-adjusted LSS. VS adsorb the elements (Wong et al. 2002); i.e., the highest VS content of DS may have reduced the inhibitory effects of the elements by adsorbing and, at the same time, the highest VS and total C contents of DS supported biogas production (Fig. 3b; Table 2). The biogas yields fromthe LSS and DS bottomlayers were higher than fromthe surface layers (MW, p ≤ 0.044), although the VS contents were slightly higher than the FS contentsin all layers (Fig. 3a, b). The anaerobic biogas-producingmicrobial community apparently has grown in the bottomlayers during layer separation, while complex organic material may have risen to the surface where aerobicmicroorganisms also grow. Thus, themost easily accessible substrates for biogas produc-tion may have been at the bottom. Interestingly, the biogas production from DS surface and bottom layers was higher than from the original DS (MW, p ≤ 0.006), even though the layermaterials were incubated for 28–33 days during surface and bottom separation by post-produced biogas. During the layer separation, some of the substancesmay disappear in the form of evaporated gases and some may dissolve and disappear with the added water, though generally, the ele-ments were concentrated in the surface and bottom layers (Table 2). FS contents in biogas production from recycled SDS and BDS were lower than in DS experiments, although the FS percentages in DS (56.1%) and SDS/BDS (55.1%) were nearly the same (Fig. 3b). Dilution of FS and VS could increase biogas production in SDS/BDS compared with DS; ammonia dilution has also been found to increase biogas pro-duction (Chen et al. 2008). In contrast to the LSS and DS, biogas production fromthe recycled surface layer of HSS was better than fromthe bottom layer, or from HSS (MW, p < 0.001), but the biogas produc-tion between recycled HSS and BHSS did not differ signifi-cantly (MW, p = 0.106; Fig. 3c). These differences weremost likely due to the highest FS contents in HSS (375 g/kg dry wt) and BHSS (420 g/kg dry wt), while it was only 180 g/kg dry wt in SHSS.When the separation of surface and bottomlayers increases the VS concentration on the surface, the biogas pro-duction from the surface VS can also be improved due to the decrease in FS. Biogas production from digested sludges was generally low, and in some experiments, a reliable separation ofmeth-ane and carbon dioxide would not have been possible due to the small volume;i.e., statistical analyses would not have been possible to do formethane volumes. Furthermore, the number of triplicate samples (required for statistical analyses) was 57in E1, and 114 in E2, and performing a similar series of ex-periments on a larger scale would have been challenging. Biogas yields were low because easily available nutrients of the digested sludges had already been used for biogas produc-tion; E1 sludges had been shortly aerated; and all sludges were frozen prior to experiments due to the waiting timeto separate layers, and even surface and bottom layers were frozen to ensure the same freeze-thaw treatments for all samples. For these reasons,methane was not separated from the biogas in this study. However, it is important to recall that all sludges were from full-scale biogas production and had themicrobial community needed for anaerobic digestion. The proportion of methane in biogas was 56–58% at the BP, and slightly higher 60% at theWWTP, the LSS sludge of which was used as a microbial inoculum in this study. E3 showed that under satu-rated conditions, the bacteria in the sludge did not begin to consume ammonia and carbon for aerobic growth with in-creasing CO2 release, but apparently continued to produce biogas; the phenomenon was even utilized in separating sur-face and bottomlayers.Moreover, despite the low volumes of biogas,many of the differences between the treatments were in good agreement with previous results in the literature, as discussed above. Although the volumes of produced biogas differed between E1 and E2, the differences between the same treatments were the same in the two experiments and support-ed the results of each other. In the following, the results are summarized based on E2. Summary of treatments To evaluate the significance of the results, the biogas yields after the recycled sludge treatments in E2 were plotted as a function of FS (Fig. 5). The biogas yields after the best treat-ments (KW-MW, p < 0.050), that is after pH 7.0 adjustment and heating at 75 °C for 1–2 h, decreased exponentially with increasing amounts of FS according to the equation y =51.46e −5.05x (R 2 = 0.921). The biogas yields after the other recycled sludge treatments were below this curve that is the FS content of the sludges did not limit the biogas production. Thus, heating for 3 h at 75 °C apparently had adverse effects on VS composition compared with heating for 1–2 h. For example, volatile fatty acids are formed increasingly in sludge under alkaline conditions (Chen et al. 2007), and they may have been evaporated during prolonged treatment, resulting in reduced biogas production. Sonication for 1 hmay have had similar effects on VS, in agreement with the results in Segura et al. (2016). The inorganic ions added in the pH 3.0 (HCl) and 10.0 (KOH) treatments and neutralization increased the FS content of digested sludges, thereby enhancing the inhibition of biogasproduction byFSmorethan a simplepH adjustment. The inhibitory effect of increasing FS content appeared to be themajor factor limiting biogas production. Element additions (Fe, Ni, Co) have reduced biogas pro-duction from food waste with 90.8% of VS, and it has been explained to be due to the co-precipitation of trace elements essential for biogas production (Yazdanpanah et al. 2018). However, when Fe has been amended to the digestion of wastewater activated sludge, biogas production has been ex-plained to be improved due to increased sludge VS oxidation (zero-valent iron and activated carbon; photo-Fenton pre-treatment; K2FeO4) (Heng et al. 2017; Wang et al. 2017). Combining these previous results with the results of this study, it can be estimated that, in addition to oxidizing the slurry VS, Fig. 5Biogas yields in different treatments of E2 as a function of the fixed solid content (the average of standard deviations, 3.3 mL/g VS; n = 3) ironmay have been involved in precipitating the FS, thereby reducing their inhibitory effects on biogas production, and resulting in improved VS digestion and biogas production. The FS content in wastewater sludge typically is higher than in food waste, about 33–38%(Feki et al. 2015; Heng et al.2017; Liu et al. 2018). When the elements are added as part of the sludge pre-treatment prior to anaerobic di-gestion, the biogas-producing bacterial community may also have become adapted to higher elemental concen-trations than the bacterial community of the untreated sludge,suchasinanaerobicdigestionofricestraw (Xin et al. 2019). Such a change in microbial commu-nity structure may enhance sludge VS anaerobic diges-tion. Nevertheless, the inhibitory effects of increasing FS content during digestion may be the most important factor that ultimately limits biogas production. In general,microbiological hydrolysis or solubilization of complex carbon compounds like lignocellulose (cellulose, hemicellulose, lignin) has been considered as a rate-limiting step in anaerobic digestion (Chandra et al. 2012; Weiland 2010; Chiu and Lo 2016). However, in this study, biogas production was the highest in the recycled BLSS with the low FS content of 131 g/kg dry wt, although BLSS had al-ready lost some of the readily available carbon in the separa-tion of the surface and bottom layers of LSS by the biogas post-production for 33 days (Fig. 3). Correspondingly, the biogas yield from the heat-treated (75 °C, 2 h) and recycled SDS was higher than that from the recycled DS, which had a higher FS content (300 g/kg dry wt) than the SDS (172 g/kg dry wt) that had already undergone the separation of the sur-face and bottom layers with the loss of biogas. The digested sludge most likely contains microorganisms that degrade compounds like lignocellulose (Chandra et al. 2012; Goswami et al. 2016; Weiland 2010). The inhibitory effect of FS appeared to restrict biogas production from digested and recycled sludge more than the availability of carbon nutrients. The percentage of VS did not fall below 38.5–56.1%at the end of biogas production (Figs. 2 and 3), which is in agree-ment with the earlier results (e.g., Zhang et al. 2008; Grübel and Suschka 2015; Liu et al. 2018). According to European Union legislation, the VS content in landfillmust be less than 10% (European Council 1999), which prevents the digestate from being dumped in a landfill. The digested sludge can contain harmful compounds and drugs that inhibit the agricul-tural use of the sludge. The FS and water concentrations in the digested sludge were too high for profitable energy produc-tion, as most of the energy in the VS would be spent on evaporating the water. The inhibitory effects of inorganic ions should be circumvented, to further convert sludge VS into biogas. One possible method of concentrating 51.6–61.8%of VS on the surface is flotation, which could be further im-proved by adjusting the parameters. Conclusions To improve digested sludge VS consumption, the VS of LSS, DS, and HSS were separated to surface and bottomlayers using flotation by post-produced biogas, followed by adjusting the pH of the sludges to the optimumpH 7.0 for biogas-producingmi-crobes; VS digestion with acid, alkali, heat, or sonolytic treat-ment;and finally biogas productionmeasurementsfromrecycled sludges. The biogas yield was best after the sole pH 7.0 adjust-ment, and after ammonia evaporation and VS digestion by heat treatment at 75 °C until the pH dropped to 7.0 (1–2 h), sonolytic treatmentbeingalmostaseffective.Acid(HCl)andalkali(KOH) treatments were less effective in improving biogas production from the recycled digestates, as elevated FS levels appeared to limit biogas productionmore than difficult-to-digest VS. To improve sludge VS digestion down to the European land-fill limit of 10%,methods to concentrate VS and reduce FS should be found. In addition to FS dilution to avoid inhibitory effects, one possible method could be to separate VS into the surface and bottom layers by flotation using biogas post-production; 51.6–61.8% VS concentration was achieved in the surface layer using the non-optimized system. As VS and FS concentrations and compositions differ in surface and bottom layers, further optimization of conditions could improve VS uti-lizationfrombothlayers.Whenthesludgewasstoredfor35days under aerobic conditions at 21 ± 2 °C, the pH fellmostlikely due totheuseofammoniaasasubstrateformicrobialgrowth,where-as under saturated conditions, biogas production appeared to continue with ammonia and biogas evaporating without a de-crease in pH. Thus, pH control and heat treatment to further digest sludge VS and adjust pH by removing ammonia (stripping) were the simplestmethods for improving biogas pro-duction from the recycled sludge, while the biogas post-production at 21 ± 2 °C could be used to separate surface and bottomlayers which differ in composition and digestibility. Acknowledgements Open access funding provided by University of Helsinki including Helsinki University Central Hospital. Funding information This work was supported by the Employment and EconomicDevelopmentOffice, Lahti,Finland; Regional Innovations and Experimentations (AIKO) funding ofMinistry of Economic Affairs and Employment of Finland; and European Regional Development Fund. Open Access This article is licensed under a Creative Commons Attribution 4.0 International License, which permits use, sharing, adap-tation, distribution and reproduction in anymediumor format, as long as you give appropriate credit to the original author(s) and the source, pro-vide a link to the Creative Commonslicence, and indicate if changes were made. The images or other third partymaterial in this article are included in the article's Creative Commons licence, unless indicated otherwise in a credit line to the material. If material is not included in the article's Creative Commons licence and your intended use is not permitted by statutory regulation or exceeds the permitted use, you will need to obtain permission directly from the copyright holder. To view a copy of this licence, visit http://creativecommons.org/licenses/by/4.0/. References Adams TM, Sanders JR (1984) The effects of pH on the release to solu-tion of zinc, copper and nickel frommetal-loaded sewage sludges. Environ Pollut B 8:85–99. https://doi.org/10.1016/0143-148X(84)90020-X Appels L, Baeyens J, Degrève J, Dewil R (2008) Principles and potential of the anaerobic digestion of waste-activated sludge. Prog Energ Combust 34:755–781. https://doi.org/10.1016/j.pecs.2008.06.002 Apul OG, Sanin FD (2010) Ultrasonic pretreatment and subsequent an-aerobic digestion under different operational conditions. Bioresour Technol 101:8984–8992. https://doi.org/10.1016/j.biortech.2010.06.128 Bååth E (1989) Effects of heavymetals in soil onmicrobial processes and populations (a review).Water Air Soil Poll 47:335–379. https://doi. org/10.1007/BF00279331 BarberWPF (2016) Thermal hydrolysis for sewage treatment: a critical review. Water Res 104:53–71. https://doi.org/10.1016/j.watres.2016.07.069 Bonmatí A, Flotats X (2003) Air stripping of ammonia from pig slurry:characterisation and feasibility as a pre- or post-treatment to mesophilic anaerobic digestion.WasteManag 23:261–272. https://doi.org/10.1016/S0956-053X(02)00144-7 Bougrier C, Albasi C, Delgenès JP, Carrère H (2006) Effect of ultrasonic, thermal and ozone pre-treatments on waste activated sludge solubilisation and anaerobic biodegradability. Chem Eng Process 45:711–718. https://doi.org/10.1016/j.cep.2006.02.005 Carrère H, Dumas C, Battimelli A, Batstone DJ, Delgenès JP, Steyer JP, Ferrer I (2010) Pretreatmentmethods to improve sludge anaerobic degradability: a review. J Hazard Mater 183:1–15. https://doi.org/10.1016/j.jhazmat.2010.06.129 Chandra R, Takeuchi H, Hasegawa T (2012)Methane production from lignocellulosic agricultural crop wastes: a review in context to sec-ond generation of biofuel production. Renew Sust Energ Rev 16:1462–1476. https://doi.org/10.1016/j.rser.2011.11.035 Chen Y, Jiang S, Yuan H, Zhou Q, Gu G (2007) Hydrolysis and acidifi-cation of waste activated sludge at different pHs.Water Res 41:683–689. https://doi.org/10.1016/j.watres.2006.07.030 Chen Y, Cheng JJ, Creamer KS (2008) Inhibition of anaerobic digestion process: a review. Bioresouce Technol 99:4044–4064. https://doi. org/10.1016/j.biortech.2007.01.057 Chen JL, Ortiz R, Steele TWJ, Stuckey DC (2014) Toxicants inhibiting anaerobic digestion: a review. Biotechnol Adv 32:1523–1534. https://doi.org/10.1016/j.biotechadv.2014.10.005 Chiu SLH, Lo IMC (2016) Reviewing the anaerobic digestion and co-digestion process of food waste from the perspectives on biogas production performance and environmental impacts. Environ Sci Pollut Res 23:24435–24450. https://doi.org/10.1007/s11356-016-7159-2 ClimentM, Ferrer I, Baeza MM, Artola A, Vázquez F, Font X (2007) Effects of thermal and mechanical pretreatments of secondary sludge on biogas production under thermophilic conditions. Chem Eng J 133:335–342. https://doi.org/10.1016/j.cej.2007.02.020 Córdoba V, Fernández M, Santalla E (2018) The effect of substrate/inoculum ratio on the kinetics of methane production in swine wastewater anaerobic digestion. Environ Sci Pollut Res 25:21308–21317. https://doi.org/10.1007/s11356-017-0039-6 Devlin DC, Esteves SRR, Dinsdale RM, Guwy AJ (2011) The effect of acid pretreatment on the anaerobic digestion and dewatering of waste activated sludge. Bioresour Technol 102:4076–4082. https://doi.org/10.1016/j.biortech.2010.12.043 Eswari P, Kavitha S, Kaliappan S, Yeom I-T, Banu JR (2016) Enhancement of sludge anaerobic biodegradability by combined microwave-H2O2 pretreatment in acidic conditions. Environ Sci Pollut Res 23:13467–13479. https://doi.org/10.1007/s11356-016-6543-2 European Council (1999) Council directive 1999/31/EC of April 1999 on the landfill of waste. Official Journal of the European Communities L 182/1 Feki E, Khoufi S, Loukil S, Sayadi S (2015) Improvement of anaerobic digenstion of waste-activated sludge by using H2O2 oxidation, elec-trolysis, electro-oxidation and thermo-alkaline pretreatments. Environ Sci Pollut Res 22:14717–14726. https://doi.org/10.1007/s11356-015-4677-2 Gaida D,Wolf C, BongardsM(2017) Feed control of anaerobic digestion processes for renewable energy production: a review. Renew Sust Energ Rev 68:869–875. https://doi.org/10.1016/j.rser.2016.06.096 Giller KE, Witter E, McGrath SP (1998) Toxicity of heavy metals to microorganisms andmicrobial processes in agricultural soils: a re-view. Soil Biol Biochem 30:1389–1414. https://doi.org/10.1016/S0038-0717(97)00270-8 GoswamiR, Chattopadhyay P, ShomeA, Banerjee SN, Chakraborty AK, Mathew AK, Chaudhury S (2016) An overview of physico-chemicalmechanisms of biogas production bymicrobial communi-ties: a step towards sustainable wastemanagement. 3. Biotech. 6:72. https://doi.org/10.1007/s13205-016-0395-9 Grübel K, Suschka J (2015) Hybrid alkali-hydrodynamic disintegration of waste-activated sludge before two-stage anaerobic digestion pro-cess. Environ Sci Pollut Res 22:7258–7270. https://doi.org/10.1007/s11356-014-3705-y Han G, Shin SG, Cho K, Lee J, KimW, Hwang S (2019) Temporal variation in bacterial andmethanogenic communities of three full-scale anaerobic digesters treating swine wastewater. Environ Sci Pollut Res 26:1217–1226. https://doi.org/10.1007/s11356-017-1103-y Hao X, Hu Y, Cao D (2016) Destroying lignocellulosicmatters for en-hancingmethane production from excess sludge. Environ Technol 37:623–629. https://doi.org/10.1080/09593330.2015.1075600 Heng GC, Isa MH, Lim J-W, Ho Y-C, Zinatizadeh AAL (2017) Enhancement of anaerobic digestibility of waste activated sludge using photo-Fenton pretreatment. Environ Sci Pollut Res 24:27113–27124. https://doi.org/10.1007/s11356-017-0287-5 Kerminen K, LeMoël R, Harju V, KontroMH (2018) Influence of or-ganicmatter, nutrients, and cyclodextrin onmicrobial and chemical herbicide and degradate dissipation in subsurface sediment slurries. Sci Total Environ 618:1449–1458. https://doi.org/10.1016/j. scitotenv.2017.09.302 Kim J, Park C, Kim T, LeeM, Kim S, Kim SW, Lee J (2003) Effects of various pretreatments for enhanced anaerobic digestion with waste activated sludge. J Biosci Bioeng 95:271–275. https://doi.org/10.1016/S1389-1723(03)80028-2 Kurola JM, ArnoldM, KontroMH, TalvesM, RomantschukM (2011) Wood ash for application in municipal biowaste composting. Biorsource Technol 102:5214–5220. https://doi.org/10.1016/j. biortech.2011.01.092 Lay J, Li Y, Noike T (1997) Influences of pH andmoisture content on the methane production in high-solids sludge digestion.Water Res 31:1518–1524. https://doi.org/10.1016/S0043-1354(96)00413-7 Liu S, Yang G, Fu J, Zhang G (2018) Synchronously enhancing biogas production, sludge reduction, biogas desulfurization, and digestate treatment in sludge anaerobic digenstion by adding K2FeO4. Environ Sci Pollut Res 25:35154–35163. https://doi.org/10.1007/s11356-018-3438-4 Nguyen D, Gadhamshetty V, Nitayavardhana S, Khanal SK (2015) Automatic process control in anaerobic digestion technology: a crit-ical review. Bioresour Technol 193:513–522. https://doi.org/10.1016/j.biortech.2015.06.080 Pérez-Elvira SI, Nieto Diez P, Fdz-Polanco F (2006) Sludgeminimisation technologies. Rev Environ Sci Bio 5:375–398. https://doi.org/10.1007/s11157-005-5728-9 Rafique R, Poulsen TG, Nizami A, AsamZ,Murphy JD, Kiely G (2010) Effect of thermal, chemical and thermo-chemical pre-treatments to enhancemethane production. Energy 35:4556–4561. e4561. https://doi.org/10.1016/j.energy.2010.07.011 Rubio J, SouzaML, Smith RW(2002) Overview of flotation as a waste-water treatment technique.Miner Eng 15:139–155. https://doi.org/10.1016/S0892-6875(01)00216-3 Segura Y, Puyol D, Ballesteros L, Martínez F, Melero JA (2016) Wastewater sludges pretreated bydifferent oxidationsystemsatmild conditions to promote the biofas formation in anaerobic processes. Environ Sci Pollut Res 23:24393–24401. https://doi.org/10.1007/s11356-016-7535-y SFS-EN ISO 17294-1 (2004) Water quality. Application of inductively coupled plasmamass spectrometry (ICP-MS). Part 1: general guide-lines. Finnish Standards Association, SFS, Helsinki SFS-EN ISO 17294-2 (2016) Water quality. Application of inductively coupled plasmamass spectrometry (ICP-MS). Part 2: determination of selected elements including uraniumisotopes. Finnish Standards Association, SFS, Helsinki Talja KM, Kaukonen S, Kilpi-Koski J, Malin I, Kairesalo T, Romantschuk M, Tuominen J, Kontro MH (2008) Atrazine and terbutryn degradation in deposits from groundwater environment within the boreal region in Lahti, Finland. J Agric Food Chem 56:11962–11968. https://doi.org/10.1021/jf802528a Tyagi VK, Lo S (2011) Application of physico-chemical pretreatment methods to enhance the sludge disintegration and subsequent anaer-obic digestion: an up to date review. Rev Environ Sci Bio 10:215–242. https://doi.org/10.1007/s11157-011-9244-9 Wang T, Qin Y, Cao Y, Han B, Ren J (2017) Simultaneous addition of zero-valent iron and activated carbon on enhancedmesophilic an-aerobic digestion of waste-activated sludge. Environ Sci Pollut Res 24:22371–22381. https://doi.org/10.1007/s11356-017-9859-7 Weiland P (2010) Biogas production: current state and perspectives. Appl Microbiol Biot 85:849–860. https://doi.org/10.1007/s00253-009-2246-7 Wong JWC, Xiang L, Chan LC (2002) pH requirement for the bioleaching of heavymetals fromanaerobically digested wastewater sludge.Water Air Soil Pollut 138:25–35. https://doi.org/10.1023/A:1015503828607 Xin L, Guo Z, Xiao X, Peng C, Zeng P, FengW,XuW(2019) Feasibility of anaerobic digestion on the release of bioagas and heavymetals from rice straw pretreated with sodium hydroxide. Environ Sci Pollut Res 26:19434–19444. https://doi.org/10.1007/s11356-019-05195-x Yadvika S, Sreekrishnan TR, Kohli S, Rana V (2004) Enhancement of biogas production fromsolid substrates using different techniques: a review. Bioresour Technol 95:1–10. https://doi.org/10.1016/j. biortech.2004.02.010 Yazdanpanah A, Ghasimi DSM, KimMG, Nakhla G, Hafez H, Keleman M (2018) Impact of trace element supplementation onmesophilic anaerobic digestion of food waste using Fe-rich inoculum. Environ Sci Pollut Res 25:29240–29255. https://doi.org/10.1007/s11356-018-2832-2 Zeng Z, Zheng P, ZhangM, GhulamA (2019) Performance and working mechanism of a novel anaerobic self-floatation reactor for treating wastewater with high suspended solids. Environ Sci Pollut Res 26:26193–26202. https://doi.org/10.1007/s11356-019-05885-6 Zhang Y, Li H (2019) Energy recovery fromwastewater treatment plants through sludge anaerobic digestion: effect of low-organic-content sludge. Environ Sci Pollut Res 26:30544–30553. https://doi.org/10.1007/s11356-017-0184-y Zhang P, Zeng G, Zhang G, Li Y, Zhang B, FanM(2008) Anaerobic co-digestion of biosolids and organic fraction ofmunicipal solid waste by sequencing batch process. Fuel Process Technol 89:485–489. https://doi.org/10.1016/j.fuproc.2007.11.013 Zhang D, Chen Y, Zhao Y, Zhu X (2010) New sludge pretreatmentmeth-od to improvemethane production in waste activated sludge diges-tion. Environ Sci Technol 44:4802–4808. https://doi.org/10.1021/es1000209 Zhang Q, Hu J, Lee D (2016) Biogas fromanaerobic digestion processes:research updates. Renew Energ 98:108–119. https://doi.org/10.1016/j.renene.2016.02.029 Publisher ’s note Springer Nature remains neutral with regard to jurisdic-tional claims in publishedmaps and institutional affiliations.
关闭-
1/14
-
2/14
还剩12页未读,是否继续阅读?
继续免费阅读全文产品配置单
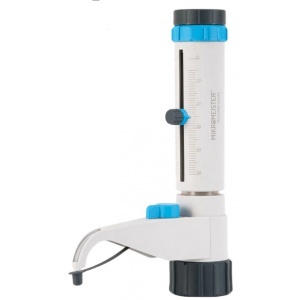
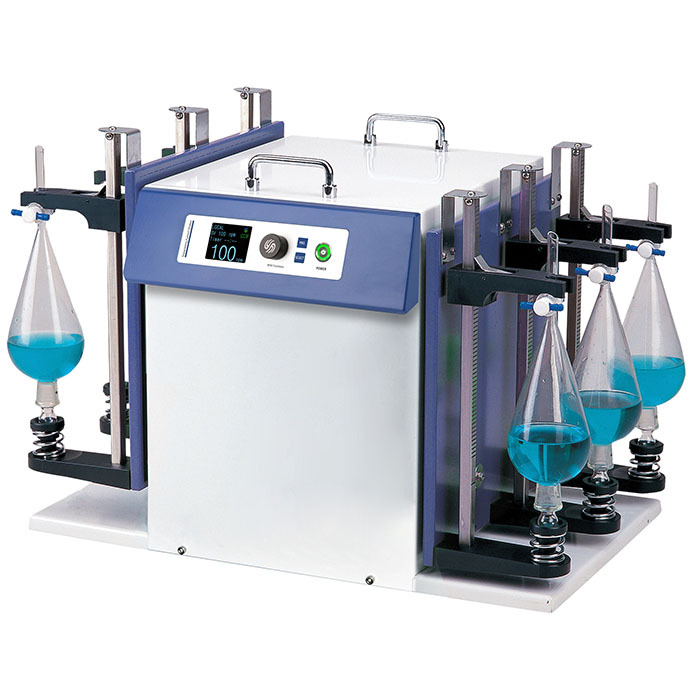
中国格哈特为您提供《低固体污泥(LSS)、脱 水污泥(DS)和高固体 污泥(HSS)pH测定中样品的振荡》,该方案主要用于土壤中物理指标检测,参考标准《HJ 962-2018 土壤 pH值的测定 电位法》,《低固体污泥(LSS)、脱 水污泥(DS)和高固体 污泥(HSS)pH测定中样品的振荡》用到的仪器有格哈特强力高重现振荡器LS500/RO500、格哈特快速干燥仪STL56、德国移液器MM。
我要纠错
推荐专场
快速干燥仪
更多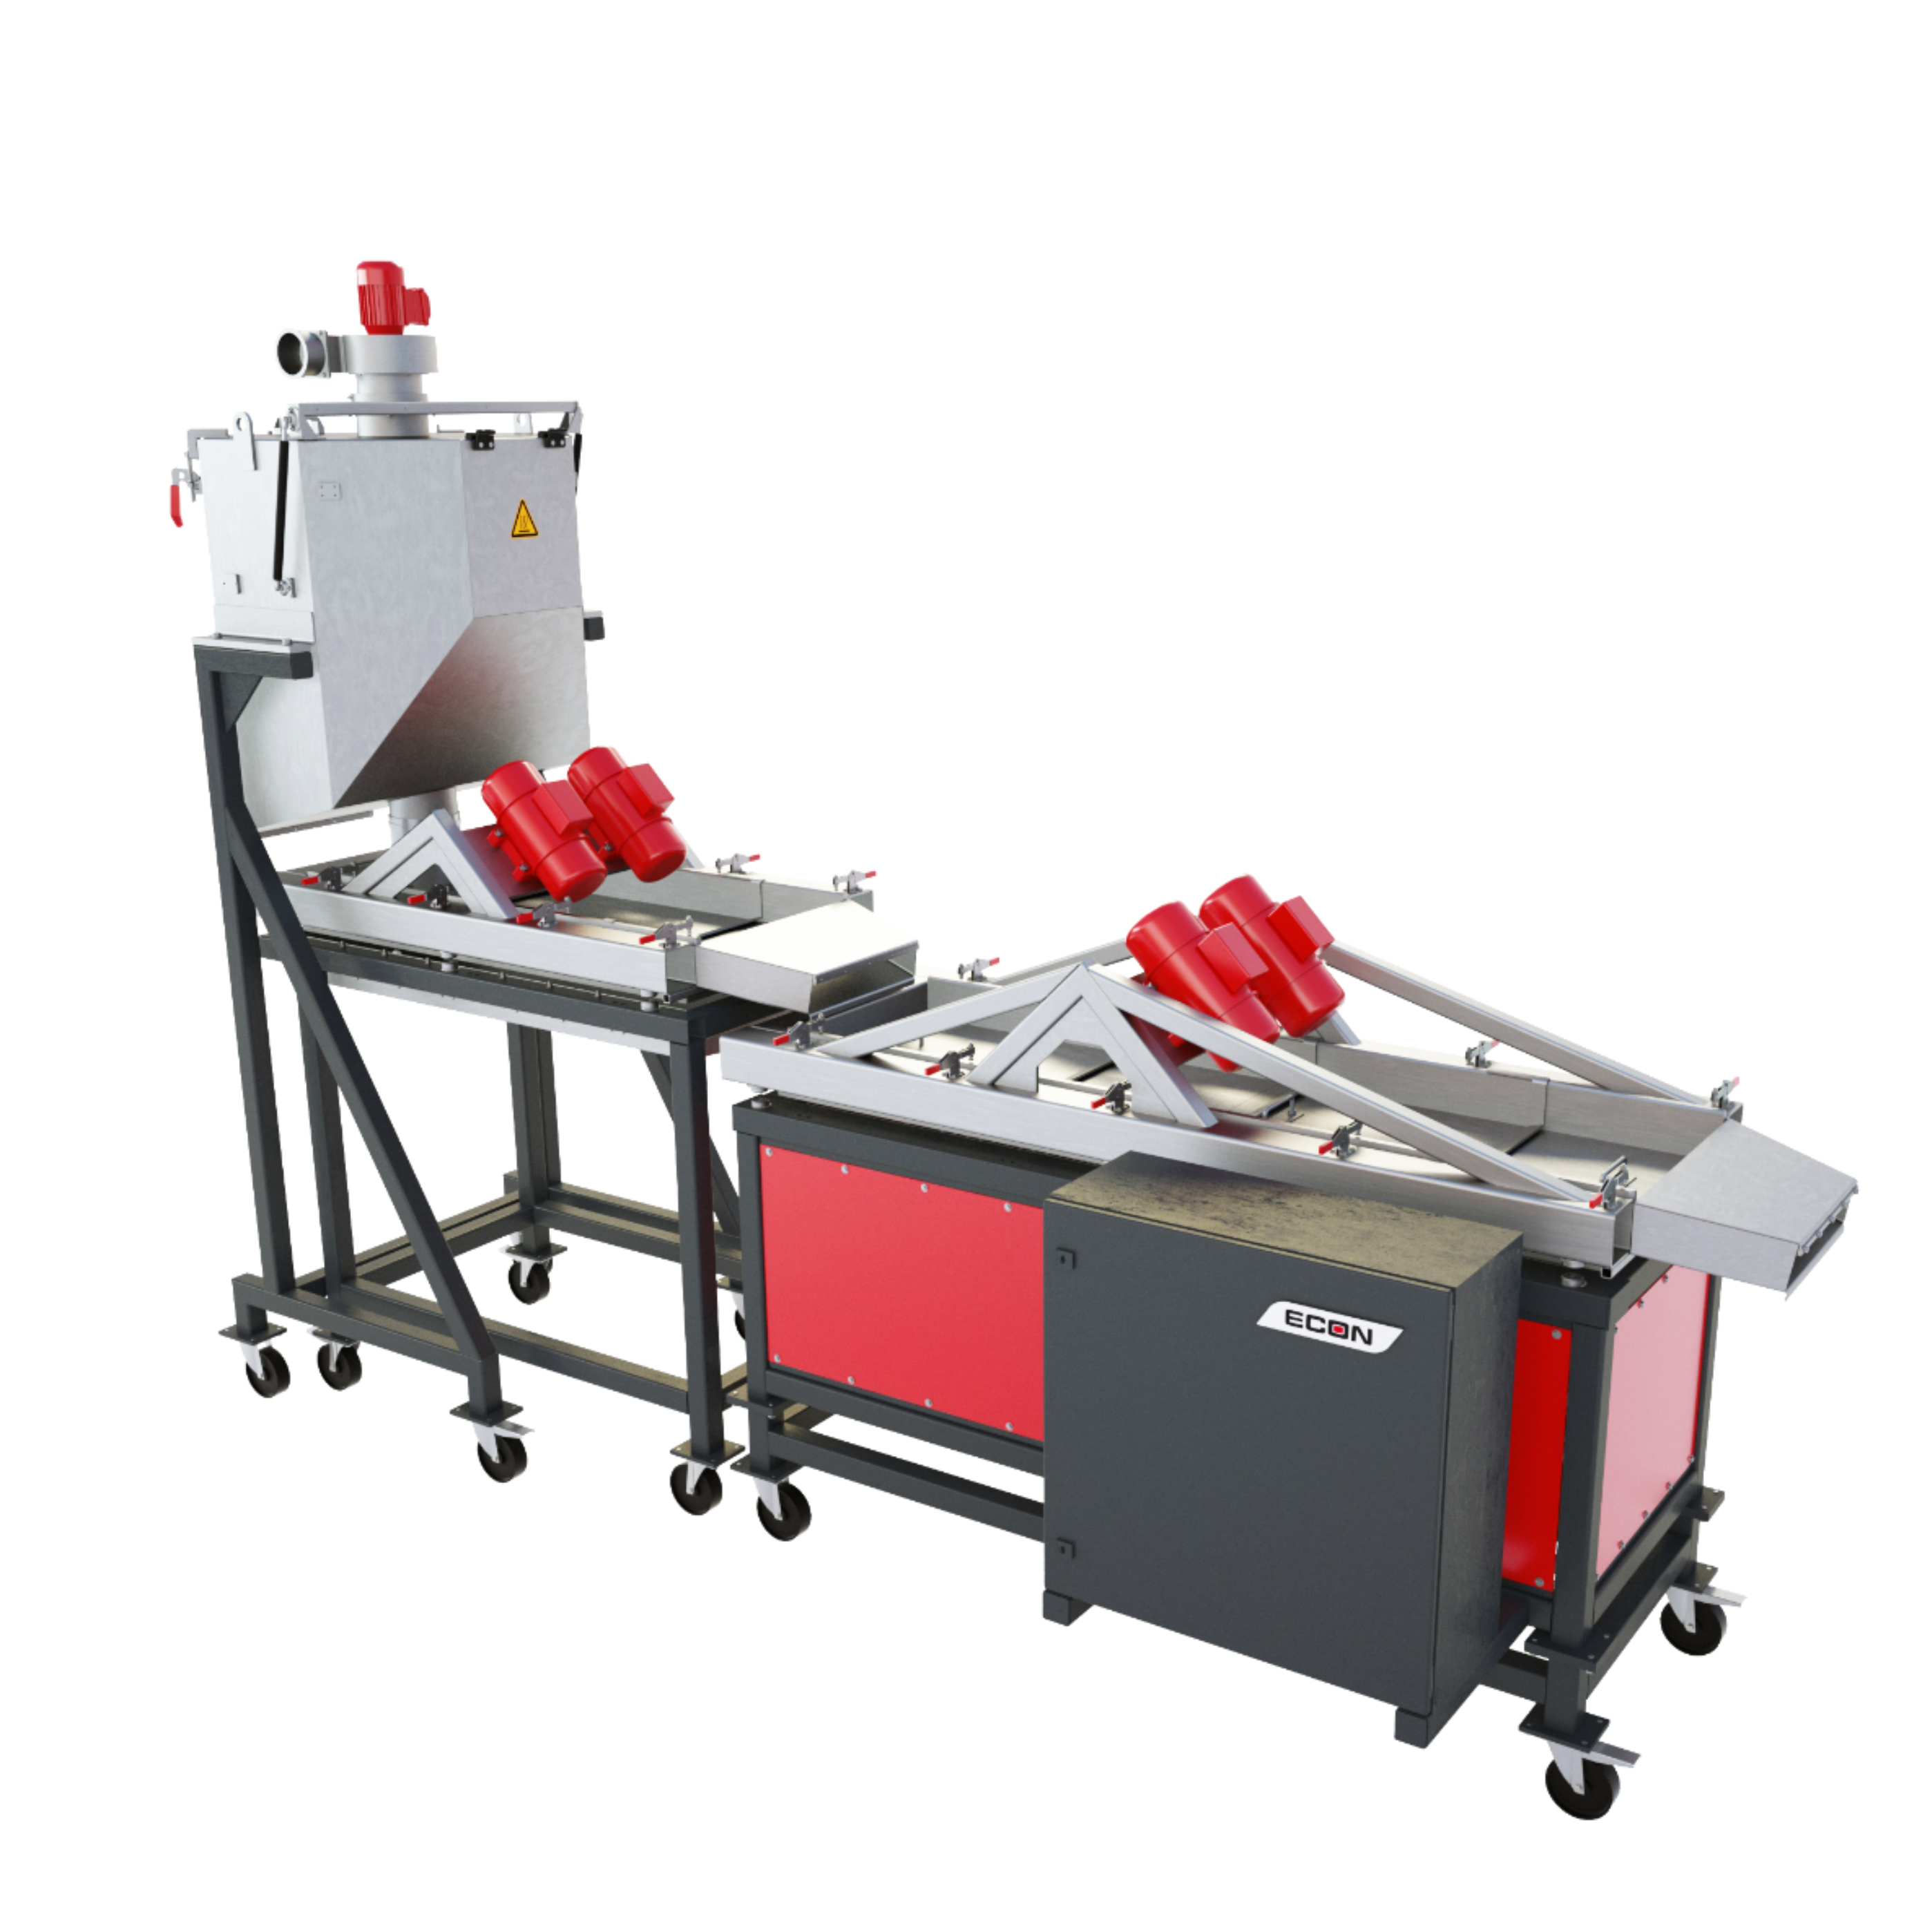
相关方案
 咨询
咨询