

我在故我思
第1楼2006/11/25
The fluorescence signal (If) is given by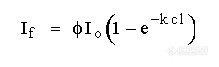
Fluorescence detectors can be simple or complex, the simplest consists of a single wavelength excitation source and a sensor that monitors fluorescent light of all wavelengths. For certain samples, this form of fluorescence detector can be very sensitive and relatively inexpensive. However, employing excitation light of a single wavelength and only a broad emission wavelength, it is not very versatile. Conversely, the fluorescence spectrometer fitted with a small sensor cell is far more complex but with both selectable excitation wavelengths and emission wavelengths is extremely versatile. In addition, excitation and emission spectra can be obtained as required.
我在故我思
第2楼2006/11/25
The Single Wavelength Excitation Fluorescence Detector
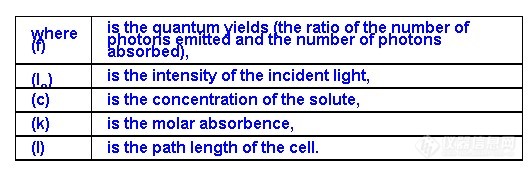
The single wavelength excitation fluorescence detector is probably the most sensitive $$lc detector that is available, but is achieved by forfeiting versatility. A diagram of a simple form of the fluorescence detector is shown in figure 36.
The excitation light is normally provided by a low pressure mercury lamp which is comparatively inexpensive and provides relatively high intensity UV light at 253.7 nm. Many substances that fluoresce will be excited by light of this wavelength.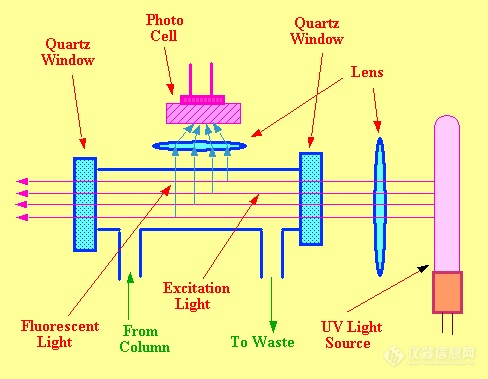
Figure 36. The Single Wavelength Excitation Fluorescent Detector
The excitation light is focused by a quartz lens through the cell. A second lens, set normal to the incident light, focuses the fluorescent light onto a photo cell. A fixed wavelength fluorescence detector will have a sensitivity (minimum detectable concentration at an excitation wavelength of 254 nm) of about 1 x 10⁻⁹ g/ml and a linear dynamic range of about 500 with a response index of 0.96 < r <1.04.
我在故我思
第3楼2006/11/25
The Single Wavelength Excitation Fluorescence Detector
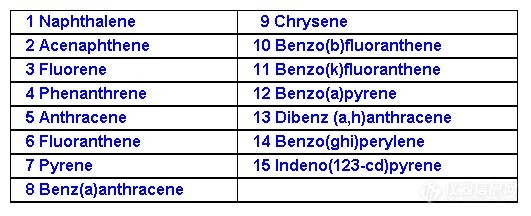
An example of a separation monitored by a simple fluorescence detector is the separation of a mixture of priority pollutants shown in figure 37. The excitation light was approximately monochromatic at 254 nm and all wavelengths of the fluorescent light was sensed by the photo cell. 
Column: 2 Pecosphere™–5C C18 (150 mm x 4.6 mm) in series. Mobile Phase: 90% acetonitrile/10% water. Flow rate: 2.0 ml/min. Detector Fluorescence (Excitation 254 nm total emission sensed). Sample: 20 ml of NBS Standard.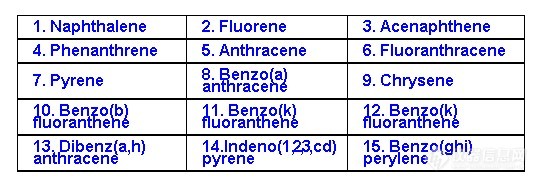
Figure 37. Separation of the Priority Pollutants Monitored by the Simple Fluorescence Detector
There are some compromises between the expensive fluorescence spectrometer detector and the single wavelength excitation fluorescence detector. Some have a single monochromators that select the wavelength of the excitation light, others employ a single monochromator to select the emission wavelength or provide emission spectra.
我在故我思
第4楼2006/11/25
The Multi Wavelength Fluorescence Detector
The multi wavelength fluorescence detector contains two monochromators, one to select the excitation wavelength and the second to select the fluorescence wavelength or produce a fluorescence spectrum A diagram of the multi wavelength fluorescence detector is shown in figure 38.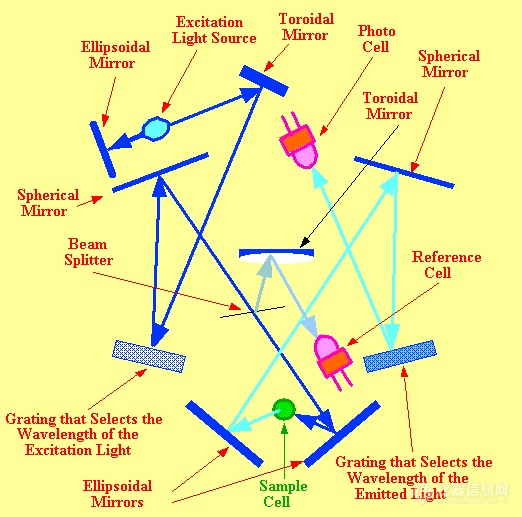
Figure 38. The Fluorescence Spectrometer Detector
The detector comprises a fluorescent spectrometer fitted with suitable absorption cell that is sufficiently small so as not to degrade the resolution of an $$lc column. There are two distinctly different light paths one for the excitation light and one for the emitted light. The different light paths are depicted separately, the excitation light in dark blue and the emitted light in light blue.
我在故我思
第5楼2006/11/25
The broad band excitation source (usually a deuterium lamp) is placed at the focal point of an ellipsoidal mirror (shown at the top left hand corner of the diagram). The resulting parallel light beam falls on a toroidal mirror that focuses it onto the grating on the left-hand side of the diagram. This grating selects the wavelength of the excitation light. Light of the selected wavelength passes to a spherical mirror and then to a ellipsoidal mirror (shown at the base of the diagram) which focuses it onto the sample. The excitation light path is in dark blue and is situated on the left-hand side of the diagram.
A beam splitter is situated between the spherical mirror and the ellipsoidal mirror (in the center of the diagram) which reflects a portion of the incident light onto another toroidal mirror which focuses it onto the reference photo cell. The path of the fluorescent light is in light blue and is largely on the right hand side of the diagram. Fluorescent light from the cell is focused by an ellipsoidal mirror on to a spherical mirror which then focuses the light onto a grating situated (seen at about center right of the figure). The grating selects the specific wavelength of the fluorescent light to be monitored. Light of the selected wavelength passes to a photoelectric cell which monitors its intensity.
The instrument is quite complex but is extremely versatile. The use of the detector to optimize both the excitation light and the fluorescence light to provide high selectivity for the Fluoropa derivative of neomycin is shown in figure 39. It is a very good example of the selection of a specific excitation light wavelength and the complementary emission light wavelength to provide maximum sensitivity.
我在故我思
第6楼2006/11/25
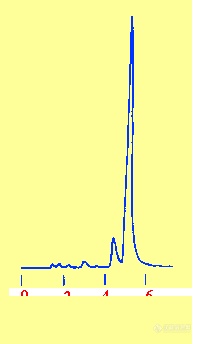
Column: Supercosil LC–8, 15 cm x 4.6 mm, 5 mm particles: Mobile Phase: tetrahydrofuran : 0.0056M sodium sulfate/0.007M acetic acid/0.01M pentane sulfonate, 3:97. Flow rate: 1.75 ml/min. Post Column reagent: 1L 0.4M boric acid/0.38M potassium hydroxide containing 6 ml 40% Brij–35, 4 ml mercaptoethanol, 0.8g o-phthalaldehyde. Flow rate 0.4 ml/min. Mixer 5 cm x 4.6 mm column packed with glass beads. Reactor 10 ft x 0.5 mm knitted Teflon capillary tubing. Reaction Temperature 40oC. Sample 20 ml of a mobile phase extract of a commercial sample. Excitation wavelength 365 nm;emission wavelength 418 nm.
Figure 39. Detection of Neomycin OPA Derivative at an Excitation Wavelength of 365 nm and an Emission Wavelength of 418 nm
我在故我思
第7楼2006/11/25
Optimizing excitation and emission light wavelengths to obtain maximum sensitivity for a complex mixture can become quite involved as shown by the separation of some priority pollutants depicted in figure 40. The separation was carried out on a column 25 cm long, 4.6 mm in diameter and packed with a C18 reversed phase. The mobile phase was programmed from a 93% acetonitrile, 7% water to 99% acetonitrile, 1% water over a period of 30 minutes. The gradient was linear and the flow rate was 1.3 ml/min. 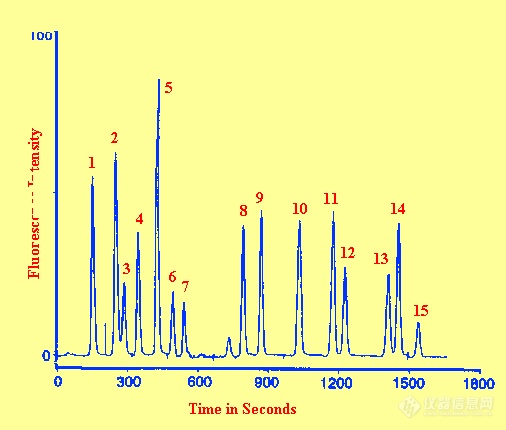
我在故我思
第8楼2006/11/25
Fluorescence Detector Program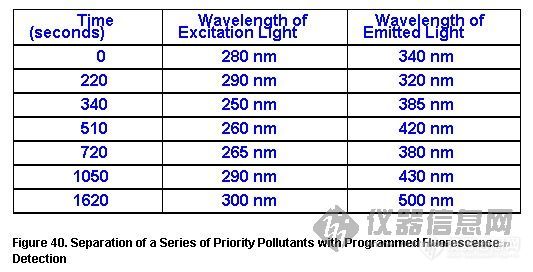
The separation illustrates the clever use of wavelength programming to obtain the maximum sensitivity. During development both the wavelength of the excitation light and that of the emission light were changed to provide maximum sensitivity for the particular solute.
The detector can provide fluorescence or excitation spectra by arresting the flow of mobile phase when the solute resides in the detecting cell and scanning either the excitation or fluorescent light. (This is the same technique as that used to provide UV spectra with the variable wavelength UV detector). As a consequence, it is possible to obtain excitation spectra at any chosen fluorescent wavelength or fluorescent spectra at any chosen excitation wavelength. Thus, even with relatively poor spectroscopic resolution many hundreds of spectra can be produced, any or all of which (despite many spectra being very similar) can be used to confirm the identify a compound.
我在故我思
第9楼2006/11/25
以上是一些关于荧光检测器的英文的说明资料,看看这个还可以学习英语,还能提高一下英语的水平。
下面提供几篇相关的中文的资料
一种共聚焦激光诱导荧光检测器的研制
摘要: 基于共聚焦检测,研制了一台便携式激光诱导荧光检测器。该系统具有体积小、重量轻、成本低等特点;成像观察校准系统使日常校准非常简单。采用毛细管电泳和流动注射方式对该体系性能进行了评价,以Cy5 染料与Cy5 标记的色氨酸作为检测物质,其检测下限为317 nmol/ L ,线性范围为103 。 一种共聚焦激光诱导荧光检测器的研制
我在故我思
第10楼2006/11/25
发光二极管诱导荧光检测器的研制
摘 要:探讨了以亮度发光二极管为诱导荧光检测激发光源的可行性,考察了直流驱动和脉冲驱动发光二极管(LED) 对输出光强的影响以及LED 塑料保护层厚度对输出光强的影响。发现脉冲驱动比直流驱动能提高光强3 倍,无塑料保护层相对有保护层可提高光强2.5 倍。采用毛细管电泳柱上检测方式对检测系统进行了评价,最小检出浓度为0. 18μmolPL 。结果表明该装置可以满足普通分析
需求。发光二极管诱导荧光检测器的研制