方案详情文
智能文字提取功能测试中
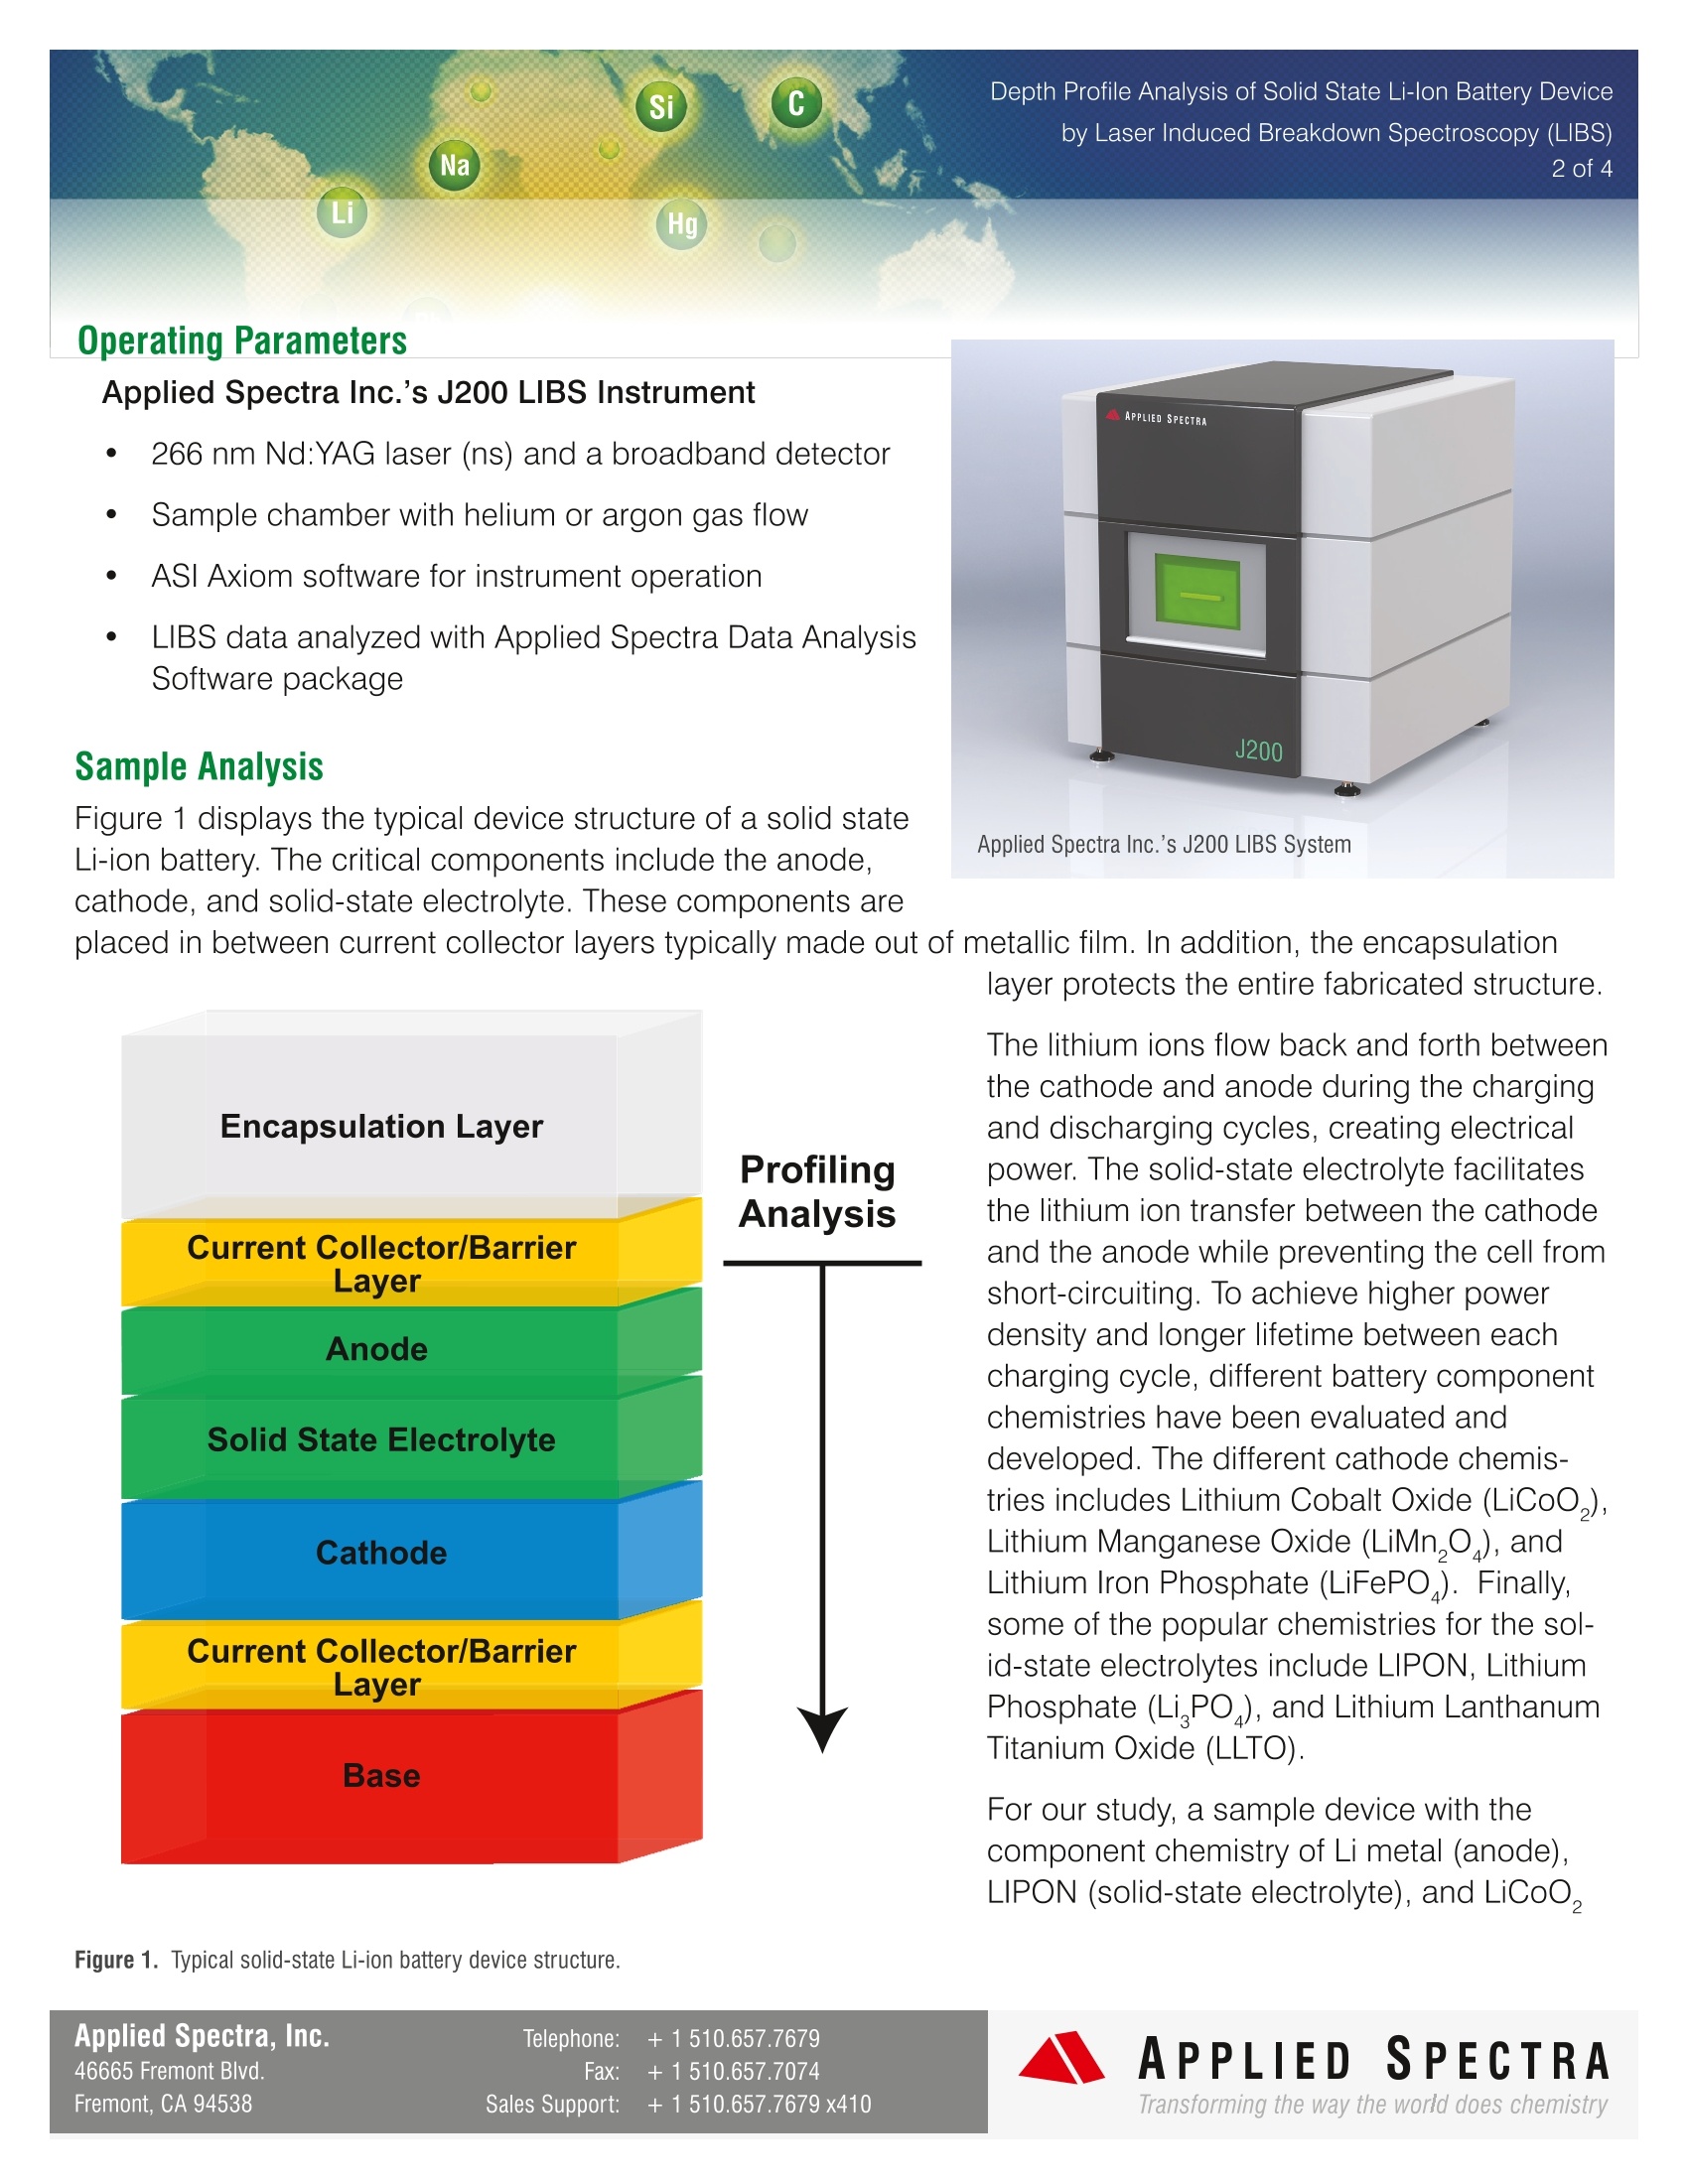
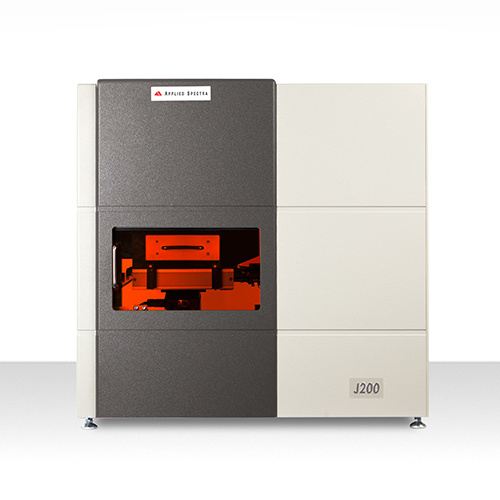
Depth Profile Analysis of Solid State Li-lon Battery Deviceby Laser Induced Breakdown Spectroscopy (LIBS)3 of 4 Introduction In today's society, electronic devices suchas smart phones and tablets are becominga vital part of daily human activities. Theseelectronics are constantly evolving todeliver a more compact form factor andlighter weight, yet, the power output andbattery life requirements have becomeincreasingly demanding. In order to meetthese technical challenges, Li-ion batterytechnology has also advanced to generatehigher energy output and provide enhancedcycling performance all while remaining This technical note highlights the ability of Laser Induced Breakdown Spectroscopy (LIBS) to performdepth-profiling analysis of key elements that represent the chemical makeup of important Li-ion batterycomponents. These components include the cathode, anode, and solid-state electrolytes.based elemental analysis techniques, such as ICP-OES and ICP-MS, cannot reveal structural information ofthese components. XRF, another popular elemental analysis technique, cannot provide elemental coveragefor important elements of Li-ion battery electrodes, such as Li, B, C, O, F, and N. Other surface and depthprofiling analysis techniques, like SIMS, GD-MS, AES, and XPS, require complex vacuum instrumentation,suffer from low measurement throughput, or are expensive. LIBS offers depth profiling capability for Li-ionbattery components in a lab or on a factory floor with excellent throughput. LIBS also has elemental coveragefrom H - Pu with a large dynamic range (ppm to wt. %) Dsiepth Profile Analysis of Solid State Li-lon Battery Deviceby Laser Induced Breakdown Spectroscopy (LIBS)Na 2 of 4LiHg Operating Parameters Applied Spectra Inc.’s J200 LIBS Instrument 266 nm Nd:YAG laser (ns) and a broadband detector SSample chamber with helium or argon gas flow ASI Axiom software for instrument operation LIBS data analyzed with Applied Spectra Data AnalysisSoftware package Sample Analysis Applied Spectra Inc.’s J200 LIBS System Figure 1 displays the typical device structure of a solid stateLi-ion battery. The critical components include the anode,cathode, and solid-state electrolyte. These components areplaced in between current collector layers typically made out of metallic film. In addition, the encapsulation layer protects the entire fabricated structure. The lithium ions flow back and forth betweenthe cathode and anode during the chargingand discharging cycles, creating electricalpower. The solid-state electrolyte facilitatesthe lithium ion transfer between the cathodeand the anode while preventing the cell fromshort-circuiting. To achieve higher powerdensity and longer lifetime between eachcharging cycle, different battery componentchemistries have been evaluated anddeveloped. The different cathode chemis-tries includes Lithium Cobalt Oxide (LiCoO,),Lithium Manganese Oxide (LiMn,), andLithium Iron Phosphate (LiFePO). Finally,some of the popular chemistries for the sol-id-state electrolytes include LIPON, LithiumPhosphate (Li PO), and Lithium LanthanumTitanium Oxide (LLTO). For our study, a sample device with thecomponent chemistry of Li metal (anode),LIPON (solid-state electrolyte), and LiCoO, (cathode) was obtained. Before analysis, the J200 LIBS instrument (in non-detection mode) was used toremove the current collector layer of the component structure shown in Figure 1. The current collector wasmade out of Ti film and the entire battery device was fabricated on Si base material. The analyses were carried out using the J200 LIBS instrument with a 266 nmlaser. The data was analyzedusing ASI's Data Analysis Software. The Li-ion battery sample was analyzed under a helium purged chamberto remove O emission line interference from the atmosphere and to improve the accuracy of the O measure-ments. The atomic line for each element of interest was monitored for each laser pulse and then plotted. Thetracked elements include Li, P O, Co, Ti, and Si. These elements are primary elements that represent thechemistry of the anode, solid-state electrolytes, cathode, current conductor, and substrate. Figure 2. Elemental depth profiling of a Li-ion battery device structure (Li metal anode, LiPON solid-state electrolyte, LiCo02 cathode, and Ti currentcollector on top of a glass substrate.) In Figure 2, it is easy to see when the user has started to ablate the different layers of the battery device by theinitial detection of atomic emission lines associated with the characteristic elements of different components.For example, the laser ablation of Li metal anodes will be accompanied by strong Li emission signal. As theablation proceeds into the LiPON solid-state electrolyte layer, the P emission signal is detected. Similarly,Coand O emission lines can be used to track the ablation of the LiCoO,cathode layer and to evaluate the relativecompositional variation within the cathode layer. Applied Spectra, Inc. Telephone: +1510.657.7679 46665 Fremont Blvd. Fax: +1510.657.7074 APPLIED SPECTRA Fremont, CA 94538 Sales Support: +1510.657.7679 x410 The depth profiling resolution for different Li-ion battery components can be determined by measuring theablated depth at the beginning of each new layer, and by then counting the number of laser pulses it takes toreach the next layer. The depth profiling resolution in this study ranged from 0.2 to 0.42 mm for the differingcomponent layers. Table 1. Displays the depth resolution per layer for the Li-lon battey tested. Layer Depth Depthper Laser Pulse (um) (um) Li metal 2 0.242 LiPON 3 0.429 LiCoO. 20 0.370 Ti 1 0.200 Glass Core 一 Conclusion LIBS provides a rapid and cost effective way to understand primary chemistry variation that may exist withindifferent Li-ion battery components due to chemistry change after many charge cycles or drifts in the manu-facturing processes. This technology is a fit for high volume QC measurements due to the rapid analysis time.With LIBS it is now possible for Li-ion battery industries to monitor the impact of process variables on keycomponent chemistry all while improving product consistency and yield. APPLIED SPECTRAwww.AppliedSpectra.comTransforming the way the world does chemistry 图2锂离子电池器件结构的元素深度剖析(锂金属负极、LiPON固态电解质、LiCoO2正极和置于玻璃基板上钛集电器)。在图2中,将不同组分的特征元素与原子发射线的检测数据相结合,很容易看出何时开始剥蚀电池的各个层。例如,锂金属负极的激光剥蚀会伴随着强的锂元素发射信号。剥蚀进入LiPON固态电解质层时,检测到P发射信号。同样,Co和O发射线可以用来跟踪LiCoO2正极层的剥蚀,并评估正极层内的相对成分变化。
关闭-
1/4

-
2/4

还剩2页未读,是否继续阅读?
继续免费阅读全文产品配置单
北京富尔邦科技发展有限责任公司为您提供《锂离子电池中深度剖析检测方案(激光诱导击穿)》,该方案主要用于锂电池中深度剖析检测,参考标准《暂无》,《锂离子电池中深度剖析检测方案(激光诱导击穿)》用到的仪器有美国ASI 激光诱导击穿光谱仪(LIBS)。
我要纠错
推荐专场
相关方案


 咨询
咨询
