

方案详情文
智能文字提取功能测试中
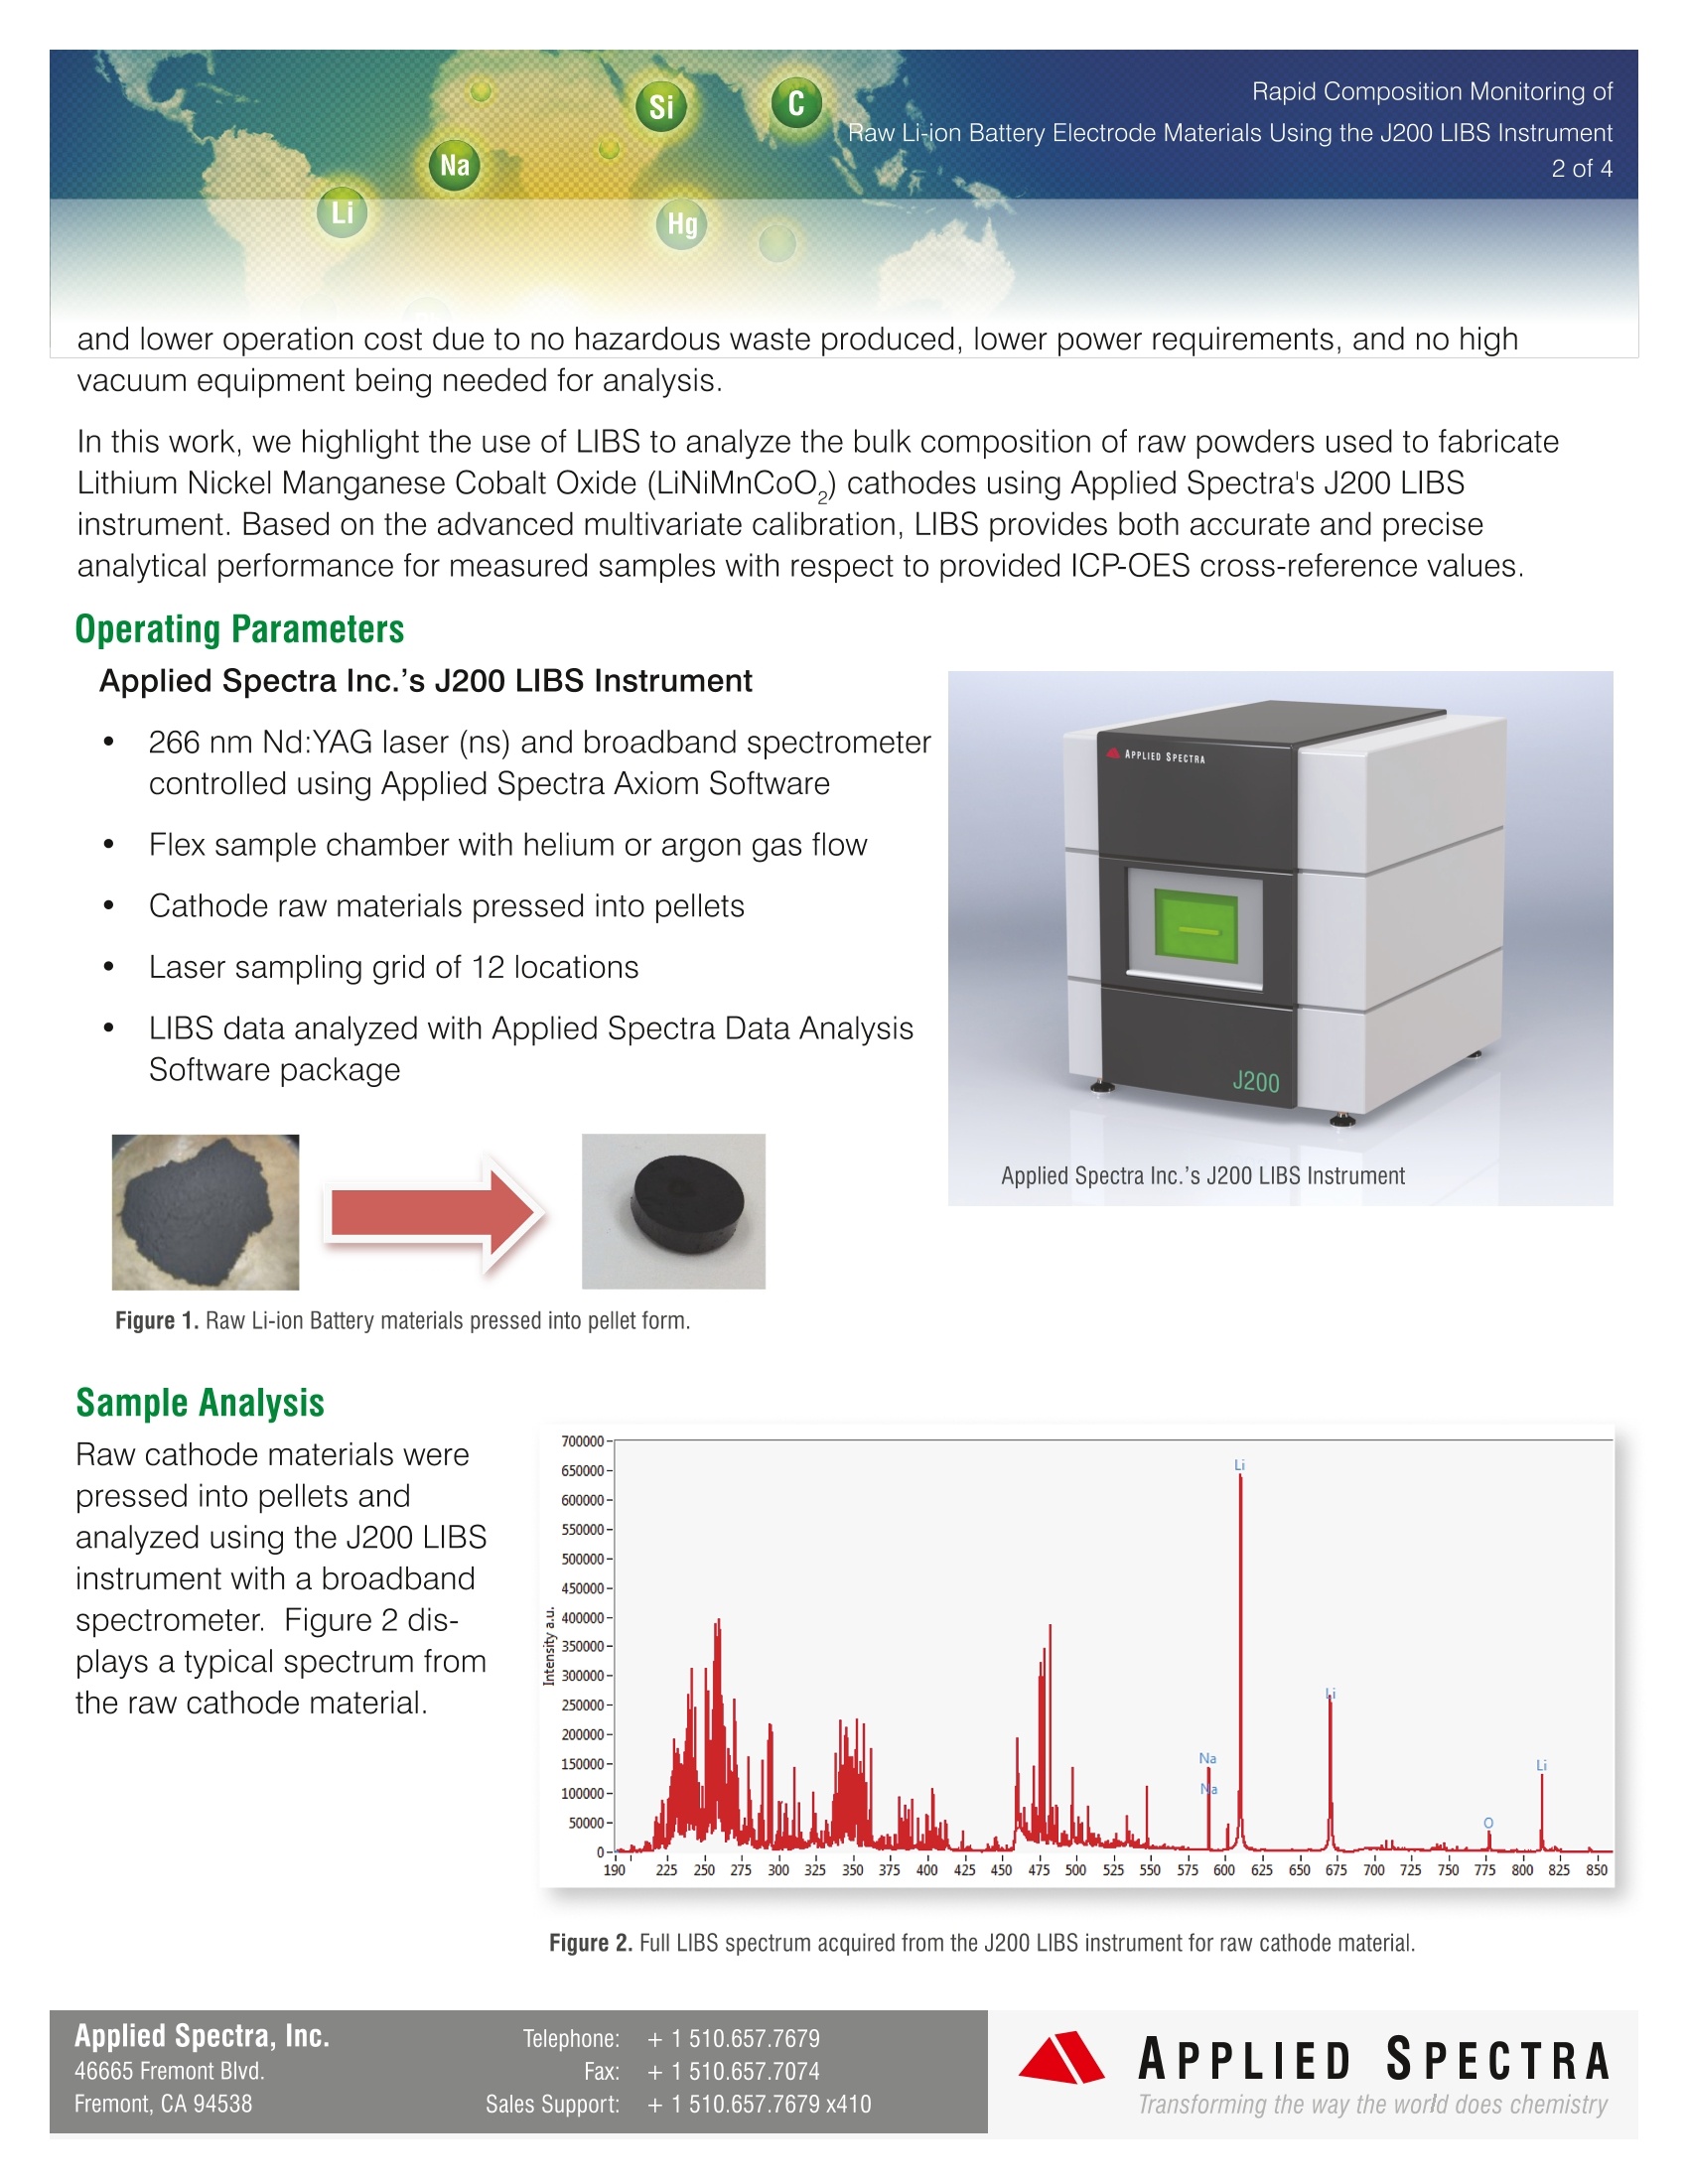
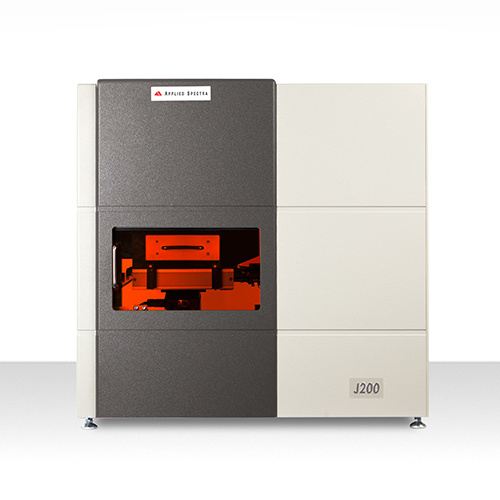
Introduction Since introduction of the first commercial Li-Ion battery by Sony in the early 1990's, thedemand for the Li-ion battery has steadilyincreased due to growing number of con-sumer electronic devices that rely on Li-ionbatteries for power. In recent years, thedemand for the Li-ion battery has soared asits use has exploded in electric and hybridelectric vehicle power applications. Theperformance specification for the Li-ionbattery is significantly more stringent for automotive applications with respect to power density, energy density, cycle life, and reliability. Many electrodechemistries are being assessed to improve Li-ion battery performance. Maintaining accurate chemistry in the fabricated battery cathode and anode is critical in optimizing batteryperformance. Monitoring elemental composition of incoming raw materials for the battery electrodes is a vitalquality control step to ensure proper battery chemistry in the final products. The techniques that are typicallyused to analyze these raw materials, such as ICP-OES, are solution-based and require the samples to bedigested. These techniques deliver accurate and reliable results, but digestions take time, creates hazardouswaste, and may not be suitable for rapid quality control of incoming raw materials. Monitoring elemental composition ofincoming raw materials for battery electrodesis a vital quality control step to ensure properbattery chemistry in final products. Laser Induced Breakdown Spectroscopy(LIBS) provides real-time analysis of the rawmaterials for the Li-ion battery electrode inboth powder and pressed pellet form. Thisprovides advantages such as, little to nosample preparation, high analysis throughput, and lower operation cost due to no hazardous waste produced, lower power requirements, and no highvacuum equipment being needed for analysis. In this work, we highlight the use of LIBS to analyze the bulk composition of raw powders used to fabricateLithium Nickel Manganese Cobalt Oxide (LiNiMnCoO,) cathodes using Applied Spectra's J200 LIBSinstrument. Based on the advanced multivariate calibration, LIBS provides both accurate and preciseanalytical performance for measured samples with respect to provided ICP-OES cross-reference values. Operating Parameters Applied Spectra Inc.’s J200 LIBS Instrument 266 nm Nd:YAG laser (ns) and broadband spectrometercontrolled using Applied Spectra Axiom Software Flex sample chamber with helium or argon gas flow Cathode raw materials pressed into pellets Laser sampling grid of 12 locations LIBS data analyzed with Applied Spectra Data AnalysisSoftware package Figure 1. Raw Li-ion Battery materials pressed into pellet form. Sample Analysis Raw cathode materials werepressed into pellets andanalyzed using the J200 LIBSinstrument with a broadbandspectrometer. Figure 2 dis-plays a typical spectrum fromthe raw cathode material. Figure 2. Full LIBS spectrum acquired from the J200 LIBS instrument for raw cathode material. Applied Spectra Inc.'s J200 LIBS Instrument LIBS spectra can be complexin nature if the user doesn'thave a proper database tohelp assign atomic lines.Figure 3 shows a few of theatomic lines that wereeasily identified using the ASlTruLIBS database. The ana-lytes of interest for this studywere labeled and displayedin Figs. 2 and 3. As seenfrom the figures, LIBSemission lines associatedwith main composition of theraw LiNiMnCoO2 cathodematerial such as Li, Ni, Mn, Figure 3. Displays a smaller section of the full LIBS spectrum in order to visually view the Ni, Mn, Co, and Featomic lines. Co, and O were effectively captured by the J200 LIBS instrument and can be used to quantify the concentra-tion of these elements. Furthermore, the figures show other contaminants in the raw powders such as Fe,Ca and Na that can be also quickly screened. Five raw cathode materials were analyzed to develop the bestmultivariate calibration method for raw cathode materials. Traditional univariate calibration curves were alsoassessed using the main atomic line for each analyte in comparison to multivariate calibration curves thatutilize each data point from the entire spectrum of each sample. Figure 4. Traditional calibration curve for nickel (integration of Ni peak at 361.9 nm) on the Left and multivariate calibration curve for nickel (uses entire spectrum)on the Right Si C Rapid Composition Monitoring of Raw Li-ion Battery Electrode Materials Using the J200 LIBS Instrument Na 4 of 4 Li Hg a 7.75 y=0.6797x+2.2803 R2=0.99135 7.50 7.25 7.00 6.75 25 cocco 6.75 7.00 7.25 7.50 7.75 Provided Concentration (%) c 20 Figure 5. Multivariate calibration curve for a) Li, b) Co, and c) Mn. Figure 4 shows a nickel calibration curve produced usingboth traditional univariate and multivariate methods. Thetraditional method of integrating a single peak for Ni and themultivariate method using the entire spectrum show a linearresponse for the calibration samples, with the multivariateanalysis showing improved linearity and precision of the cali-bration. Figure 5 shows the multivariate calibration curvesresponses for Li, Co, and Mn. The calibration curves havegood precision ranging from 0.5 -4.1 %RSD for Ni, 0.4 - 1.0%RSD for Li, 1.2-5.6 %RSD for Co, and 1.5 -8.1%RSD forMn. Two reference samples, also measured by ICP-OES,were tested for Li, Ni, Co, and Mn concentration based on the multivariate calibration aforementioned. Table 1 shows the accuracy and precision of the method for Li, Ni,Co, and Mn. The results show very good precision (≤2 %RSDs) and accuracy that is <3% Bias for all butone element, which was < 8 % Bias (Li for reference sample1). Table 1. Accuracy and precision values of the multivariate calibration method results for two raw material samples. Li Ni Co Mn Reference Wt.% % Wt.% % Wt.% % Wt. % % Sample Bias Bias Bias Bias 1 7.51±0.02 7.9 23.9±0.5 0.5 17.9±0.4 -1.3 17.5±0.3 -1.1 2 7.54±0.04 2.9 42.1±0.2 -0.9 6.07 ±0.12 1.3 11.1±0.2 2.6 Conclusion Applied Spectra's J200 LIBS instrument provided quick and effective measurements for understanding thecomposition of raw cathode materials. In addtion, multivariate analysis showed the ability to remove matrixeffects, provided linear calibration curves, and displayed good accuracy and precision in the analyzedsamples. This proof of concept study can be easily transferred to a laboratory or factory setting. APPLIEDSPECTRAwww.AppliedSpectra.comTransforming the way the world does chemistry 本研究感兴趣的分析物被标记并显示在图2和3。从图中可以看出,LiNiMnCoO2正极原材料中Li、Ni、Mn、Co、O等元素相关的LIBS发射线可以被J200 LIBS仪器有效收集,并且可以用来定量这些元素的浓度。 图2 从J200 LIBS仪器获得的正极原料的LIBS全光谱 图3 显示整个LIBS光谱的较小部分,以便直观地查看Ni、Mn、Co和Fe原子线 LIBS发射线与未加工的LiNiMnCoO2阴极材料的主要成分如Li,Ni,Mn相关,而且O能被J200 LIBS仪器有效捕获,可用于量化这些元素的浓度。此外,图中还显示了原料粉末中的其他杂质,如Fe、Ca和Na也可以快速筛选。通过对五种正极原材料的分析,确定了正原极材料的多元校正方法。表1 多元校正方法对两个原材料样品的精度和精密度值的校正结果 采用ICP-OES法测定了两个参考样品的Li、Ni、Co、Mn浓度,并进行了多元校正。表1给出了该方法Li、Ni、Co、Mn的准确度和精密度。结果表明,该方法具有良好的精密度(≤2% RSDs),除1个元素<8%外(样品1中Li),其余元素的准确度均<3%偏差。
关闭-
1/4

-
2/4
还剩2页未读,是否继续阅读?
继续免费阅读全文产品配置单
北京富尔邦科技发展有限责任公司为您提供《锂离子电池电极原料中多种元素检测方案(激光诱导击穿)》,该方案主要用于锂电池中多种元素检测,参考标准《暂无》,《锂离子电池电极原料中多种元素检测方案(激光诱导击穿)》用到的仪器有美国ASI 激光诱导击穿光谱仪(LIBS)。
我要纠错
推荐专场
相关方案
 咨询
咨询