锂离子电池负极样品中粘结剂、活性材料(AM)和导电剂均匀度检测方案(激光诱导击穿)
检测样品 锂电池
检测项目 粘结剂、活性材料(AM)和导电剂均匀度

 白金会员
68 篇解决方案
方案详情文
智能文字提取功能测试中
Are you mixing your bindercorrectly for optimalLi-ion battery performance?APPLIEDSPECTRAwww.AppliedSpectra.comTransforming the way the world does chemistry AISi P CE GaG Se PdAg In Si C ASI Tech Brief: Na PhBi AL uu Uub Li Hg Pb B Na Co K in Fe Key words: Binder distribution, binder concentration,Li-ion battery electrodes Binder is one of the critical Li-ion battery materialsused for fabricating electrodes. The binder is mixedwith an active material (AM) along with a conductiveagent (Figure 1). The binder holds the AM particlestogether and further bonds the AM-based electrodefilm to its substrate - the current collector. Duringthe battery charge and discharge cycle, the elec-trode AM particles may experience immense volumechange, as large as 300%, in high-capacity Li-ionanode materials such as silicon. For reliable andoptimal battery performance, the binder must be dis- Figure 1. Binder, active materials, and conductive agent on an electrode fluorine content. However, due to its high ionizationpotential, fluorine has been a difficult element fortraditional analysis techniques, involving ICP excita-tion source. Laser Induced Breakdown Spectroscopy (LIBS) hasreceived significant attention in recent years for rapidmeasurement of F without the need for any samplepreparation. Figure 2 shows the J200 LIBS instru-ment manufactured by Applied Spectra, Inc. WithLIBS, the laser beam is focused on the electrodesurface to ionize a minute amount of sample in orderto generate a plasma emission. The emitted lightcan be subsequently analyzed for chemical content. One of the most commonly used binders in Li-ion battery manufacturing is Polyvinylidene Fluoride, also knownas PVDF. For PVDF, it is possible to monitor the binder distribution in the electrode by tracking the variation of the Figure 2. Applied Spectra Inc.'s J200 LIBS Instrument Additionally, the laser targeting can be spatially controlled, allowing for mapping of binder distribution in the elec-trode. In this case study, the J200 LIBS instrument was used to perform high lateral resolution for Li-ion battery anodesamples. The analyzed anodes were based on graphite active material on copper substrate. Two anodes, labeledA and B, were prepared using two different mixing times of 4 and 60 minutes. The samples were mapped for F incomparably sized areas (2x2 mm). The selected areas were analyzed using a software-generated grid pattern,with a 40 um laser spot size. Within the grid pattern, one laser shot per location was applied, and multiple passesover the entire grid were made until the substrate (Cu) was reached. At the selected laser energy, 2 passes wererequired to reach the Cu substrate. The laser energy can be varied to change the profiling resolution. Furthermore,the laser spot size can be adjusted to vary the spatial resolution for the mapping. The F LIBS data was analyzedusing Applied Spectra’s data analysis software. Figure 2 shows the comparison of the binder distribution for fluorine betweenanodes A and B. In the mappingresults for the first pass, the F distri-bution resulted in a RSD of 34% forsample A, and 27% for sample B, witha noticeably higher intensity for F insample B compared to sample A. Forthe second pass, the RSD obtained forsample A is 42% compared to 51% forsample B. Also for the second pass,sample A showed higher F intensitycompared to sample B in the mappedregion. It can be seen that differentmixing times for the anode materialhave led to different distribution of thebinder in the anode. Applied Spectra's J200 LIBS instru-ment can provide rapid feedback on Figure 2. F distribution between anodes A and B. Maps based on a 18x18 grid with a 40um spot size. binder distribution resulting from different processing conditions. With fast measurement times the J200 LIBSinstrument can also enable rapid inline QC of binder distribution on the production floor. For more information please contact Lucille East, at marketing@appliedspectra.com, orvisit http://www.appliedspectra.com/technology/LIBS.html. Applied Spectra, Inc. Telephone: +1510.657.7679 46665 Fremont Blvd. Fax: +1510.657.7074 APPLIED SPECTRA Fremont, CA 94538 Sales Support: +1510.657.7679 x410 Transforming the way the world does chemistry 图2显示了负极A和B氟分布的结果,第一张图中样品a中F分布的RSD为34%,样品B中F分布的RSD为27%,样品B中F的强度明显高于样品a。第二张图中样品A的RSD为42%,而样品B的RSD为51%。图中A样品的F强度高于B样品。可以看出,不同的阳极材料混合时间导致了粘结剂在阳极中的分布不同。可以看出,不同的负极材料的混合时间导致了粘结剂在负极中的分布不同。
关闭-
1/2
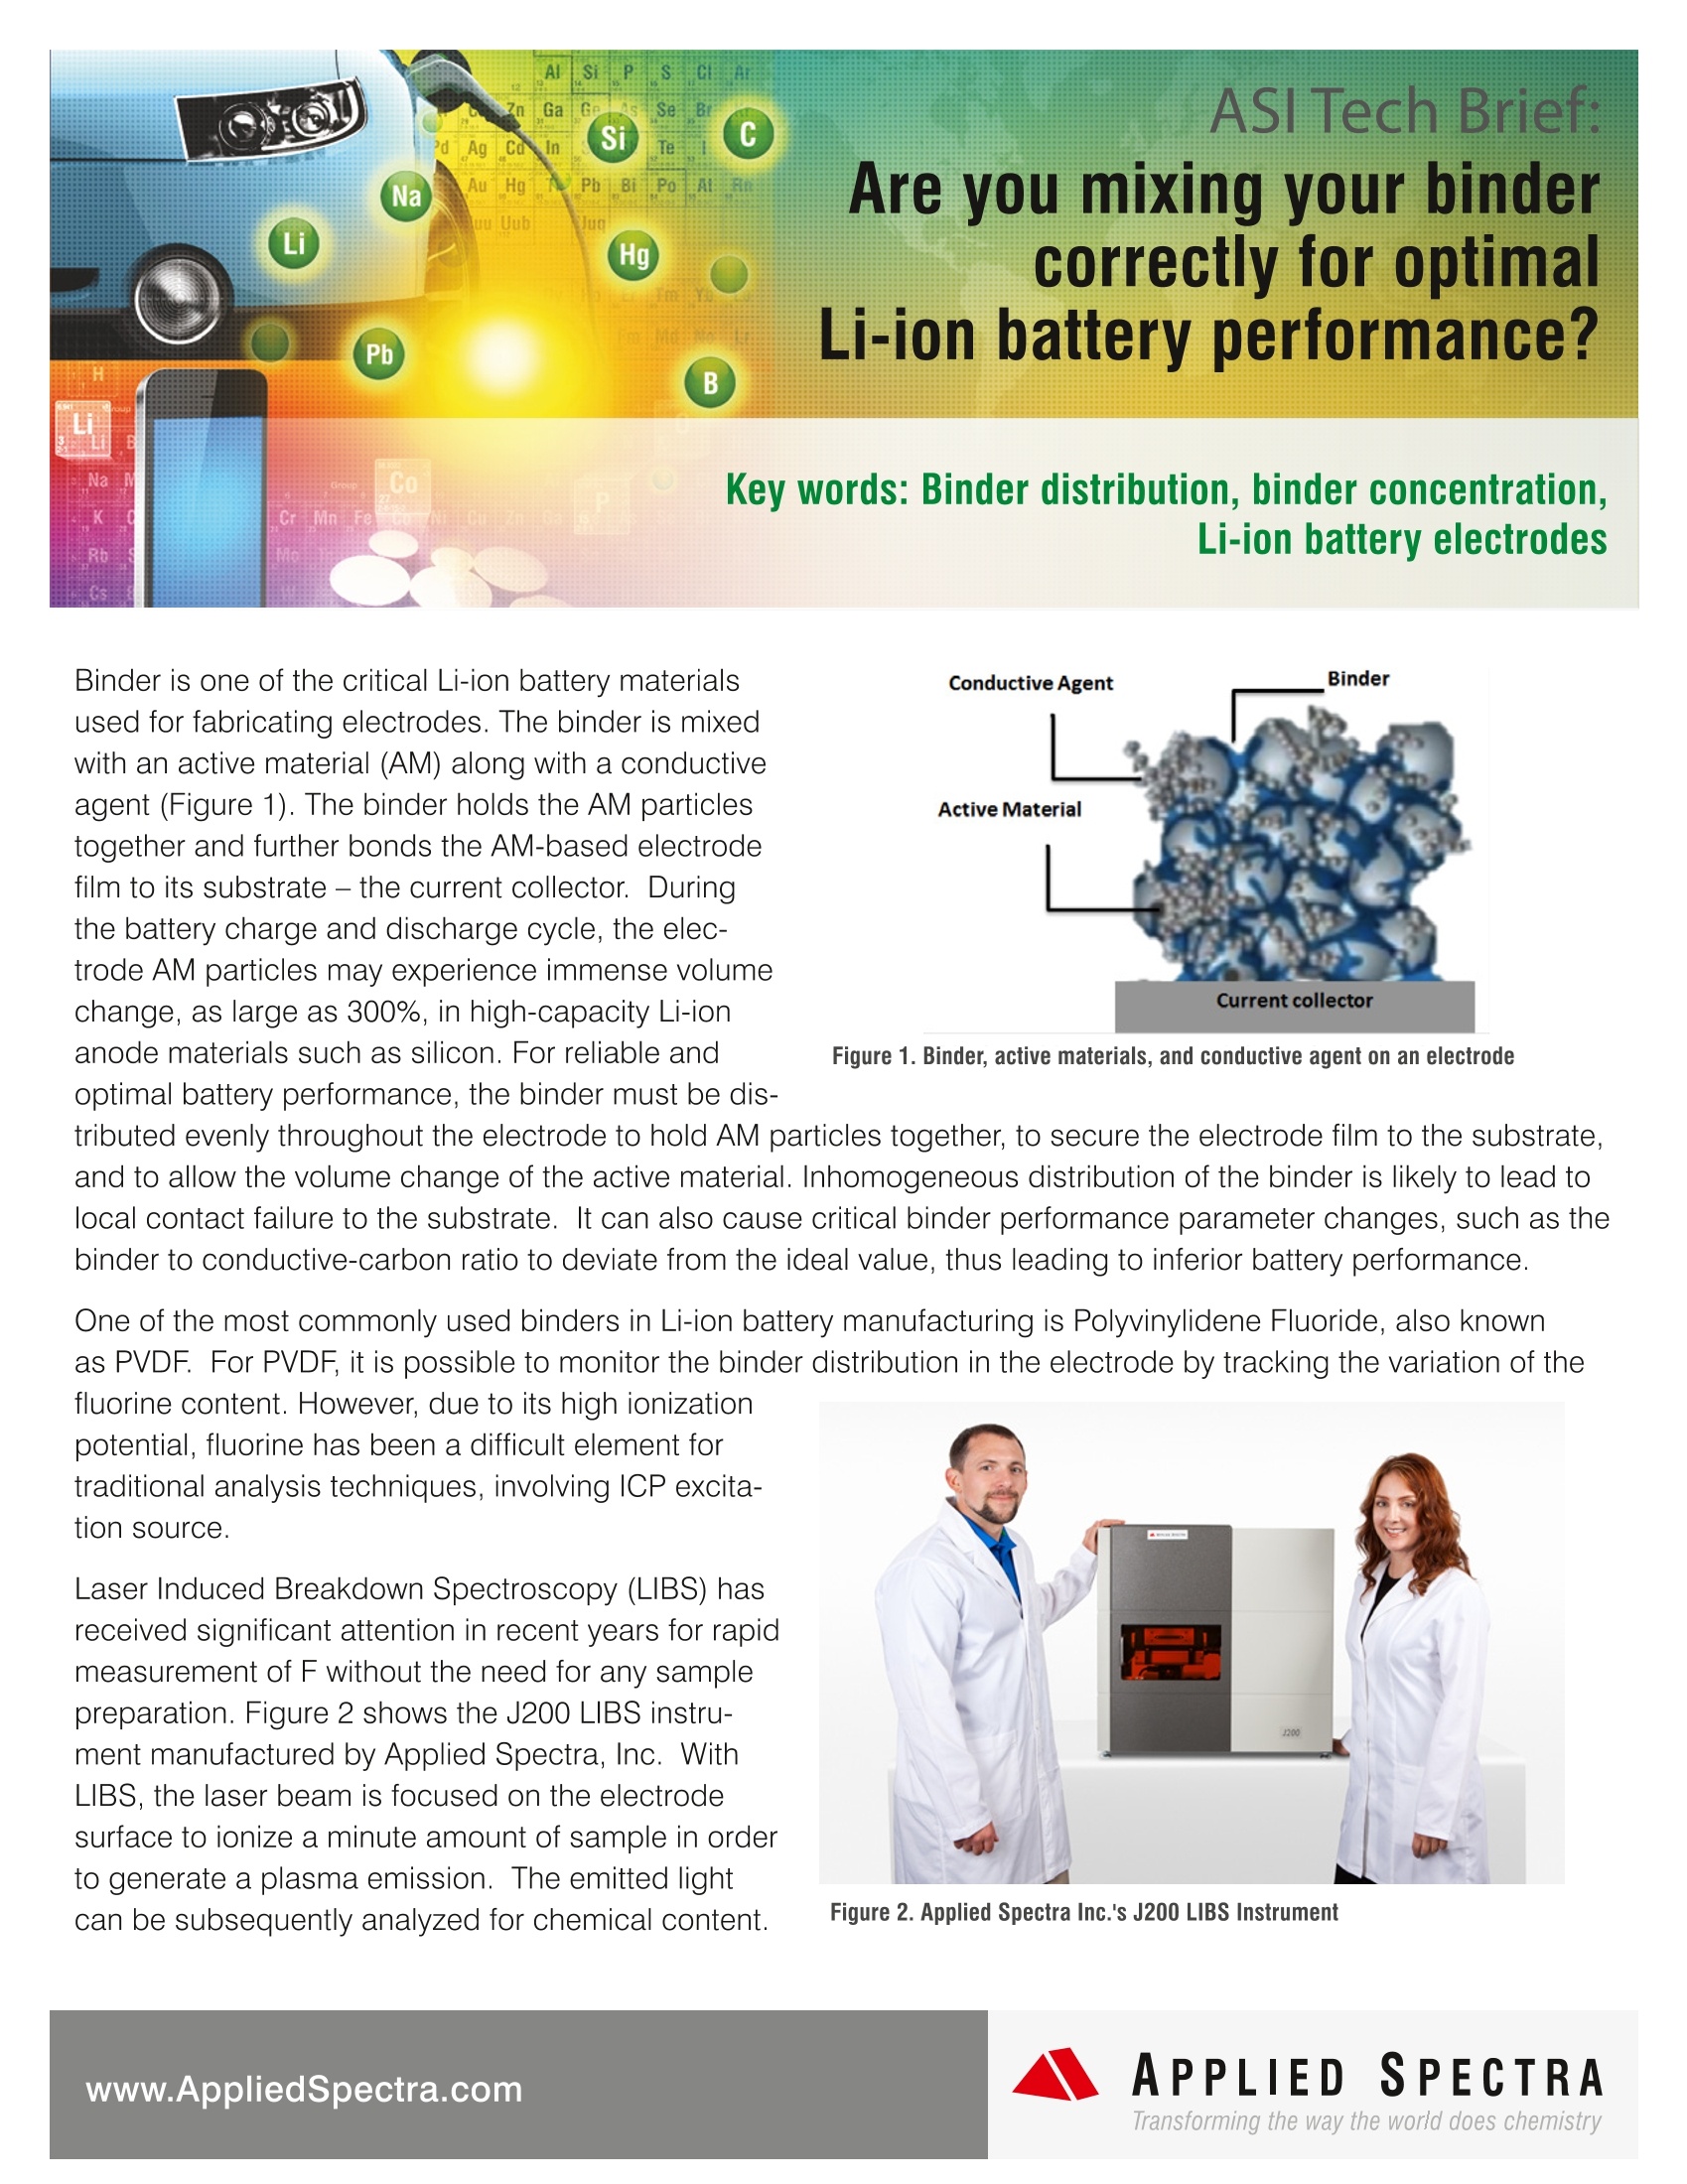
-
2/2
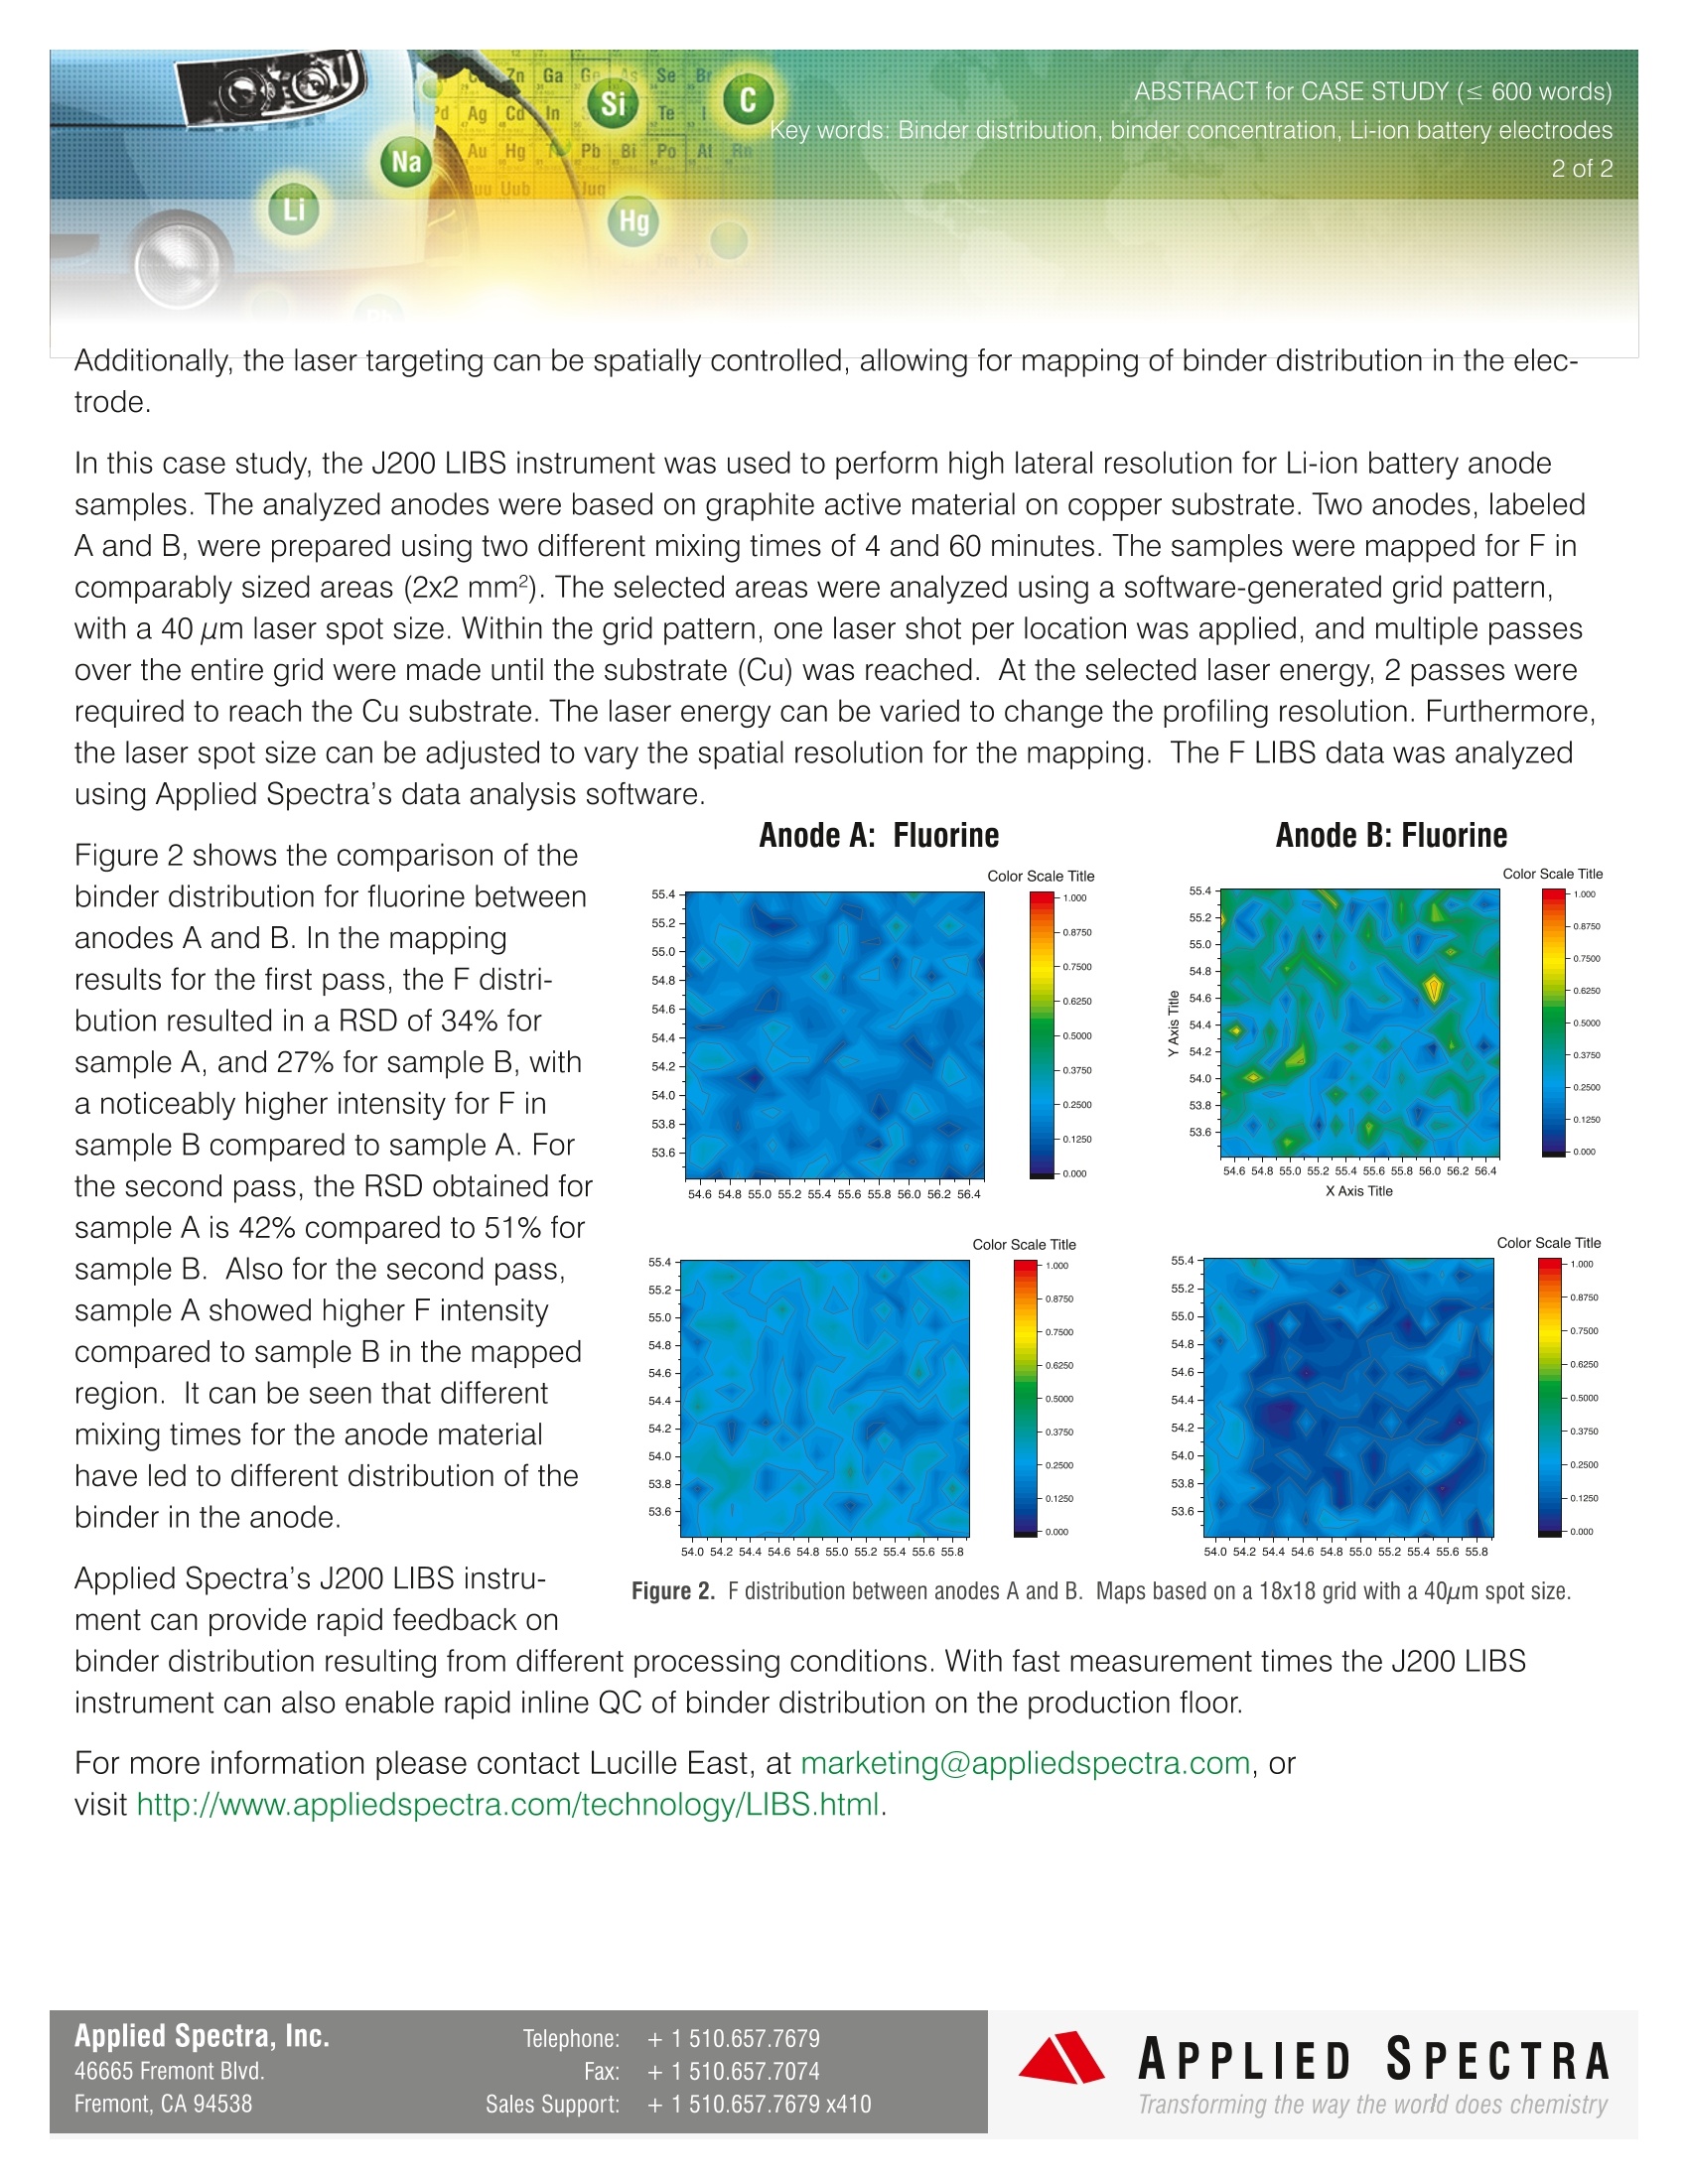
产品配置单
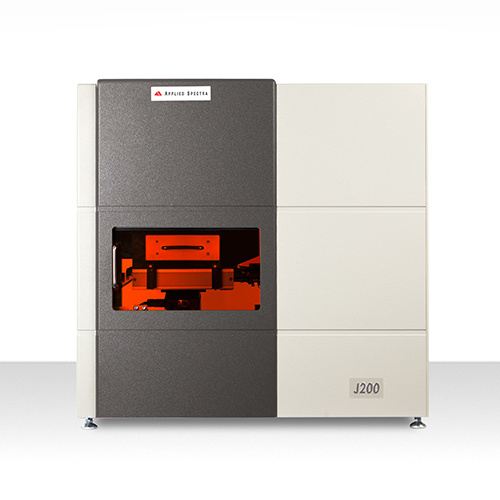
北京富尔邦科技发展有限责任公司为您提供《锂离子电池负极样品中粘结剂、活性材料(AM)和导电剂均匀度检测方案(激光诱导击穿)》,该方案主要用于锂电池中粘结剂、活性材料(AM)和导电剂均匀度检测,参考标准《暂无》,《锂离子电池负极样品中粘结剂、活性材料(AM)和导电剂均匀度检测方案(激光诱导击穿)》用到的仪器有美国ASI 激光诱导击穿光谱仪(LIBS)。
我要纠错
推荐专场
相关方案
 咨询
咨询
