

第1楼2005/03/26
Precision
The term precision is used in describing the agreement of a set of results among themselves. Precision is usually expressed in terms of the deviation of a set of results from the arithmetic mean of the set (mean and standard deviation to be discussed later in this section). The student of analytical chemistry is taught - correctly - that good precision does not mean good accuracy. However, It sounds reasonable to assume otherwise.
Why doesn't good precision mean we have good accuracy? We know from our discussion of error that there are systematic and random errors. We also know that the total error is the sum of the systematic error and random error. Since truly random error is just as likely to be negative as positive, we can reason that a measurement that has only random error is accurate to within the precision of measurement and the more precise the measurement, the better idea we have of the true value, i.e., there is no bias in the data. In the case of random error only, good precision indicates good accuracy.
Now lets add the possibility of systematic error. We know that systematic error will produce a bias in the data from the true value. This bias will be negative or positive depending upon the type and there may be several systematic errors at work. Many systematic errors can be repeated to a high degree of precision. Therefore, it follows that systematic errors prevent us from making the conclusion that good precision means good accuracy. When we go about the task of determining the accuracy of a method, we are focusing upon the identification and elimination of systematic errors. Don't be misled by the statement that 'good precision is an indication of good accuracy.' Too many systematic errors can be repeated to a high degree of precision for this statement to be true.
The VIM uses the terms 'repeatability' and 'reproducibility' instead of the more general term 'precision.' The following definitions and notes are taken directly from the VIM:
Repeatability (of results of measurements) - the closeness of the agreement between the results of successive measurements of the same measurand carried out under the same conditions of measurement.
Additional Notes:
1. These conditions are called repeatability conditions.
2. Repeatability conditions include the same measurement procedure, the same observer, the same measuring instrument, used under the same conditions, the same location, and repetition over a short period of time.
Reproducibility (of results of measurement) - the closeness of the agreement between the results of measurements of the same measurand carried out under changed conditions of measurement.
Additional Notes:
1. A valid statement of reproducibility requires specification of the conditions changed.
2. The changed conditions may include principle of measurement, method of measurement, observer, measuring instrument, reference standard, location, conditions of use, and time.
When discussing the precision of measurement data, it is helpful for the analyst to define how the data are collected and to use the term 'repeatability' when applicable. It is equally important to specify the conditions used for the collection of 'reproducibility' data.
第2楼2005/03/26
Mean
The definition of mean is, "an average of n numbers computed by adding some function of the numbers and dividing by some function of n." The central tendency of a set of measurement results is typically found by calculating the arithmetic mean () and less commonly the median or geometric mean. The mean is an estimate of the true value as long as there is no systematic error. In the absence of systematic error, the mean approaches the true value (? as the number of measurements (n) increases. The frequency distribution of the measurements approximates a bell-shaped curve that is symmetrical around the mean. The arithmetic mean is calculated using the following equation:
= (X1 + X2 + ···Xn) / n (14.2)
Typically, insufficient data are collected to determine if the data are evenly distributed. Most analysts rely upon quality control data obtained along with the sample data to indicate the accuracy of the procedural execution, i.e., the absence of systematic error(s). The analysis of at least one QC sample with the unknown sample(s) is strongly recommended.
Even when the QC sample is in control it is still important to inspect the data for outliers. There is a third type of error typically referred to as a 'blunder'. This is an error that is made unintentionally. A blunder does not fall in the systematic or random error categories. It is a mistake that went unnoticed, such as a transcription error or a spilled solution. For limited data sets (n = 3 to 10), the range (Xn-X1), where Xn is the largest value and X1 is the smallest value, is a good estimate of the precision and a useful value in data inspection. In the situation where a limited data set has a suspicious outlier and the QC sample is in control, the analyst should calculate the range of the data and determine if it is significantly larger than would be expected based upon the QC data. If an explanation cannot be found for an outlier (other than it appears too high or low), there is a convenient test that can be used for the rejection of possible outliers from limited data sets. This is the Q test.
The Q test is commonly conducted at the 90% confidence level but the following table (14-3) includes the 96% and 99% levels as well for your convenience. At the 90% confidence level, the analyst can reject a result with 90% confidence that an outlier is significantly different from the other results in the data set. The Q test involves dividing the difference between the outlier and it's nearest value in the set by the range, which gives a quotient - Q. The range is always calculated by including the outlier, which is automatically the largest or smallest value in the data set. If the quotient is greater than the refection quotient, Q0.90, then the outlier can be rejected.
Table 14.3: The Q Test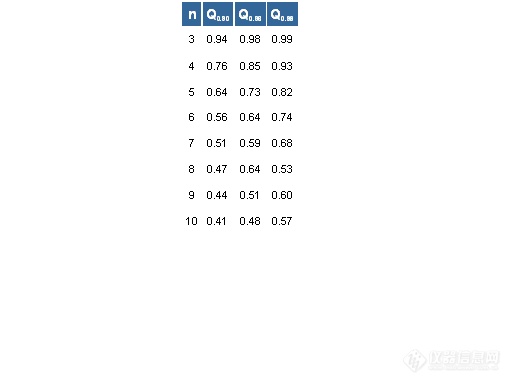
Example: This example will test four results in a data set--1004, 1005, 1001, and 981.
The range is calculated: 1005 - 981 = 24.
The difference between the questionable result (981) and its nearest neighbor is calculated: 1001 - 981 = 20.
The quotient is calculated: 20/24 = 0.83.
The calculated quotient is compared to the Q0.90 value of 0.76 for n=4 (from table 14.3 above) and found to be greater.
The questionable result (981) is rejected.
Standard Deviation
A useful and commonly used measure of precision is the experimental standard deviation defined by the VIM as... "for a series of n measurements of the same measurand, the quantity s characterizing the dispersion of the results and given by the formula:
s = [ ∑ (xi-)2 / (n-1) ]1/2 (14.4)
xI being the result of the i-th measurement and being the arithmetic mean of the n results considered."
The above definition is for estimating the standard deviation for n values of a sample of a population and is always calculated using n-1. The standard deviation of a population is symbolized as s and is calculated using n. Unless the entire population is examined, s cannot be known and is estimated from samples randomly selected from it. For example, an analyst may make four measurements upon a given production lot of material (population). The standard deviation of the set (n=4) of measurements would be estimated using (n-1). If this analysis was repeated several times to produce several sample sets (four each) of data, it would be expected that each set of measurements would have a different mean and a different estimate of the standard deviation.
The experimental standard deviations of the mean for each set is calculated using the following expression:
s / (n)1/2 (14.5)
Using the above example, where values of 1004, 1005, and 1001 were considered acceptable for the calculation of the mean and the experimental standard deviation the mean would be 1003, the experimental standard deviation would be 2 and the standard deviation of the mean would be 1.
Significant figures will be discussed along with calculation of the uncertainty of measurement in part 15.