
第2楼2005/03/30
PPB Stability Study:
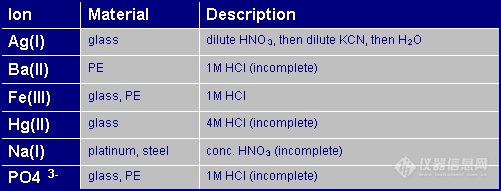
An adsorption test was conducted at IV in an attempt to better understand the stability of mixed element solutions at the ppb concentration level in low density polyethylene (LDPE) bottles. The stability of metals at the ppb level in this container material was of significant concern.
- Experimental Design -
A blend of 65 elements from Inorganic Ventures / IV Labs' CMS-SET was prepared at the 0, 2, 10, and 100 ppb concentration level in 1 % (v/v) HNO3 at the start of the study.
The set consists of the following;
CMS-1 - 10 礸/mL Ce, Dy, Er, Eu, Gd, Ho, La, Lu, Nd, Pr, Sm, Sc, Tb, Th, Tm, U, Yb, Y in 3.5 % HNO3
CMS-2 - 10 礸/mL Au, Ir, Pd, Pt, Re, Rh, Ru, and Te in 3.5 % HCl
CMS-3 - 10 礸/mL Ge, Hf, Mo, Nb, Ta, Sn, Ti, W, and Zr in 3.5 % HNO3 tr. HF
CMS-4 - 10 礸/mL Sb, As, Ba, Be, Bi, B, Cd, Ga, In, Pb, Se, Tl, and V in 3.5 % HNO3
CMS-5 - 10 礸/mL Ag, Al, Ca, Cs, Cr+3, Co, Cu, Fe, Li, Mg, Mn, Ni, K, Rb, Na, Sr, and Zn in 3.5 % HNO3
Only LDPE bottles (500 mL) were used.
The LDPE bottles were acid leached with 1% nitric acid for 59 hours at 60 °C. New blends prepared in the same way were compared to the original preparation at 1, 3, 25, 75, 137, 300, and 375 days.
The New blends were compared to the original blend using ICP-MS and the relative % loss was calculated.
The ICP-MS used is in a clean room limiting environmental contamination (opened 1 % nitric acid solutions in similar LDPE bottles placed around the auto-sampler yielded no detectable environmental contamination at times of ~ 100 hours).
Measurements of each blend were made in the same LDPE bottle i.e. the blend was not exposed to any other container during the study.
第3楼2005/03/30
- Experiment Results -
Hg was not stable long enough to measure (minutes).
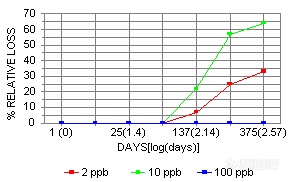
Au was the next most unstable element, showing instability at the 2, 20, and 100 ppb levels at 3 days.
Pd showed instability only at the 2 and 10 ppb levels at 3 days.
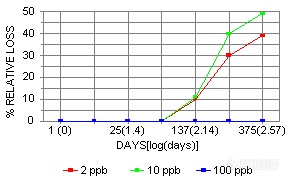
Pt and Ta showed instability only at the 2 and 10 ppb levels at 137 days.
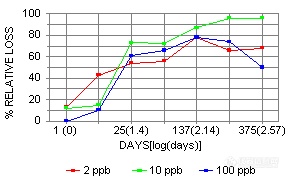
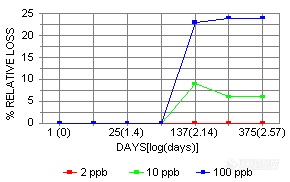
Ag showed instability only at the 10 and 100 ppb levels at 137 days.
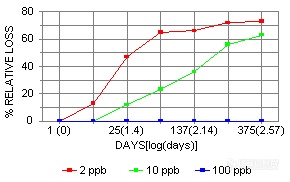
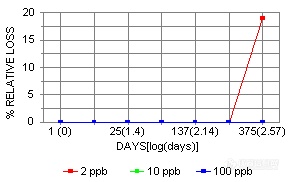
Mo, Sn, and Hf showed instability only at the 2 ppb level at 375 days.
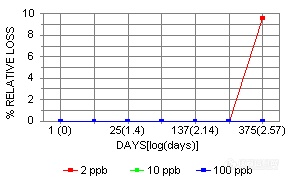
Ir showed instability only at the 2 ppb level at 300 days.
All other elements showed no instability at 2-100 ppb for 375 days, including:
Ce, Dy, Er, Eu, Gd, Ho, La, Lu, Nd, Pr, Sm, Sc, Tb, Th, Tm, U, Yb, Y, Re, Rh, Ru, Te, Ge, Nb, Ti, W, Zr, Sb, As, Ba, Be, Bi, B, Cd, Ga, In, Pb, Se, Tl, V, Al, Ca, Cs, Cr+3, Co, Cu, Fe, Li, Mg, Mn, Ni, K, Rb, Na, Sr, and Zn.
Data - Elements with Instability:
The stability curves for the above elements listed as having some form of instability are shown below
第6楼2005/03/30
Figure 7.8: Hafnium (fluoride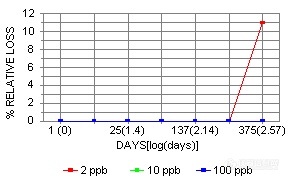
Figure 7.9: Iridium (chloride)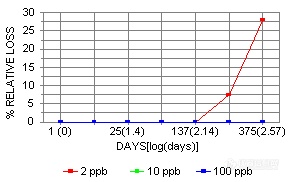
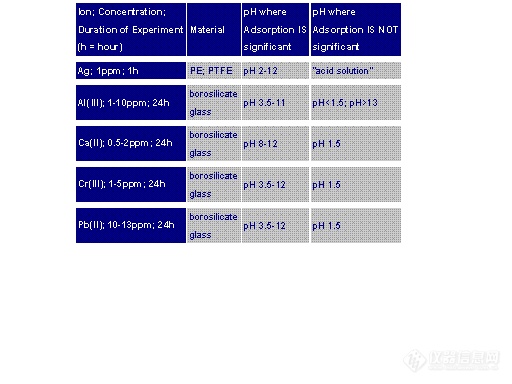
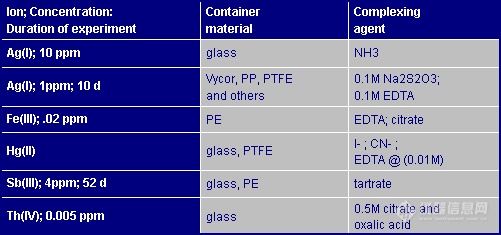
Summary of Findings:
The 1 % nitric acid solutions of the alkali, alkaline, and rare earth elements do not show any instability at the 2-100 ppb level in LDPE.
The majority of elements studied were found to be stable for 1 year at the 2-100 ppb level.
Silver (Ag) is the only unstable element found that is stable at the 2 ppb level. Ag's instability is most likely linked to its chloride chemistry (photo-reduction, precipitation).
Gold (Au) and Mercury (Hg), which are similar in stability, are the most unstable elements and are the only elements unstable at all of the concentration levels studied. They are also reported to stabilize one another.
Platinum (Pt), Tantalum (Ta), Molybdenum (Mo), Tin (Sn), Hafnium (Hf), and Iridium (Ir) were originally present as a fluoride or chloride complex.
Additional studies are planned for the stabilization of Hg and Au at the ppb level and will be reported when complete. It is hoped that conditions can be found that will stabilize these elements, making LDPE (the cleanest of plastics) as the preferred container material for the containment of all of the elements at the ppb concentration level.