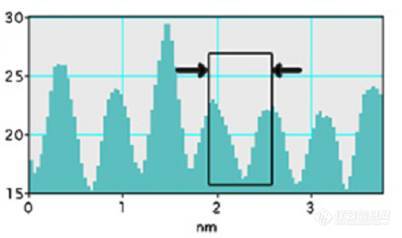
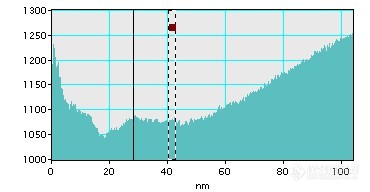
第一个图是我在文献中看到的,第二个图是利用DM软件的模版直接做出来的radial intensity distribution,然后程序说明The image is displayed in cardinal coordinates, and needs to be transformed into polar coordinates.给出的方法是:The transformation of coordinates ("img" in cardinal, "dst" in polar) is realized by bilinear interpolation (the use of warp function). Then line projection is easily calculated by adding up all the columns in "dst" (polar coordinates). The averaged line intensity is also normalized by the number of segment ("sample"). 我想把第二个图也做成像第一个图的那样子,不知道是不是就像程序说明的那样,需要做坐标转换,可是给出的方法我实在搞不定,来向各位请教