
第1楼2005/03/31
Line Selection
The first step in line selection is to simply choose the line(s) that meet the sensitivity requirements for your measurement. More than one line may be necessary due to spectral interferences.
Sensitivity:
Make sure that the line is not too sensitive (i.e. - going outside the linear working range). Dilutions are easy and hopefully you'll have more than one line that meets your lower limit of detection and quantitative measurement requirements. If you do not have line tables, we have listed the three most popular lines for each element (also included are detection limits for radial and axial view, as well as major interferences) in our Analytical Periodic Table.
Precision:
The precision of an ICP measurement is a function of many factors that are beyond our control. However, if you require an improvement in precision, consider the following:
Try to keep the analyte concentration well within the linear working range. When the concentration falls < 100 times the detection limit, the precision begins to fall.
Avoid lines requiring spectral correction.
Avoid lines that are in spectrally complex regions requiring sophisticated background correction algorithms.
Increasing the integration time to as high as 5 seconds should improve the precision. It should not be increased any higher.
Use an all glass introduction system including a glass concentric nebulizer. Your washout times will improve along with your precision.
Be weary of salting out effects when analyzing high salt containing solutions, but do not use high solids nebulizers unless necessary.
If your samples and standards have the same background then you should skip background correction.
If the matrices of the samples and standards can be matched then eliminate the peristaltic pump and go 'free flow'. The pump introduces pulsing and the pump tubing stretches, causing the introduction rate to gradually change. If you can avoid the pump then make sure the liquid levels of your samples and standards are the same.
NOTE: Slight differences in hydrostatic pressure will make a difference.
Do not begin the measurement unless the instrument has been allowed to warm up for at least an hour. Additionally, working in a temperature-controlled atmosphere is very advantageous.
Clean your introduction system and replace the tubing when a) you notice an increase in precision when using glass introduction systems, b) you notice a 'bend or crink' in the Teflon tubing, c) the torch begins to build up residue.
第2楼2005/03/31
Spectral Interferences:
The spectral tables are very useful, but they are no replacement for a spectral interference study. These studies should be performed on every instrument when it is installed and at least annually thereafter. These time-consuming and tedious studies are very necessary. They are performed by aspirating 1000 礸/mL solutions of the potential interfering element and looking at the spectral regions around possible analyte lines for unwanted spectral interferences. The types of spectral interferences encountered are direct spectral overlap, wing overlap, and near neighbors that may cause background correction problems. The spectral region for the analyte when a blank solution or the possible interfering element solution are analyzed are hopefully the same, indicating no spectral interference.
A trace metals analysis of the 1000 礸/mL solutions helps distinguish between a true direct spectral overlap and the presence of the analyte in the interfering element solution as an impurity. The absence of impurity data requires confirmation of the suspected direct spectral overlap using an alternate analyte line or another technique such as flame atomic absorption. Therefore, it is important to use standards with accurate trace metals impurity data.
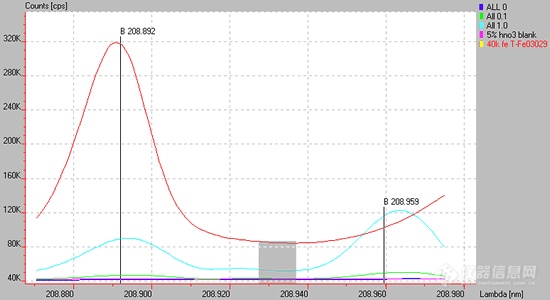
Fig. 15.1
Spectrum of a high Ca containing matrix (red line) causing a sloping background for the Cu 219.959 or Ge 219.871 lines are used. Background correction is difficult at best in these situations.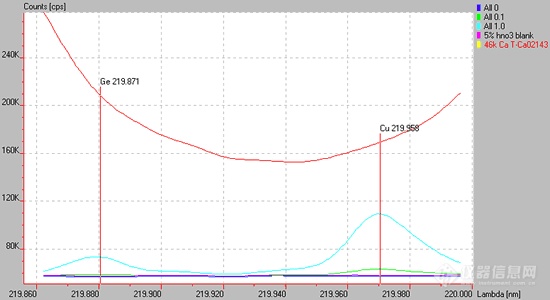
第6楼2005/03/31
Example of a Method:
The following method (MEB) covers a wide range of elements. This method is currently under development and is presented for line selection purposes - it is not a recommended method. The lines shown were chosen on the basis of sensitivity and relative freedom from spectral interference. It is important to point out that this method is intended for an axial view instrument. Cs is used as an internal standard / buffer (double duty) in this method. Data collected over the past 8 months indicates the method is giving accurate and reliable data. However, at least another 12 months of work is planned before releasing this method due to the unorthodox use of Cs as an internal standard. We believe this is because the level of Cs used 'overwhelms' the matrix.
第7楼2005/03/31
Matrix Effects
Matrix effects are arguably the most subtle danger to the ICP-OES analyst. Slight differences in the matrix can cause a considerable systematic error having a definite bias. Internal standardization has been the most common approach toward correcting this problem and this approach does work well in many cases. The choice of the internal standard is critical.
Please consider the following questions before using the internal standard approach for matrix correction:
Is the internal standard (IS) element compatible with your matrix? (Avoid using rare earths in fluoride matrices).
Are there any possible spectral interferences upon the IS line?
Is the concentration of the IS sufficient to give a good signal to noise ratio?
Can your sample possibly contain the IS element as a natural component?
Is the IS clean? Are the trace impurities reported on the certificate of analysis?
Is your method of addition of the IS very precise? Is the same amount added precisely to all standards, blanks, and samples?
Do you always use the same lot of IS for the standards and samples? (Using the same lot is very important).
If your plasma temperature were to go up or down is the IS likely to follow the same pattern of intensity change as the analyte? This is where many IS problems occur (i.e. - an IS with the same plasma / temperature behavior as the analyte is difficult [at best] to find for each analyte while avoiding other issues listed above).
The technique of standard additions is a tedious but more reliable approach for matrix correction. For unknown matrices it may well be the fastest approach. When using standard additions on unknown matrices, it is possible to have severe spectral and background correction problems. It is cautioned here that at least two spectral lines should be used and the spectral region carefully scanned and studied. Attempt to make the additions approximately 2x and 3x, where x is the analyte concentration.