
名字长了容易引起注意
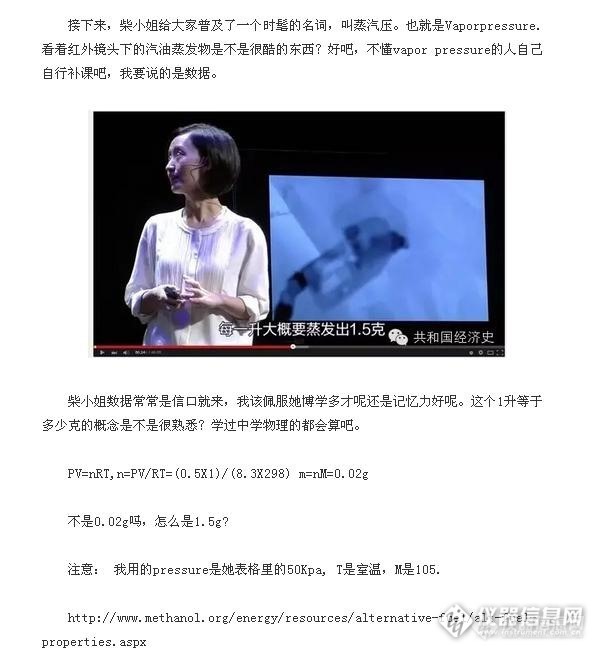
第1楼2015/03/04
二、混淆雾霾和PM2.5的反驳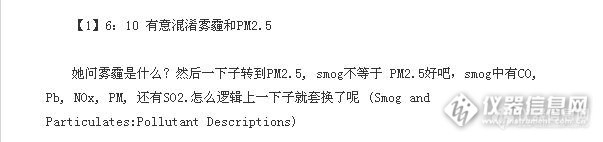
现在让我们重新学习一下雾霾和pm2.5之间的关系: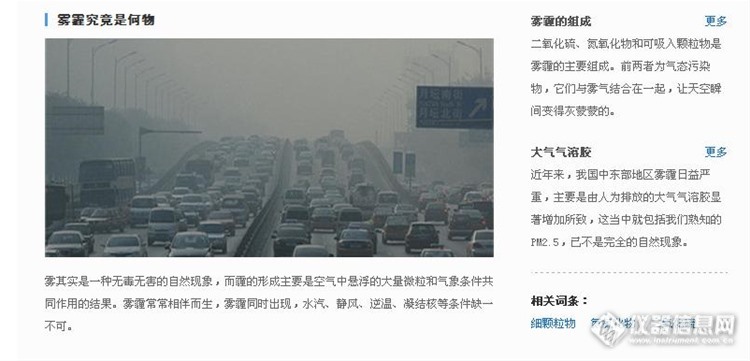
雾霾:百度百科的结果:二氧化硫、氮氧化物、可吸入颗粒物组成。
可吸入颗粒物:通常把粒径在10微米以下的颗粒物称为可吸入颗粒物,又称为PM10。可吸入颗粒物可以被人体吸入,沉积在呼吸道、肺泡等部位从而引发疾病。颗粒物的直径越小,进入呼吸道的部位越深。10微米直径的颗粒物通常沉积在上呼吸道,5微米直径的可进入呼吸道的深部,2微米以下的可100%深入到细支气管和肺泡。
pm2.5:细颗粒物又称细粒、细颗粒、PM2.5。细颗粒物指环境空气中空气动力学当量直径小于等于 2.5 微米的颗粒物。它能较长时间悬浮于空气中,其在空气中含量浓度越高,就代表空气污染越严重。虽然PM2.5只是地球大气成分中含量很少的组分,但它对空气质量和能见度等有重要的影响。与较粗的大气颗粒物相比,PM2.5粒径小,面积大,活性强,易附带有毒、有害物质(例如,重金属、微生物等),且在大气中的停留时间长、输送距离远,因而对人体健康和大气环境质量的影响更大。
请注意看上述文字中红色标出的部分,雾霾中的可吸入颗粒物主要是PM10,但是属于PM10中的PM2.5会对空气质量和能见度有重要影响。也就是说,雾霾天气中的能见度主要是PM2.5所导致的。所以柴静直接把雾霾与PM2.5画上等号,是因为在雾霾中我们能之间看到并且对人体健康产生非常大影响的,就是PM2.5。二氧化硫、氮氧化物,你是看不到的。
所以,说偷换概念是不正确的。
=======================================================================================
=======================================================================================
reytop
第5楼2015/03/04
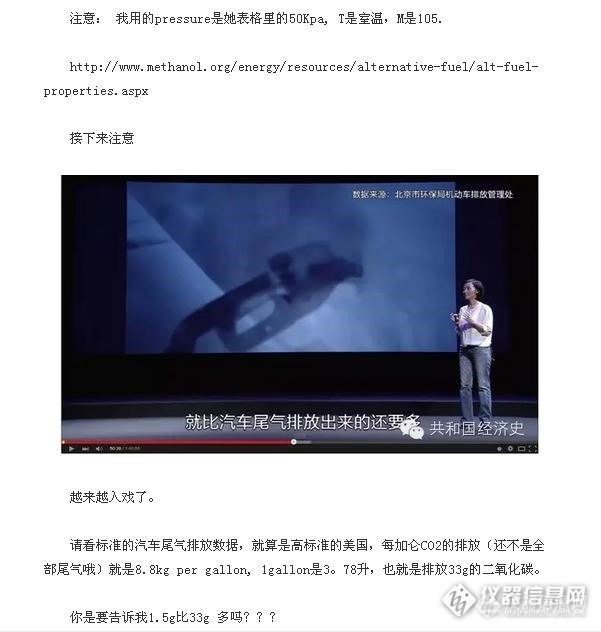
赚个朋友的描述;先看这个图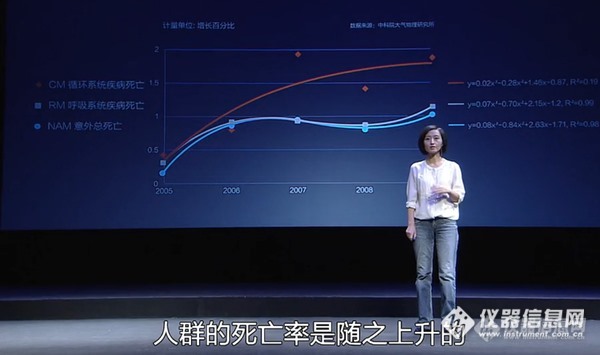
对应的柴静的表述
“这个复杂的图表显示的是,当PM2.5升高的时候,人群的死亡率是随之上升的,这个趋势
的测算,很多科研机构都做过”
这个图的文献来源:
Li P, Xin J, Wang Y, et al. Time-series analysis of mortality effects from
airborne particulate matter size fractions in Beijing. Atmospheric
Environment, 2013, 81: 253-262.
对应的文章里的图: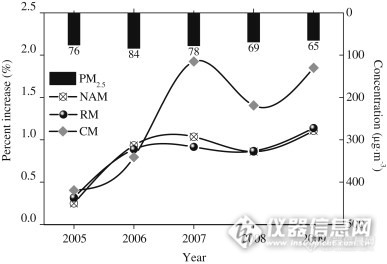
三条曲线,CM 表示 circulatory mortality 循环系统疾病死亡率,RM 表示
respiratory mortality 呼吸系统疾病死亡率,NAM 表示 non-accidental mortality 非
意外总死亡率(这个视频里确实写错了,少了个「非」)
用大白话说,三条线都是死亡增长率,只要是正的,表示是死亡率是增长的。
上面的柱子, 表示PM2.5浓度变率,是负的,北京的PM2.5 ,始终是减少的
作者的结论
1 北京PM2.5是下降的,变率一致都是负的
2 死亡率的变率都是正的,表示增加,但是增加幅度有明显变化
3 但是作者并不分析为啥会这样,就认为是应该的,很滑稽
4 2008年因为奥运,PM2.5应该有显著减少,所以死亡率“增率”显著降低
5 所以作者认为PM2.5 可能对死亡率增率减少有贡献(非常弱的结论,就凭2008年的情况)
最后作者的结论
Our analyses conclude that temperature and particulates, exposures to both of
which are expected to increase with climate change, might act together to
worsen human health in Beijing, especially in the cool seasons.
但是,柴公知就可以得到一个科学界公认的结论:
当PM2.5升高的时候,人群的死亡率是随之上升的
从作者原图里,得到的是完全相反的结论。
文献里地表述,大家可以核实
Fig. 6 depicts the interannual variability of the mass concentration of PM2.5
and the estimated percent increase for PM2.5 in daily mortality from 2005 to 2
009. It can be seen that the PM2.5 levels generally declines in recent years
in Beijing, whereas the relative risk shows different change trends. Overall,
the level of the estimated percentage increase assumes an escalating tendency
during the study period, in addition to having a low value in 2008 because
strict atmospheric pollution control measures were implemented in Beijing–
Tianjin–Hebei region before the Olympics games (Xin et al., 2010 and Xin et
al., 2012). But it bounced off the bottom and started a new uptrend after 2008
. The values which show the largest effect in 2009, rose sharply again after
the Beijing Olympics. Under this serious current situation, a 10 μg m−3
increase of PM2.5 corresponded to more than 1.00% increase of non-accidental
mortality, respiratory mortality, and circulatory mortality.