

电感耦合等离子体质谱法测定土壤微量元素的工作曲线探讨
孟晓龙
(核工业二O八大队分析测试中心,内蒙古包头市,014010)
摘要:电感耦合等离子体质谱广泛应用于土壤样品中的多种微量元素分析。采用封闭压力酸溶法溶解地质样品,以Rh单元素标准溶液作为内标和标准物质作为曲线进行样品测定,对土壤国家标准样品中镉、铅、铬、铜、镍、锌、钴、钒、铊、锰、铍等11种微量元素测定。结果表明,绝大多数元素测定值与参考值的相对误差小于10%,其中大多数微量元素优于5%,采用标准物质作为曲线回收率更好。Discussion on Working Curveof Determination of Trace Elements in Soil By ICP-MS
Meng Xiao-long
(The analysis and test center of CNNCGeological Paryt No.208,Baotou Neimenggu 014010,China)
Abstract: Trace elements in soil samples were extensively determined byinductively coupled plasma-mass spectrometry(ICP-MS). 11 trace elements in USGSreference material samples were analyzed bypressurized acid digestion with Rhsingle-elemental solution as internal standard and matrix-matchingmixedsolutions as an external standard calibration solution for long time. Theresults suggest that relativedifferences between this study and referencevalues in concentration of trace elements are less than 10%,and most of themless than 5%.| 工作参数 | 设定值 |
| RF功率 | 1600W |
| 雾化器流速 | 0.87L/min |
| 辅助气流速 | 1.2 L/min |
| 冷却气流速 | 18 L/min |
| 扫描方式 | 跳峰 |
| 测量模式 | KED |
| 扫描次数 | 20 |
| 重复次数 | 3 |
| 元素 | 质量数 | 潜在干扰 |
| Be | 9 |
|
| Cd | 111 | MoO |
| Co | 59 |
|
| Cr | 52 | ArN,ClO,ArO,SO,ArC,HClO |
| Cu | 63 | PO2,TiO |
| Mn | 55 | ArN,ClO,HClO |
| Ni | 60 | CaO |
| Pb | 208 |
|
| Tl | 208 |
|
| V | 51 | ClO,HSO |
| Zn | 66 |
|
| 元素 | GBW07401 | GBW07402 | ||||||||||
| 标准曲线法 | 标准物质法 | 标准曲线法 | 标准物质法 | |||||||||
| ① | ② | ③ | ① | ② | ③ | ① | ② | ③ | ① | ② | ③ | |
| Be | 2.50 | 2.42 | 3.20 | 2.50 | 2.53 | 1.20 | 1.80 | 1.72 | 4.44 | 1.80 | 1.88 | 4.44 |
| Cd | 4.30 | 4.12 | 4.19 | 4.30 | 4.44 | 3.26 | 0.07 | 0.09 | 28.57 | 0.07 | 0.08 | 14.29 |
| Co | 14.2 | 14.9 | 4.93 | 14.2 | 14.8 | 4.23 | 8.70 | 8.28 | 4.83 | 8.70 | 8.35 | 4.02 |
| Cr | 62.0 | 66.7 | 7.58 | 62.0 | 64.4 | 3.87 | 47.0 | 45.7 | 2.77 | 47.0 | 47.4 | 0.85 |
| Cu | 21.0 | 22 | 4.76 | 21.0 | 21.8 | 3.81 | 16.3 | 16.8 | 3.07 | 16.3 | 16.6 | 1.84 |
| Mn | 1760 | 1729 | 1.76 | 1760 | 1742 | 1.02 | 510 | 514 | 0.78 | 510 | 509 | 0.20 |
| Ni | 20.4 | 20.9 | 2.45 | 20.4 | 21.3 | 4.41 | 19.4 | 19.5 | 0.52 | 19.4 | 18.7 | 3.61 |
| Pb | 98.0 | 103 | 5.10 | 98.0 | 102.8 | 4.90 | 20.0 | 20.4 | 2.00 | 20.0 | 20.6 | 3.00 |
| Tl | 1.00 | 1.04 | 4.00 | 1.00 | 1.03 | 3.00 | 0.62 | 0.64 | 3.23 | 0.62 | 0.63 | 1.61 |
| V | 86.0 | 89.8 | 4.42 | 86.0 | 89.8 | 4.42 | 62.0 | 65 | 4.84 | 62.0 | 63.3 | 2.10 |
| Zn | 680.0 | 701.2 | 3.12 | 680.0 | 711 | 4.56 | 42.0 | 44.2 | 5.24 | 42.0 | 44.1 | 5.00 |
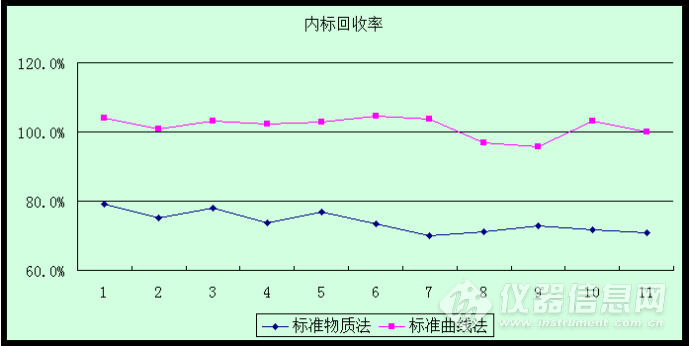
图1内标回收率
从上表3结果可以看出,两种方法比较,除去低含量的Cd的相对误差高于10%以外,其他元素的相对误差都小于10%,其中Be、Co、Cu、Ni、Tl和V的相对误差都小于5%。但从图1可以看出内标回收率差异比较大,标准曲线法回收率为75%左右,标准物质法为100%左右。| 元素 | 检出限 | 精密度% |
| Be | 0.003 | 2.0 |
| Cd | 0.03 | 4.1 |
| Co | 0.007 | 3.0 |
| Cr | 0.4 | 3.6 |
| Cu | 0.6 | 2.4 |
| Mn | 0.1 | 3.7 |
| Ni | 0.3 | 2.5 |
| Pb | 2.0 | 1.6 |
| Tl | 0.02 | 1.5 |
| V | 0.03 | 4.1 |
| Zn | 2.0 | 3.1 |